Introduction
In the Paleozoic, brachiopods were a common constituent of benthic communities in shallow-water marine environments (e.g., Baliński and Racki Reference Baliński and Racki1981; Clapham et al. Reference Clapham, Bottjer, Powers, Bonuso, Fraiser, Marenco, Dornbos and Pruss2006). Because brachiopod shells often served as secondary hard substrates for various epibionts, they have been a frequent subject of encrustation studies (e.g., Alvarez and Taylor Reference Alvarez and Taylor1987; Bordeaux and Brett Reference Bordeaux and Brett1990; Lescinsky Reference Lescinsky1995; Barclay et al. Reference Barclay, Schneider and Leighton2013, Reference Barclay, Schneider and Leighton2015; Schneider Reference Schneider2013; Zatoń and Borszcz Reference Zatoń and Borszcz, T.2013), although encrustation patterns are documented more extensively for Paleozoic brachiopods relative to Mesozoic, Cenozoic, and Recent species (Barnes and Peck Reference Barnes and Peck1996, Reference Barnes and Peck1997; Bitner Reference Bitner1996; Rodland et al. Reference Rodland, Kowalewski, Simões and Carroll2004, Reference Rodland, Kowalewski, Carroll and Simões2006, Reference Rodland, Simões, Krause and Kowalewski2014), likely due to the post-Paleozoic decline in ecological importance of brachiopods (e.g., Clapham et al. Reference Clapham, Bottjer, Powers, Bonuso, Fraiser, Marenco, Dornbos and Pruss2006; Clapham and Bottjer Reference Clapham and Bottjer2007; Manojlovic and Clapham Reference Manojlovic and Clapham2014). While encrustation patterns of Devonian brachiopods have been analyzed frequently in general terms, the dynamics of the encrusting organisms across the stages are poorly known and have never been investigated in detail, especially on uniform substrates. Moreover, only a few encrustation studies (e.g., Zatoń and Krawczyński Reference Zatoń and Krawczyński2011; Schneider Reference Schneider2013) focused on critical intervals, such as the Frasnian–Famennian (F-F) event (e.g., Hallam and Wignall Reference Hallam and Wignall1997; Racki Reference Racki2005; McGhee et al. Reference McGhee, Clapham, Sheehan, Bottjer and Droser2013). These previous studies (e.g., Zatoń and Krawczyński Reference Zatoń and Krawczyński2011) were often based on a limited number of hand-collected specimens and suffered from a lack of standardization. Standardization of sampling in terms of study scale; sample size; number of samples; replication; systematic sampling routine; collection techniques, including sample density and spacing; subsequent processing (e.g., mesh size, uniform taxonomic identification by a single/experienced investigator, equal counting); analytical protocols (e.g., resampling procedure, choice of statistics, model selection); and terminological consistency/descriptive uniformity/reporting scheme are a prerequisite of a rigorous paleobiological analysis (e.g., Hoffman and Reif Reference Hoffman and Reif1990; Kowalewski Reference Kowalewski1990; Levin Reference Levin1992; Alroy et al. Reference Alroy, Marshall, Bambach, Bezusko, Foote, Fürsich, Hansen, Holland, Ivany, Jablonski, Jacobs, Jones, Kosnik, Lidgard, Low, Miller, Novack-Gottshall, Olszewski, Patzkowsky, Raup, Roy, Sepkoski, Sommers, Wagner and Webber2001; Kidwell et al. Reference Kidwell, Rothfus and Best2001; Taylor and Wilson Reference Taylor and Wilson2003; Kowalewski and Novack-Gottshall Reference Kowalewski and Novack-Gottshall2010; Forcino Reference Forcino2012; Forcino et al. Reference Forcino, Richards, Leighton, Chojnacki and Stafford2012, Reference Forcino, Leighton, Twerdy and Cahill2015; Zatoń et al. Reference Zatoń, Borszcz, Berkowski, Rakociński, Zapalski and Zhuravlev2015).
In this paper, on the basis of newly collected and methodologically standardized samples, we explore the paleoecology and diversity dynamics of encrusting communities from the upper Frasnian and lower Famennian in the Central Devonian Field of southwestern Russia. Specifically, specimen-rich samples from deposits occurring both below and above the Frasnian/Famennian (F/F) boundary provide an opportunity to compare encrustation patterns prior to and after the F-F event. Using quantitative approaches, we examine diversity, evenness, and distribution of encrusting communities within and across the sampled time intervals.
Geological Background
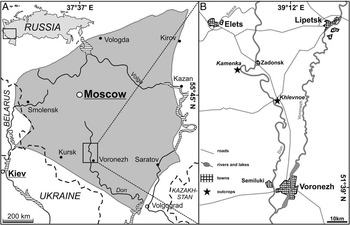
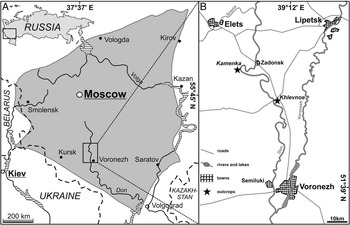
The Central Devonian Field (CDF) is located in the western part of the East European Platform, within the central and southern segment of the European part of Russia (Fig. 1A). Devonian sedimentary rocks in the CDF area were deposited directly on Precambrian basement. The localities investigated here are located in the southern part of the CDF (Fig. 1A). The nearly horizontal Upper Devonian (upper Frasnian–lower Famennian) deposits investigated here crop out north of the city of Voronezh in the Zadonsk region, along the Don River Valley (Fig. 1B). During Frasnian and Famennian times, carbonate and siliciclastic shallow-marine and shelfal sedimentary rocks were deposited in the area of the CDF.
(A) Geological map of the Central Devonian Field (shaded area), Russia, with the investigated area indicated. (B) Locations of the sampled sections at Khlevnoe and Kamenka (slightly modified after Sokiran [Reference Sokiran2002] and Zatoń and Krawczyński [Reference Zatoń and Krawczyński2011]).
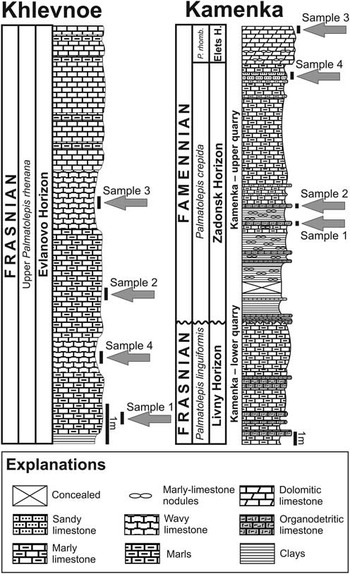
The Upper Devonian deposits in the investigated localities consist primarily of carbonate rocks with subordinate clays. The section exposed at Khlevnoe consists of upper Frasnian (Upper rhenana conodont Zone, Evlanovo Regional Stage) limestone and marls (Fig. 2; for details, see Sokiran Reference Sokiran2002; Filipiak and Zbukova Reference Filipiak and Zbukova2006; Zatoń and Krawczyński Reference Zatoń and Krawczyński2011). In Kamenka, the samples derive from the “upper quarry,” where lower Famennian (crepida conodont Zone, Zadonsk Regional Stage) limestone, marls, and clays capped by dolomitic limestone (rhomboidea conodont Zone, Elets Regional Stage) are exposed (Fig. 2; for details, see Sokiran Reference Sokiran2002; Filipiak and Zbukova Reference Filipiak and Zbukova2006; Zatoń and Krawczyński Reference Zatoń and Krawczyński2011). The lowermost Famennian (triangularis conodont Zone) is missing, because the F/F boundary in the CDF falls within an erosive hiatus (see Aristov Reference Aristov1988; Ovnatanova and Kononova Reference Ovnatanova and Kononova2001; see also Sokiran Reference Sokiran2002; Filipiak and Zbukova Reference Filipiak and Zbukova2006; Zatoń and Krawczyński Reference Zatoń and Krawczyński2011; Zatoń et al. Reference Zatoń, Zhuravlev, Rakociński, Filipiak, Borszcz, Krawczyński, Wilson and Sokiran2014) that records marine regression during the early Famennian (e.g., see Sokiran Reference Sokiran2002; Johnson et al. Reference Johnson, Klapper and Sandberg1985). Both the upper Frasnian deposits from Khlevnoe and lower Famennian deposits from Kamenka represent transgressive successions (corresponding to the transgressive–regressive cycle IId and IIe of Johnson et al. Reference Johnson, Klapper and Sandberg1985) deposited in the epeiric Moscow Basin (Alekseev et al. Reference Alekseev, Kononova and Nikishin1996; see also Sokiran Reference Sokiran2002). Given that the late Frasnian sea-level rise (Late rhenana conodont Zone, Evlanovo Regional Stage) was slightly elevated relative to the early Famennian event (crepida conodont Zone, Zadonsk Regional Stage) in the Moscow Basin (Alekseev et al. Reference Alekseev, Kononova and Nikishin1996; Sokiran Reference Sokiran2002), the upper Frasnian rocks of Khlevnoe likely represent a slightly deeper paleoenvironment. However, organic-rich deposits, characteristic of the anoxic Kellwasser facies, do not occur in the central regions of the East European Platform, thus pointing to a shallower, well-oxygenated basin (Sokiran Reference Sokiran2002).
Lithostratigraphical sections at Khlevnoe and Kamenka, with the sampled intervals indicated (based on and modified after Sokiran [Reference Sokiran2002], Filipiak and Zbukova [Reference Filipiak and Zbukova2006], and Zatoń and Krawczyński [Reference Zatoń and Krawczyński2011]). Abbreviations: P. rhomb., Palmatolepis rhomboidea; Elets H., Elets Horizon.

Materials and Methods
Sample Collection
The material for this study was collected in two localities of the CDF, Khlevnoe and Kamenka, situated north of the city of Voronezh in the Don River Valley (Fig. 1). The samples originate from similar lithofacies, and all brachiopod shells and isolated valves from both localities have comparable taphonomic features. All brachiopod specimens represent calcitic species and typically possess well-preserved exteriors with no signs of abrasion. Although some epibionts (especially delicate colonies) may be altered, their attachment bases are usually preserved. Thus, differential taphonomic biases and additional sources of variability, such as sediment grain size (e.g., Bush and Brame Reference Bush and Brame2010), are unlikely to have affected the analyzed samples. In addition, a study on Recent encrusted brachiopods (Rodland et al. Reference Rodland, Simões, Krause and Kowalewski2014) showed that sediment grain size and composition do not exert environmental controls on encrustation patterns. The CDF deposits contain many fossils of marine origin, of which brachiopods are the most abundant (e.g., Rodionova et al. Reference Rodionova, Umnova, Ovnatanova, Rzhonsnitskaya and Fedorova1995; Sokiran Reference Sokiran2002; Zatoń and Krawczyński Reference Zatoń and Krawczyński2011) and most frequently encrusted (Zatoń and Krawczyński Reference Zatoń and Krawczyński2011; Zatoń and Borszcz Reference Zatoń and Borszcz, T.2013). Previously, Sokiran (Reference Sokiran2002) investigated diversity dynamics of brachiopod faunas across the F-F transition in the CDF area.
Eight samples consisting of brachiopod shells and disarticulated valves (substrates) were collected from the Khlevnoe and upper Kamenka quarry sections (Fig. 2). During sampling, we focused on weathered surfaces where well-preserved (sediment-free) brachiopod specimens could be easily retrieved. The brachiopod shells and valves were collected randomly for each sample. Our goal was to include more than 50 brachiopod valves in each sample, since this sample size is considered sufficient for paleocommunity analyses (e.g., Forcino Reference Forcino2012). In the Khlevnoe sections, four samples were collected from deposits representing the Upper rhenana conodont Zone. In Kamenka, three samples were collected from deposits representing the crepida conodont Zone and one from dolomitic limestone representing the rhomboidea conodont Zone (Fig. 2). Due to induration of the limestone containing the otherwise scarce brachiopod fauna (Sokiran Reference Sokiran2002: Fig. 5B; Sokiran Reference Sokiran2006: Fig. 13), the upper Frasnian deposits of the linguiformis conodont Zone, which crop out in the “lower quarry” at Kamenka, were not sampled.
Specimens and Sample Handling
The collected brachiopods consist of complete shells (both valves articulated), complete but disarticulated valves (pedicle and brachial), and incomplete (fragmentary) shells/valves. Each single valve, even in complete shells, has been treated as a separate substrate for potential encrustation. Thus, a total of more than 1300 brachiopod shelly substrates (618 valves from Khlevnoe and 717 valves from Kamenka) were collected (see Table 1, Supplementary Appendix 1). Although the brachiopod species from the localities sampled are well known (see Sokiran Reference Sokiran2002, Reference Sokiran2006; Zatoń and Borszcz Reference Zatoń and Borszcz, T.2013), they were identified to the genus level for the purpose of the present study. This is justified by the fact that genera from particular regional stages of the upper Frasnian of Khlevnoe and lower Famennian of Kamenka are typically monospecific (e.g., Sokiran Reference Sokiran2002). The exception are productids of the genus Donalosia, which in the lower Famennian (Zadonsk Regional Stage) of Kamenka are represented by two species: D. kosharica and D. multispinosa (E. Sokiran personal communication 2015). Some shells, especially fragmentary specimens, could not be identified and were excluded from the analyses that required information about taxonomic identity of the substrate. The complete shells and valves were subjected to detailed quantitative analyses using a wide array of statistical methods and exploratory strategies (Brett et al. Reference Brett, Smrecak, Parsons-Hubbard and Walker2012).
Summary of data on the total number of valves collected and the number of valves encrusted.

Each collected bioclast was inspected using a Nikon SMZ1000 binocular microscope, and all encrusters (episkeletobionts, sensu Taylor and Wilson Reference Taylor and Wilson2003) were identified to the genus level whenever possible. The use of genera as a surrogate for species richness has been validated in previous studies of both epibionts (Grabowska et al. Reference Grabowska, Grzelak and Kukliński2015) and macrobenthos (e.g., Włodarska-Kowalczuk and Kędra Reference Włodarska-Kowalczuk and Kędra2007) and a diverse suite of present-day clades (Williams and Gaston Reference Williams and Gaston1994). Endobionts (in the form of preserved traces) were not found.
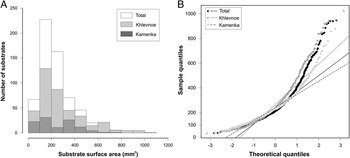
All encrusters on a given substrate (pedicle/brachial/fragmentary valve) were counted. Because the isolated valves were filled with indurated sediment, only their external surfaces were studied. A total of 633 valves were sufficiently complete to measure surface area, which was estimated using a square-gridded plankton net, 1×1 cm, with a mesh size of 1 mm2 (Kukliński and Barnes Reference Kuklinski and Barnes2008). The measured substrates did not differ significantly in surface area between localities and samples (mean surface area: Khlevnoe 278.94 mm2, SD=34.59 mm2; Kamenka 221.08 mm2, SD=30.47 mm2).
Analytical Procedures
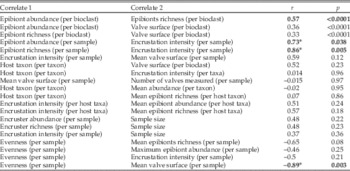
The data were analyzed using R (R Develpment Core Team 2011), including custom scripts by Alroy (Reference Alroy2016); Statistica, Version 7; Past 3 (Hammer et al. Reference Hammer, Harper and Ryan2001); Primer; and EstimateS (Colwell Reference Colwell2013). Normality of distributions was evaluated using the Shapiro-Wilk test and visually, based on histograms and quantile–quantile (Q–Q) plots. Biodiversity indices (Table 2), including Shannon’s, Margalef ’s, or Simpson’s diversity indices, were used to describe the encrusting assemblages. Spearman’s rank coefficient (r) was employed to measure pairwise correlations between selected parameters (Table 3) such as abundance, diversity, evenness, or surface area.
Diversity indices calculated for investigated epibiont assemblages. Abbreviations: Kam, Kamenka; Kh, Khlevnoe; s, sample; total, samples pooled from a given locality; Total samples, all samples from both localities pooled together.

Bivariate correlation estimated for ecological parameters of encrusting assemblages. r , Spearman correlation coefficient; p, probability of type I error. Minus sign (−) denotes negative correlation; bold type with asterisk (*) indicates strong correlation; bold type alone indicates moderate correlation; roman type alone indicates weak correlation, lack of correlation, or correlation that is statistically insignificant.

Richness and abundance was estimated in terms of the number of encrusting taxa and individuals, respectively, in a given sample (per sample; alpha diversity), substrate taxon (per host genus), and bioclast (per bioclast; micro-alpha, sensu Borszcz et al. Reference Borszcz, Kuklinski and Zatoń2013). Encrustation intensity is defined here as the percentage of bioclasts encrusted by one or more epibionts and not the difference between number of encrusted and nonencrusted shells (Borszcz et al. Reference Borszcz, Kuklinski and Zatoń2013). As noted by Borszcz et al. (Reference Borszcz, Kuklinski and Zatoń2013), total encrustation intensity refers to mean encrustation intensity, for example, pooled among all examined samples per time interval (such as the Frasnian), while partial encrustation intensity refers to encrustation intensity captured by particular samples, substrate taxa, or particular horizons of interest. Substrate occupancy (not to be confused with “occupancy” of Pineda et al. Reference Pineda, Riebensahm and Medeiros-Bergen2002; Foote Reference Foote2016) indicates the number of bioclasts (substrates) with a particular epibiont taxon, independent of epibiont abundance. Substrate occupancy as a raw count may exceed the total number of substrates. In this case, if a single brachiopod substrate was encrusted by several epibiont taxa, an occupancy value of 1 was scored for each taxon. This is a convenient measure for the proliferation of encrusting species across hard substrates (“shelly hard substrates” in this study), irrespective of their abundance or encrustation intensity. In other words, the higher the substrate occupancy, the greater the number of substrates on which the taxon was present.
Multivariate ordinations included nonmetric multidimensional scaling (NMDS), with data square-root transformed and a dummy value (+1) added. Bray-Curtis was used as the similarity measure. Additionally, we explored different transformation methods (no transformation, log (x + 1), fourth root, presence/absence, etc.). The SIMPER (similarity percentage) test was used to calculate similarity (or dissimilarity) between the samples from Khlevnoe and the three largest samples from Kamenka, as these were most comparable. The nonparametric Wilcoxon test was used to compare two localities (or two different intervals: upper Frasnian and lower Famennian) with respect to taxonomically grouped abundance. The nonparametric Kolmogorov-Smirnov (K-S) test for two samples was used, for example, to determine whether the abundance and diversity of encrusters on brachial and pedicle valves differed. Species accumulation plots and fixed coverage subsampling (= SQS; e.g., Alroy Reference Alroy2010) were used to check how closely the samples mirrored the biodiversity of encrusters. In general, the SQS (shareholder quorum subsampling, also known as fixed coverage subsampling) method is used to estimate the relative magnitude of species richness. Unlike rarefaction, SQS tells us how many species we would find given fixed coverage (the sum of the frequencies of the species we have sampled) of the underlying abundance distribution (see Alroy 2016). The Forbes (corrected) similarity coefficient F (Alroy Reference Alroy2015), which ranges from 0 (no similarity) to 1 (identical), was used to establish the similarity of encrusting assemblages from the upper Frasnian of Khlevnoe and lower Famennian of Kamenka. Additionally, we used four measures (Jaccard, Sørensen, Morisita-Horn, Bray-Curtis) commonly employed in ecological literature and interpreted these in the same way as the Forbes coefficient. This was done to avoid dependence on a single index or measure, which would reduce the compatibility and usefulness of our results compared with other studies. The significance level (p-value) of alpha=0.05 was used in all statistical decisions.
Results
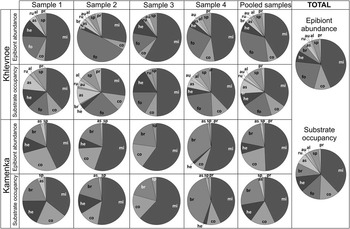
The brachiopod-hosted encrusting assemblages from the upper Frasnian and lower Famennian of the Khlevnoe and Kamenka localities are represented by 11 taxa comprising a total of 2241 individuals (Table 2, Fig. 3). The epibionts are represented by both solitary (microconchids, cornulitids, foraminifera, rugose corals, productid brachiopods) and colonial (hederelloids, trepostome bryozoans, auloporid tabulates, the problematic Ascodictyon, possibly cnidarian Sphenothallus) animals and algae preserved in the form of pyritized, fan-shaped thalli.
Pie charts contrasting epibiont abundance and substrate occupancy among samples and localities. Abbreviations: al, algae; as, Ascodictyon; au, Aulopora; br, bryozoans; co, cornulitids; fo, foraminifera; he, hederelloids; mi, microconchids; pr, productid brachiopods; ru, rugose corals; sp, Sphenothallus.

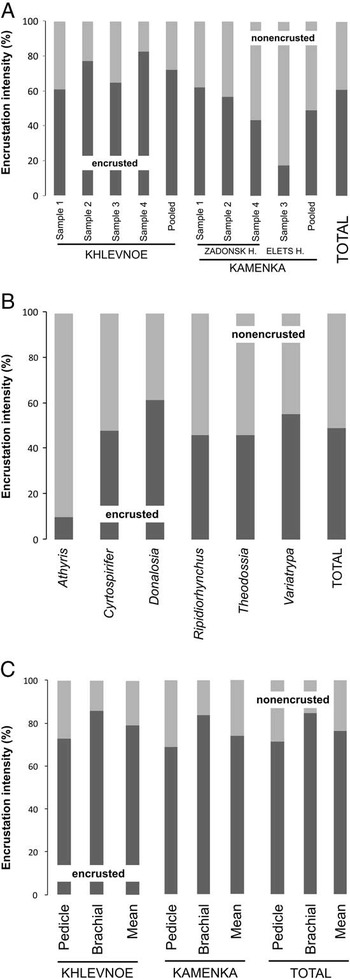
All episkeletobionts encrust brachiopod shells belonging to eight taxa represented by spiriferids (Cyrtospirifer, Theodossia), rhynchonellids (Ripidiorhynchus), atrypids (Variatrypa), productids (Donalosia), orthotetids (Schuchertella), athyridids (Athyris), and pugnacids (Globulirhynchia). Schuchertella and Globulirhynchia, because of their low abundance, were not included in detailed analyses such as encrustation intensity (see Fig. 4); however, they were included in the calculation of general encruster diversity and abundance. The surface areas of bioclasts (Fig. 5) follow a right-skewed, leptokurtic distribution (N=640, minimum [min]=11 mm2, maximum [max]=1025 mm2, mean=258.8 mm2, SD=171.2, median=210.5 mm2, skewness=1.61, kurtosis=2.87, sum=16.5645 m2), which differs significantly from normal distribution (Shapiro-Wilk: W=0.86, p<0.0001; see also Fig. 5B). Surface areas do not differ significantly between the upper Frasnian and lower Famennian intervals (cf. Fig. 5A). The surface area does not vary substantially among valve types (mean brachial valve surface: 259 mm2, N=316; mean pedicle valve surface: 256 mm2, N=284) and among substrate taxa (mean surface: Cyrtospirifer=276 mm2, N=263; Ripidiorhynchus=183 mm2, N=147; Donalosia=301 mm2, N=50), with the exception of Theodosia (mean surface: 93 mm2, N=52) and Variatrypa (mean surface: 469 mm2; N=80).
Encrustation intensity plotted for localities and samples (A), host taxa (B), and valves (C).

Histograms (A) and Q-Q plots (B) of surfaces of encrusted substrates.

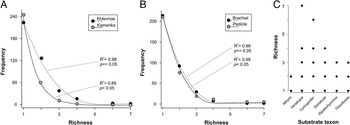
When compared with the upper Frasnian of Khlevnoe, the lower Famennian of Kamenka is characterized by elevated variability in epibiont composition among samples and a suppressed (~20%) encrustation intensity (Fig. 4). Diversity (micro-alpha, or mean epibiont richness per bioclast, Fig. 6) decreased by half in the lower Famennian (0.52 taxon per bioclast) in comparison to the upper Frasnian (1.05 taxa per bioclast; see Table 2). Taxon richness (S) or taxa pool per time interval decreased by four epibiont taxa, from 11 taxa in the upper Frasnian to seven taxa in the lower Famennian. A slight decrease in diversity is suggested by some biodiversity indices, including Shannon’s (H), Simpson’s (1−D), Fisher’s alpha, and Margalef’s (Table 2). However, the Menhinick and Berger-Parker indices point to a stasis and a slight increase in diversity, respectively (Table 2). The increase in the Berger-Parker index points to a decrease in evenness, which in turn may account for the observed decline in sampled richness in the lower Famennian of Kamenka. The absence of change in the Menhinick index was likely caused by a simultaneous decrease in both the diversity and abundance of encrusters in Kamenka, because this index is calculated as the number of species divided by the square root of the number of specimens in a sample.
Standardized richness of encrusters (number of taxa) per bioclast (A), valve (B), and host taxon (C).

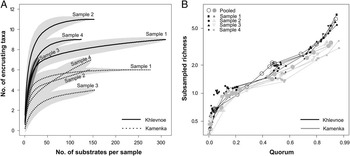
In most of our samples the accumulation curves of taxa flatten asymptotically by the time 50 specimens are sampled (Fig. 7A). These results support the hypothesis (Forcino Reference Forcino2012) that 25–50 specimens constitute a representative sample for paleocommunity analyses. When sampling is measured in terms of the quorum, the curves increase in stepwise fashion for the majority of samples, with three breaks at quorum levels around 0.2, 0.5, and 0.8 (Fig. 7A). At the quorum of around 0.9 (=90% sample coverage; Fig. 7B), subsamples are close to capturing all encrusting taxa recorded in a sample. Similar shapes of SQS curves indicate that all subsamples are comparable and that the Frasnian and Famennian samples capture the diversity signal of encrusters in a comparable fashion.
“Taxon” accumulation curves (A) and richness subsampling curve (SQS) for different quorum levels (B). Gray polygons in A denote confidence intervals that represent ±1 SD.

The abundance of encrusters (mean abundance per bioclast; Fig. 8) decreases by a factor of 3 in the lower Famennian of Kamenka (0.84) when compared with the upper Frasnian of Khlevnoe (2.41). Moreover, this decline per bioclast is also related to a 2.5-fold drop in the total number of individuals (per locality) in Kamenka (Table 2). Mean Pielou’s J evenness is about 0.1 higher in the lower Famennian of Kamenka than in the upper Frasnian of Khlevnoe. This is probably due not to a drop in the number of encrusting taxa (correlation of evenness vs. unstandardized richness turned out to be statistically nonsignificant) or in abundance, but to the disappearance of particular taxa. The evenness of marine benthos is also known to be strongly depth dependent (e.g., Ramirez-Llodra et al. Reference Ramirez-Llodra, Brandt, Danovaro, De Mol, Escobar, German, Levin, Martinez Arbizu, Menot, Buhl-Mortensen, Narayanaswamy, Smith, Tittensor, Tyler, Vanreusel and Vecchione2010), but in the present case, due to the short intervals sampled, it is hard to assess eustatic changes that may have influenced the observed trends in evenness. Evenness is highly variable among samples, but the pattern formed by the data resembles a “random walk” rather than a constrained (directional) trend, as one might expect in a transgressive–regressive sequence bracketing the F/F boundary.
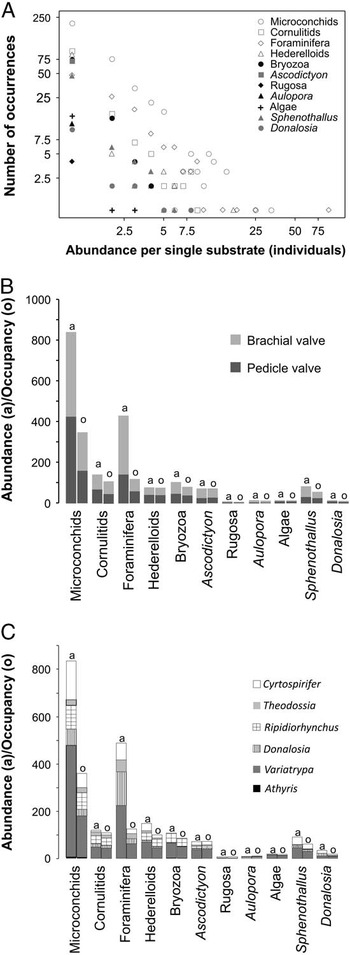
Abundance of epibiont taxa (A) and epibiont abundance and substrate occupancy by valve type (B) and host taxon (C).

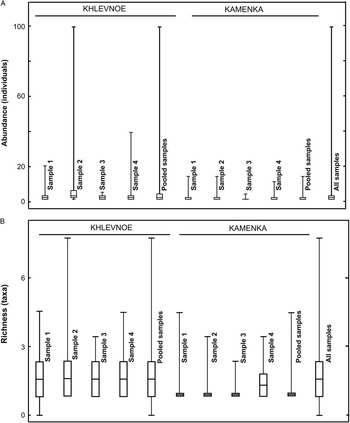
The abundance of episkeletobionts (max 98 encrusters per substrate) is moderately correlated with their unstandardized richness (max seven taxa per substrate) (Table 3); this is true both for all samples grouped together and for samples from the upper Frasnian of Khlevnoe (Fig. 9). For the lower Famennian of Kamenka, this correlation is stronger (Spearman rank correlation: Khlevnoe r=0.53, p<<0.0001; Kamenka r=0.79, p<<0.0001).
Partitioning of abundance (A) and richness (B) among samples and localities. Whiskers denote minimum/maximum, boxes show 25th and 75th percentiles, and midlines are medians.

On the basis of dominant taxa determined on the plots shown in Figure 3 (the largest area in each circle graph), the episkeletobiont assemblage from the upper Frasnian of Khlevnoe is defined as a microconchid–foraminifera assemblage, and that from the lower Famennian of Kamenka as a microconchid–cornulitid–bryozoan assemblage (Fig. 3). In Kamenka, the episkeletobiont assemblage composition is also distinguishable by the absence of foraminifera, algae, auloporid tabulates, and rugose corals.
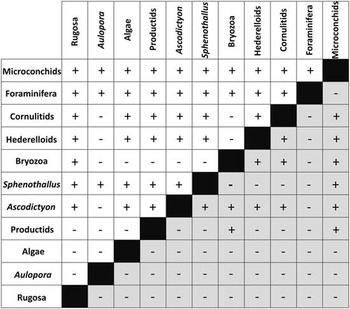
The frequency of associations (Fig. 10) depends more on the frequency of occurrences of encrusters than on their abundance: the more frequently a particular taxon occurs, the more frequently it occurs with other taxa. Microconchids, which are plentiful and cover many bioclasts (high substrate occupancy), co-occur with all encrusting taxa. Cornulitids and hederelloids from the upper Frasnian of Khlevnoe, characterized by comparable abundance, do not occur with bryozoans and auloporids.
Matrix of associations among all encruster taxa. Note that the order of taxa is nonrandom and reflects their relative abundance. White cells, Khlevnoe; gray cells, Kamenka; +, co-occurrence; −, do not occur together.

We also observed (Fig. 10) that encrusting productids coexisted with almost all encrusting taxa in the upper Frasnian, with the exception of bryozoans. In the Famennian, productids co-occurred not only with microconchids (as expected, given their ubiquity and the fact that microconchids are associated with all other taxa) but, surprisingly, also with bryozoans. This may reflect an expansion of the bryozoans’ niche during the early Famennian (in the early Famennian bryozoans increased the number of groups with which they co-occurred from three to five). This expansion may have been enabled by the extirpation of some encrusting taxa. Similarly, hederelloids and cornulitids co-occurred with Ascodictyon in the early Famennian but not in the late Frasnian.
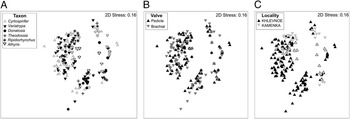
NMDS (Fig. 11A–C) ordination of encrusted host shells based on epibiont composition of encrusting organisms appears invariant to substrate taxon, valve type, locality, or sample, indicating that encruster distribution was not controlled by substrate type or spatial or temporal gradients (the same result was achieved using different methods of data transformation). This pattern may reflect random recruitment of larvae from the water column, as is frequently true in modern oceans, where larval settlement is eventually induced, guided or inhibited by chemoreception (for a review, see Pawlik Reference Pawlik1992). The lack of grouping in the NMDS ordination may indicate the absence of a single (prevailing) factor influencing encruster distribution.
Two-dimensional (2D) nonmetric multidimensional scaling (NMDS) plots of epibiont composition in relation to substrate taxon (A), valve type (B), and locality (C).

The abundance of encrusters on brachial valves differs from their abundance on pedicle valves (K-S test, D=0.14, p=0.0002). The overall abundance of encrusters differs from their diversity on both types of valves combined (K-S test, D=0.14, p=0.0003).
The Khlevnoe and Kamenka localities are statistically indistinguishable in terms of median abundance of encrusting taxa (Wilcoxon test, W=52, p=0.09, N=11 pairs, Monte Carlo p=0.09). The two localities differ with respect to encruster richness estimators (Chao 2=11.7813, Chao 2 variance=0.571, jackknife 1=jackknife 2=13). Differences between the two sites may reflect a slight increase in dominance in the lower Famennian of Kamenka (Table 2).
The percentage similarity (SIMPER) indicates that the overall average dissimilarity between Khlevnoe and Kamenka equals 66.04%, where microconchids, foraminifera, and bryozoans contribute 21.39%, 18.33%, and 7.3% of dissimilarity, respectively. Due to the number of individuals contributed by each encrusting taxon (e.g., Fig. 3), it is clear that similarity/dissimilarity between examined intervals is determined by abundant taxa.
The Forbes (corrected) similarity coefficient for combined samples from both localities is F=0. This is because Forbes is a very sensitive similarity measure, and a difference in abundance in the range of a few specimens per one taxon significantly decreases the F-value. The similarity measures for Khlevnoe versus Kamenka (Jaccard=0.636, Sørensen=0.777, Morisita-Horn=0.733, Bray-Curtis=0.439; PAST software) unequivocally indicate that encruster assemblages from these two localities differ.
Some of the correlations (rows 1, 4, and 5 in Table 3) indicated a strong relationship between encrustation intensity and epibiont richness and abundance. However, substrate size is weakly correlated with richness and abundance of encrusters. This is a counterintuitive outcome, given that the increase in surface area is expected to result in higher abundance of encrusters and higher intensity of encrustation. However, there is a strong negative correlation between substrate size and evenness (Table 3), which indicates that encrusters are less evenly distributed on larger shells.
Discussion
Encrustation Patterns
Taxonomic diversity of encrusters declined in the lower Famennian. Nearly one-third of the taxa present in the upper Frasnian were absent in the lower Famennian. The concurrent decline of encruster abundance was even more pronounced, reaching nearly 60% in the lower Famennian. Notably, in contrast to the earlier reports of Zatoń and Borszcz (Reference Zatoń and Borszcz, T.2013), we found that abundance and richness are cross-correlated (e.g., see also, Zatoń et al. Reference Zatoń, Zhuravlev, Rakociński, Filipiak, Borszcz, Krawczyński, Wilson and Sokiran2014, Reference Zatoń, Borszcz, Berkowski, Rakociński, Zapalski and Zhuravlev2015). Whereas both abundance and richness are positively correlated with encrustation intensity, the frequent occurrence of epibionts does not necessarily indicate the most diverse associations, since the high abundance of a given group could be restricted to a limited number of substrates. This may reflect a gregarious behavior of epibiont taxa, irregular larval supply, spatially variable mortality rates of larvae, or differences in taphonomic histories of host shells.
Lescinsky (Reference Lescinsky1997) inferred that in the Carboniferous, encrusters were weakly organized among different hosts. Likewise, our analyses demonstrate that the host taxon exerted limited influence on spatial distribution of encrusters. However, host type played a relatively more important role than other factors analyzed here. Perhaps this is because each host taxon employed a different life strategy, a different fouling capacity, or, less plausibly, host taxa varied in their potential for postmortem transport. Encrustation of the brachiopods may have occurred both during the life and after the death of the hosts, as previously indicated by Zatoń and Borszcz (Reference Zatoń and Borszcz, T.2013). However, it is difficult to estimate how many brachiopod valve interiors were encrusted because of infilling with indurated sediment. Those shells and valves that are barren of epibionts were probably buried quickly below the taphonomic active zone and never exhumed on the seafloor (e.g., Olszewski Reference Olszewski2004; Rodland et al. Reference Rodland, Kowalewski, Carroll and Simões2006, Reference Rodland, Simões, Krause and Kowalewski2014). Additionally, some small shells, such as those belonging to the genus Theodossia, offered an area insufficient for colonization, and thus many of them were never colonized prior to their burial.
The abundance of individual encrusting taxa among substrates and across the F/F boundary shows much greater variability than diversity measures of encrusting assemblages (Table 2). Thus, the higher importance of abundance relative to diversity decline (approx. 60% vs. 30% respectively) seems to be congruent with the recent conclusion that the abundance of some species may play a more important role for ecosystem services than local species diversity. Winfree et al. (Reference Winfree, Fox, Williams, Reilly and Cariveau2015: p. 626) presented a clear case study of crop pollination by bees, in which the authors found that “abundance fluctuations of dominant species drove ecosystem service delivery, whereas richness changes were relatively unimportant because they primarily involved rare species that contributed little to function” (see also Węsławski et al. Reference Węsławski, Wlodarska-Kowalczuk, Kedra, Legezynska and Kotwicki2012).
The decline of encrusting communities in the early Famennian may record environmental changes, possibly associated with sea-level changes at the F-F transition. The results thus suggest, tentatively, that major disturbances may impose constraints on epibiont ecology and notably impact encrustation communities. Heretofore, encrusters have been largely neglected as a source of data for conservation efforts, despite their important place in the trophic web in modern oceans and their considerable global diversity (e.g., Wahl et al. Reference Wahl, Link, Alexandridis, Thomason, Cifuentes, Costello, da Gama, Hillock, Hobday, Kaufmann, Keller, Kraufvelin, Krüger, Lauterbach, Antunes, Molis, Nakaoka, Nyström, bin Radzi, Stockhausen, Thiel, Vance, Weseloh, Whittle, Wiesmann, Wunderer, Yamakita and Lenz2011). Thus, strong comparative data from modern ecosystems are not available. The fossil data are also limited, but it is noteworthy that the decline in encrustation intensity documented here for the F-F transition is higher than the decline observed for Cretaceous/Paleogene encrusters of echinoids, which was estimated using a less precise counting method (Borszcz Reference Borszcz2012). However, both intervals show a consistent pattern of decline in encrustation irrespective of the counting method, data type, measures used, or extinction severity. Despite the observed changes, encrusting communities survived into the early Famennian, indicating that the F-F transition was not a catastrophic extinction event for encrusting biota, but rather represented an environmental perturbation that led to a notable ecological decline. Finally, comparisons with other Paleozoic reports of encrusting communities indicate that encrustation levels in the studied Devonian units were relatively high. For example, Rakociński (Reference Rakociński2011) reported that only 4% of cephalopods from the Famennian of Poland were encrusted; Głuchowski (Reference Głuchowski2005) noted that 20% of crinoid columnals/pluricolumnals from the upper Eifelian of Poland were covered by epibionts; and Lescinsky (Reference Lescinsky1997) reported that 25% of Mississippian substrates harbored epibionts, compared with 34% of shell surfaces from the Pennsylvanian.
Associations and exclusions in encruster occurrences appear to have played an important role in shaping the lower Famennian assemblages of encrusters. The exclusions may reflect allelopathy, that is, a species-specific, deterring, allelochemical effect common among various encrusting taxa in modern oceans in settings characterized by low predation or competition (e.g., Jackson and Buss Reference Jackson and Buss1975). In our case, we recorded no competition among recruits, an observation consistent with the “loosening effect” of Borszcz et al. (Reference Borszcz, Kuklinski and Zatoń2013). This effect refers to common but rarely reported instances wherein substrates are more abundant than needed for colonists (e.g., Zatoń et al. Reference Zatoń, Borszcz, Berkowski, Rakociński, Zapalski and Zhuravlev2015). Traces of predation were also generally absent in the investigated epibionts, though they are known from other Devonian deposits (Wilson and Taylor Reference Wilson and Taylor2006). The only exception was a single brachiopod shell with one pit (plausibly the ichnogenus Oichnus, sometimes referred to as Sedilichnus; see Wisshak et al. Reference Wisshak, Kroh, Bertling, Knaust, Nielsen, Jagt, Neumann and Nielsen2015) resembling drill holes found elsewhere throughout the Paleozoic (e.g., Smith et al. Reference Smith, Thayer and Brett1985; Brett and Walker Reference Brett and Walker2002; Leighton Reference Leighton2003; Kowalewski et al. Reference Kowalewski, Hoffmeister, Baumiller and Bambach2005; Huntley and Kowalewski Reference Huntley and Kowalewski2007).
Space for colonization is frequently invoked as an important factor in the development of encrusting assemblages, and intense competition is commonly interpreted as the result of limited space (e.g., McKinney Reference McKinney1995; Barnes and Kukliński Reference Barnes and Kukliński2003, Reference Barnes and Kuklinski2004a,Reference Barnes and Kuklinskib, Reference Barnes and Kuklinski2005; Barnes Reference Barnes2006; but see Buss Reference Buss1979). Typically, large shells host greater numbers of encrusters than smaller individuals (e.g., Alvarez and Taylor Reference Alvarez and Taylor1987; Lescinsky Reference Lescinsky1997; Zapalski Reference Zapalski2005; Barclay et al. Reference Barclay, Schneider and Leighton2013; Rodland et al. Reference Rodland, Simões, Krause and Kowalewski2014), but the mechanisms responsible for this pattern have not yet been adequately explained (Schneider Reference Schneider2013). In contrast to other published results (e.g., Bordeaux and Brett Reference Bordeaux and Brett1990; Borszcz et al. Reference Borszcz, Kuklinski and Zatoń2013; Rodland et al. Reference Rodland, Simões, Krause and Kowalewski2014), the results reported here suggest that substrate size is correlated weakly, or not at all, with encruster richness, encruster abundance, and other related quantitative parameters (Table 3). Such a weak correlation of substrate size and epibiont richness/abundance may have resulted from complex and variable biostratinomic histories of individual host shells. Different shells might have undergone burial at different times, and thus some large shells served longer than others as exposed substrates for colonizers. Despite the lack of notable relation between richness and host size, brachiopod surface area is strongly negatively correlated with the evenness of encrusters. This means that smaller hosts likely induced a higher selective pressure on epibionts. While total host surface area differs from exposed surface area (e.g., Bordeaux and Brett Reference Bordeaux and Brett1990) or surface area available for encrusters at a given time within an encrustation window, a smaller host is expected to offer less space for colonization.
The hypothesis of the host size–encruster abundance/evenness relationship can be potentially tested in the Holocene by direct dating of host shells (Rodland et al. Reference Rodland, Simões, Krause and Kowalewski2014). The dead shells of marine organisms can survive up to 10,000 years exposed on the seafloor (Flessa and Kowalewski Reference Flessa and Kowalewski1994; Tomašových et al. Reference Tomašových, Kidwell, Foygel Barber and Kaufman2014), providing a long-term opportunity for encrusting organisms.
Potential Implications for the F-F event
There are few field-based investigations of responses of hard-substrate biotas during mass extinctions and other biotic crises. The scarcity of such studies results primarily from a lack of suitable hard substrates capturing the critical events, and those that exist mainly concern the end-Permian (Fraiser Reference Fraiser2011) and end-Cretaceous (Sogot et al. Reference Sogot, Harper and Taylor2013, Reference Sogot, Harper and Taylor2014) mass extinctions. The results presented here are somewhat limited by a small number of samples and lack of data from the most critical horizons (the uppermost Frasnian linguiformis Zone and basal Famennian triangularis Zone), which were not accessible for sampling. However, given substantial differences between Frasnian and Famennian encrusting assemblages in the CDF, we provide a tentative assessment of the impact of the F-F transition on the regional encrusting biota.
The taxonomic diversity of encrusters clearly dropped above the F/F boundary. Of 11 taxa originally present in the upper Frasnian, four of them (tabulate Aulopora, rugose corals, foraminifers, and algae), disappeared in the lower Famennian. The absence of corals in the lower Famennian is a well-known phenomenon related to the F-F crisis itself (e.g., Oliver and Pedder Reference Oliver and Pedder1994; Poty Reference Poty1999; Berkowski Reference Berkowski2001, Reference Berkowski2002; Liao Reference Liao2002; Berkowski et al. Reference Berkowski, Zapalski and Wrzołek2016; Ma et al. Reference Ma, Gong, Chen, Racki, Chen and Liao2016). These corals occurred on various brachiopod hosts (Variatrypa, Donalosia, Cyrtospirifer, Theodossia), including genera that survived into the early Famennian (Donalosia, Cyrtospirifer). These brachiopod genera were characterized by diverse surface textures (see Schneider Reference Schneider2013), including fine ribs (Variatrypa), coarse ribs (Cyrtospirifer), and spinose surfaces (Donalosia). Thus, the disappearance of these corals is unlikely to reflect the extinction of specific brachiopod genera or the extinction of brachiopods with a certain type of shell texture. Scrutton (Reference Scrutton1988; see also Droser et al. Reference Droser, Bottjer, Sheehan and McGhee2000) linked the failure of tabulate recovery following the F-F extinction to the loss of stromatoporoids, which created many reefal niches for these corals. Indeed, stromatoporoid reefs provided much more stable substrates, differentiated in terms of niches, than did considerably smaller, more uniform, and more ephemeral brachiopod shells. The absence of foraminifera, an abundant group of encrusters on the upper Frasnian shells (Fig. 3), is intriguing, as these were found encrusting lower Famennian carbonate cobbles in the Russkiy Brod quarry, which is also located in the CDF (Zatoń et al. Reference Zatoń, Zhuravlev, Rakociński, Filipiak, Borszcz, Krawczyński, Wilson and Sokiran2014). In the upper Frasnian, foraminifera also encrust a variety of brachiopods, including genera (Cyrtospirifer, Donalosia) that made the transition into the early Famennian. It is uncertain whether foraminifera vanished from the Kamenka locality due to certain local paleoenvironmental factors or competition failure caused by the restructuring of encrusting assemblages (a change from upper Frasnian microconchid–foraminiferan to lower Famennian microconchid–cornulitid–bryozoan assemblages). However, it is worth mentioning that the paleoenvironment in the area of Russkiy Brod during the early Famennian was restricted and characterized by fluctuating salinity (Zatoń et al. Reference Zatoń, Zhuravlev, Rakociński, Filipiak, Borszcz, Krawczyński, Wilson and Sokiran2014). Whether foraminifera experienced more favorable development in the unstable conditions following the F-F event due to the scarcity or even absence of other encrusters is difficult to determine. The absence of encrusting algae is even more problematic. Their disappearance may be related to some paleoenvironmental changes during the F-F event. However, in the upper Frasnian deposits, encrusting algae are preserved solely as pyritized thalli. Thus, if they were originally composed of high-magnesium calcite or were entirely nonmineralized, their disappearance in the lower Famennian deposits may represent a taphonomic bias. As previously argued by Schneider (Reference Schneider2013), pre- and post-Late Devonian extinction communities have not been investigated adequately with respect to taphonomy.
Although encruster richness (per substrate) declined along with the number of encrusting taxa after the F-F transition, it is possible that the development of sessile assemblages at that time was punctuated by taxonomic turnover, as noted elsewhere in the Phanerozoic for other organisms (e.g., Brett et al. Reference Brett, Ivany and Schopf1996; Behrensmeyer et al. Reference Behrensmeyer, Todd, Potts and McBrinn1997; Todd et al. Reference Todd, Jackson, Johnson, Fortunato, Heitz, Alvarez and Jung2002), as opposed to being affected by a sharp biodiversity crisis/decline or mass extinction. The F-F turnover event documented here was marked by a distinct reduction in abundance of Sphenothallus and Ascodictyon, which were common constituents of encrusting assemblages during the late Frasnian (Fig. 3). However, bryozoans became much more common in the early Famennian as compared with the late Frasnian. The rise of bryozoans may represent expansion into a new ecospace vacated by colonial and rapidly developing organisms such as auloporids. However, the most abundant encrusters in the early Famennian assemblages are microconchids (Fig. 3). The present data are consistent with previous studies indicating that this opportunistic group of encrusters flourished and became more abundant than other encrusters in the aftermaths of mass extinctions and biotic crises (Fraiser Reference Fraiser2011; Zatoń and Krawczyński Reference Zatoń and Krawczyński2011; He et al. Reference He, Wang, Woods, Li, Yang and Liao2012; Yang et al. Reference Yang, Chen, Wang, Ou, Liao and Mei2015; Zatoń et al. Reference Zatoń, Niedźwiedzki, Blom and Kear2016).
Conclusions
We examined encrusters of brachiopod hosts using standardized field sampling of the Frasnian–Famennian mixed carbonate-siliciclastic sequence exposed in the Central Devonian Field located in southwestern Russia. We examined more than 1300 brachiopod valves for the presence/absence of encrusters and encruster abundance, richness, and occupancy, along with host shell surface-area estimates. Our conclusions can be summarized as follows:
-
1. Encruster richness (per bioclast) declined along with number of encrusting taxa in the lower Famennian.
-
2. Evenness was negatively correlated with substrate size and showed greater sample-to-sample variability within time intervals than between the time intervals (Frasnian vs. Famennian evenness estimates differ by less than 0.1). The among-sample variability in evenness increased twofold in the lower Famennian, pointing to community instability following the F-F crisis.
-
3. Declines in richness and evenness that followed the F-F event were accompanied by a concomitant decrease in epibiont abundance. Mean encrustation intensity also declined, but the difference between the Frasnian and Famennian estimates was not substantial.
-
4. The co-occurrence patterns among the encrusting taxa indicate that nonrandom associations and exclusions among encrusters were altered by the F-F event. Specifically, productids co-occur with bryozoans in the lower Famennian but not in the upper Frasnian. Similarly, hederelloids and cornulitids co-occur with Ascodictyon in the lower Famennian but not in the upper Frasnian. This suggests expansion of bryozoan, hederelloid, and cornulitid niches after the F-F, likely enabled by the extirpation of some encrusting taxa. Unlike other encrusting taxa, microconchids co-occur with all other encrusting taxa in both time intervals.
-
5. Both abundance and richness of encrusters vary substantially across bioclasts but appear to be independent of bioclast surface area.
-
6. Spatial ordination suggests that the examined secondary-tier assemblages were weakly organized during the F-F interval. However, brachiopod valve type did not affect substantially epibiont encrustation patterns.
-
7. The size-frequency distribution of host shells is right-skewed but does not vary significantly across sites or time intervals.
-
8. Epibiont abundance and occupancy roughly mirror each other, suggesting widespread encrustation of the sampled brachiopods. Samples captured the majority of encrusting genera once 50 substrates (brachiopod valves) were examined.
-
9. The changes in encrusting communities across the Frasnian/Famennian boundary indicate a substantial faunal turnover and notable decline in abundance rather than a major extinction event of encrusting organisms.
Acknowledgments
This project received financial support from the National Science Centre (NCN; grant no. 2011/01/B/ST10/00576 to M.Z.). T.B. received financial support from START scholarships (2013, 2014) provided by the Foundation for Polish Science; participation in and training received during the Paleobiology Database Intensive Workshop in Analytical Methods 2013 (Macquarie University, Sydney, Australia) was cofunded from an NCN grant (2011/03/N/ST10/05776 to T.B.). Wojciech Krawczyński (Sosnowiec, Poland), Elena Sokiran, and Andrey V. Zhuravlev (St. Petersburg, Russia) are thanked for assistance in the field. Wojciech Krawczyński is additionally acknowledged for his help in making the line drawings for the maps and sections. This paper benefited from constructive reviews by David Rodland and Andrew Bush, who are gratefully acknowledged here. Mark Wilson and Michał Kowalewski are thanked for several suggestions, helpful corrections, and discussions that considerably improved the final version of the manuscript. This publication was financed with funding from the Leading National Research Centre (KNOW) to the Centre for Polar Studies for the period 2014–2018.
Supplementary Material
Data available from the Dryad Digital Repository: doi:10.5061/dryad.r885q