Political science is a social enterprise. Sharing new findings allows researchers in the field to build on the work of others. Disseminating ideas widely and quickly is essential for progress. When there are many unknowns, the more researchers can rely on the work of others to pin down some of the complications, the more illuminating any new study will be. And of course, sharing ideas beyond academia allows them to have greater political and social impact. Sharing results widely is good for individual researchers within political science as well: more attention tends to mean more citations; better chances at jobs and promotions; and easier access to collaborators, grants, and affiliations that can facilitate more impactful future research.
Over time, technology has broadened the options for sharing ideas with the rest of the field. Face-to-face conversations and in-person presentations were joined by long-distance conversations and remote presentations made possible by telephones, e-mail clients, and teleconferencing services. More recently, scholars have been turning to online social media, especially Twitter, as an even lower-cost method of sharing ideas with a large audience quickly. Twitter is free to use, messages (“tweets”) sent on Twitter are quick to compose, and any tweet can be passed along from user to user, with the potential of reaching a very large audience (with over 120 million active Twitter users daily). Political scientists even have a guide to help them navigate this new space (Searles and Krupnikov Reference Searles and Krupnikov2018).
In principle, Twitter could be a tool that substantially increases the reach of all political science research. Moreover, since it requires no travel funds and little time commitment to use, it may be an equalizing force, giving all research the opportunity to be broadcast. On the other hand, just how widely any one tweet about research spreads depends on how others interact with it. Only those tweets shared (“retweeted”) by many others will ultimately reach a large audience. Whether Twitter functions as an equalizing or centralizing force within political science is an open empirical question.Footnote 1
We construct a new dataset that allows us to systematically study the adoption and use of Twitter by political scientists. We first identify all 1,236 tenure-line political science professors at U.S.-based PhD-granting institutions who have a Twitter account as of January 2019 and compare them to the 2,903 other political science professors at these institutions who do not. Comparisons across these groups provide us with a description of who uses Twitter.Footnote 2 Then we collect up to 3,200 of each of these users' most recent tweets, also as of January 2019. With these data, we can examine how political scientists are choosing to use Twitter and whether they broadcast research using this medium.
Throughout the remainder of this paper, we refer to our sample as representative of political scientists on Twitter, or “#polisci Twitter” for short.
We start with a description of #polisci Twitter, examining who is on the platform, the institutions with which users are affiliated, and how active they are online. We show that women comprise a somewhat larger share, and that tenure-track scholars comprise a substantially larger share of political scientists who use Twitter compared to their prevalence at U.S. PhD-granting institutions. Scholars from schools with more graduate students have more followers. Tenured scholars also have more followers. Tenure-track scholars follow more people. Although individuals vary in how active they are on Twitter, the number of tweets that a user posts does not vary systematically with gender, position, or school attributes.
We then turn our attention to activity within #polisci Twitter. To begin, we characterize the experience of being a scholar on #polisci Twitter. We would not expect every political scientist to interact with every other political scientist on Twitter with equal frequency, and indeed, we find that interactions reveal eight effective communities with high levels of within-community activity, and that these communities map reasonably well onto research areas. While some scholars hold more influential positions within the Twitter network than others, these positions do not vary systematically with gender, ideology, or school characteristics. Tenure-track scholars are in a favorable position to receive information, as they tend to occupy follower network positions with high out-degree (they follow many scholars) and high eigenvector centrality (those they follow are followed by many).
Digging deeper into interactions, we find robust evidence of homophily: scholars tend to interact more frequently than chance with scholars who are similar to themselves in terms of gender, ideology, and position. Through a series of analyses designed to unpack the underlying drivers of homophily, we find evidence for different dynamics at play in each. Ideological homophily appears to be driven by liberal scholars interacting with liberal scholars to a greater extent than non-liberal scholars interact with liberal scholars (what we call “in-group homophily”). But we do not observe liberal scholars avoiding interactions with non-liberals (what we call “out-group bias”). Position similarity, on the other hand, appears to be driven by out-group bias by tenured scholars who interact less with tenure-track scholars, rather than in-group homophily of tenured scholars preferentially interacting with other tenured scholars. Gender similarity exhibits both drivers. Male scholars both interact with other male scholars significantly more than female scholars do (in-group homophily), and male scholars interact with female scholars significantly less than female scholars do (out-group bias).
We further show that much of the within-gender interaction pattern is explained by who follows whom. In other words, part, though not all, of the explanation for why male scholars mention other male scholars and retweet their tweets at a higher rate appears to be that they follow more male scholars and so are more exposed to their activity. When we restrict our sample to only those users who our dataset reveals have posted a tweet that included the hashtag #womenalsoknow and #POCalsoknow, a reference to two organizations dedicated to elevating the voices of women and people of color in academia, we continue to observe in-group gender homophily but not out-group bias. Male scholars who have used these hashtags are not significantly less likely to mention a scholar who is female.
A striking pattern also emerges when we consider position and gender simultaneously. Tenure-track political scientists differ by gender in the extent to which they “mention across” or “mention up.” Male tenure-track political scientists are most likely to mention tenured male political scientists. Female tenure-track political scientists, by contrast, are most likely to mention other tenure-track female political scientists.
We then narrow our focus to engagements with users who tweet about research specifically. When we do, we observe homophily on fewer dimensions, though gender persists. Male scholars are disproportionately more likely than women to re-tweet research shared by other men, whereas there is no difference when examining re-tweets of research shared by women. This finding is consistent with research by Usher, Holcomb, and Littman (Reference Usher, Holcomb and Littman2018) who demonstrate similar patterns among male and female journalists.
Our data are complete for a very specific slice of the field of political science on Twitter—professors at PhD-granting institutions in the United States—and at a particular point in time—early 2019. That users of Twitter and their behavior can change easily is a key virtue of the platform. Rather than lament that future research may find different results from ours, we are hopeful that our research may help spark changes in Twitter, both in who opts to use it, and how users treat research that they encounter on the platform. Knowing what #polisci Twitter is like at one point in time helps to make that possible. Furthermore, we want to highlight the descriptive nature of our research. The data we collect and analyze do not lend themselves to counter-factual causal reasoning. Following Gerring (Reference Gray and Phillip2012), we argue that this comprehensive description is worthwhile on its own merits.
We observe strong evidence of scholars engaging with one another and with one another's research on Twitter, with little evidence of firm divisions between junior and senior faculty, or between those with different ideologies. To the extent that we observe differences in interactions by gender, they do not manifest in large differences in the reach of research on Twitter. However, this means that existing gender inequalities in the discipline are reproduced on Twitter, highlighting the need for more active effort on the part of tenured male scholars to promote the work of female scholars.
Our hope is that this high-resolution snapshot of #polisci Twitter will not only inspire further investigation into political scientists' use of the platform, but also a deeper investigation into what the ideal use of Twitter by the field would be and what measures could help to bring about such an ideal.
Twitter and Academia
The emergence of Twitter as the central hub was caused by a combination of the specific technological affordances of Twitter and other contextual factors. Twitter is intrinsically public-facing; unlike Facebook, the default setting on Twitter is for anyone to be able to see what you tweet. The character limit (combined with the capacity to share links) also encourages pithy communication, rewarding the ability to summarize ideas and results clearly and easily. This comes at the cost of inhibiting deliberation; Jaidka, Zhou and Lelkes (Reference Jaidka, Zhou and Lelkes2018) find that the 2017 switch from a 140 to a 280 character limit produced a healthier political conversation.
Twitter is also over-represented in research about communication on social media. Tufekci (Reference Tufekci2014) discusses the reasons why Twitter has come to serve as the “model organism” for this kind of research, not all of which are ideal for understanding the dynamic of online communication in general. Just like Twitter itself, Twitter's API (the system through which researchers can request large amounts of data) is open and easy to work with. And Twitter is fast—just as the short-lived fruit fly is an ideal test animal for certain biological interventions, Twitter provides rapid and frequent examples of information spreading throughout an online network. As a result, then, much of the research about the connection between sharing academic research on social media and outcomes of interest to academics (downloads, citations) was conducted on Twitter (Eysenbach Reference Eysenbach2011; Ortega Reference Ortega2016; Peoples et al. Reference Peoples, Midway, Sackett, Lynch and Cooney2016).
Still, Twitter adoption is far from uniform across academic disciplines. Results using both survey methodologies (Mohammadi et al. Reference Mohammadi, Thelwall, Kwasny and Holmes2018) and large-scale tweet analysis (Ke, Ahn, and Sugimoto Reference Ke, Ahn and Sugimoto2017) find that social scientists are disproportionately likely to use Twitter. The latter approach estimates that social scientists comprise 21% of the “scientist” workforce but 48% of the “scientists” on Twitter. The composition of the links shared by different types of scientists offers a hint as to why this is the case. Links shared by natural scientists are far more likely to be to scientific domains than are links shared by social scientists. Among the ten disciplines studied by Ke, Ahn, and Sugimoto (Reference Ke, Ahn and Sugimoto2017), political scientists are least likely to share links to scientific domains.
The likely reason for this tendency is the nexus of (political) journalists, policymakers, and political scientists who use Twitter to share and discuss the news of the day. The speed of information dissemination makes Twitter an absolute necessity for political journalists (Kreiss Reference Kreiss2016; Mourao Reference Mourao2015) and provides an opportunity of academic political science research to inform and influence the public discourse.
Twitter may also influence the career trajectories of academics themselves, which is the motivation for this paper. Twitter is not, as far as we know, explicitly used when considering hiring and promotion decisions within political science departments. Nevertheless, these decisions are based on citations, publications, and the respect for an academic's work among her peers. By exposing new research, participating in online discussions, and generally curating a recognizable online identity, Twitter may have important effects on who advances in the academic political science discipline. This analysis is fundamentally concerned with identifying who these people are, and how Twitter amplifies or mutes under-represented voices in academia.
Indeed, “networking” has recently been identified as a crucial contributing factor in the underrepresentation of women in the top Political Science journals. Breuning et al. (Reference Dion, Sumner and Mitchell2018) find little evidence of gender-based inequity in publication conditional on journal submission to the American Political Science Review. This accords with Barnes and Beaulieu’s (Reference Barnes and Beaulieu2017) argument that women with improved networking opportunities are more likely to submit to top journals.
Thus, although there are structural issues that can only be addressed by years of concerted effort (Sen Reference Shen, Liu and Xie2018), efforts to improve the visibility of female scholars can begin to counteract the implicit bias that limits their access in the discipline (Beaulieu et al. Reference Beaulieu, Boydstun, Brown, Dionne, Gillespie, Klar, Krupnikov, Michelson, Searles and Wolbrecht2017). Analysis of Twitter sharing patterns can also complement analysis of gendered citation patterns (Dion, Sumner, and Mitchell Reference Dion, Sumner and Mitchell2018). The fact that Twitter accounts are all “solo authored” affords analytical purchase on the extent to which co-authorship trends are driving observed gendered citation patterns (Esarey and Bryant Reference Esarey and Bryant2018).
Although each of these tendencies is intrinsically linked, another important angle on equity in the discipline is institutional prestige. Beyond the sizable inequality in resources, prestige plays a role in paper acceptance rates, although this varies by journal and editorship (Breuning et al. Reference Dion, Sumner and Mitchell2018). To make an apples-to-apples comparison, we restrict our data collection to include only faculty at U.S. PhD-granting institutions—scholars at smaller or teaching-focused institutions face distinct incentives.Footnote 3
The centrality of news, journalism, and political commentary to the popularity of #polisci Twitter raises the salience of ideological divisions within the discipline. Each person on Twitter has a number of distinct identities that become active when different topics are discussed (Munger Reference Munger2017), so the prominence of political news on the platform has the effect of frequently activating partisan identities. The question of ideological diversity in political science is an active and important one, and the topic of a recent symposium in PS: Political Science and Politics (Rom Reference Rom2019).
Gray (forthcoming) argues that the unequal ideological distribution of political scientist can create “blind spots” in the types of research questions that we ask and our intuitions about the plausibility of findings. It is possible that Twitter use could exacerbate these trends: the dissemination and public discussion of political science research might be especially inflected by ideology in a forum where partisan identities are often activated.Footnote 4
Data
The list of 131 PhD-granting institutions in the United States was taken from the “For Students” page on APSA's website. This list includes multiple institutions within the same university; for example, it treats Harvard University and the Harvard Kennedy School as distinct entities.
In December 2018, a research assistant was instructed to search each institution's Faculty web page and record the name, title, and gender of each faculty member.Footnote 5 They then searched for that person on Twitter and recorded whether an account could be located and, if so, that person's Twitter username.
The final list was spot-checked for completeness and passed our test for thoroughness. Once we had identified these accounts, we accessed the Twitter API to scrape the account information and record the 3,200 most recent tweets from each user, the maximum allowed by Twitter.Footnote 6
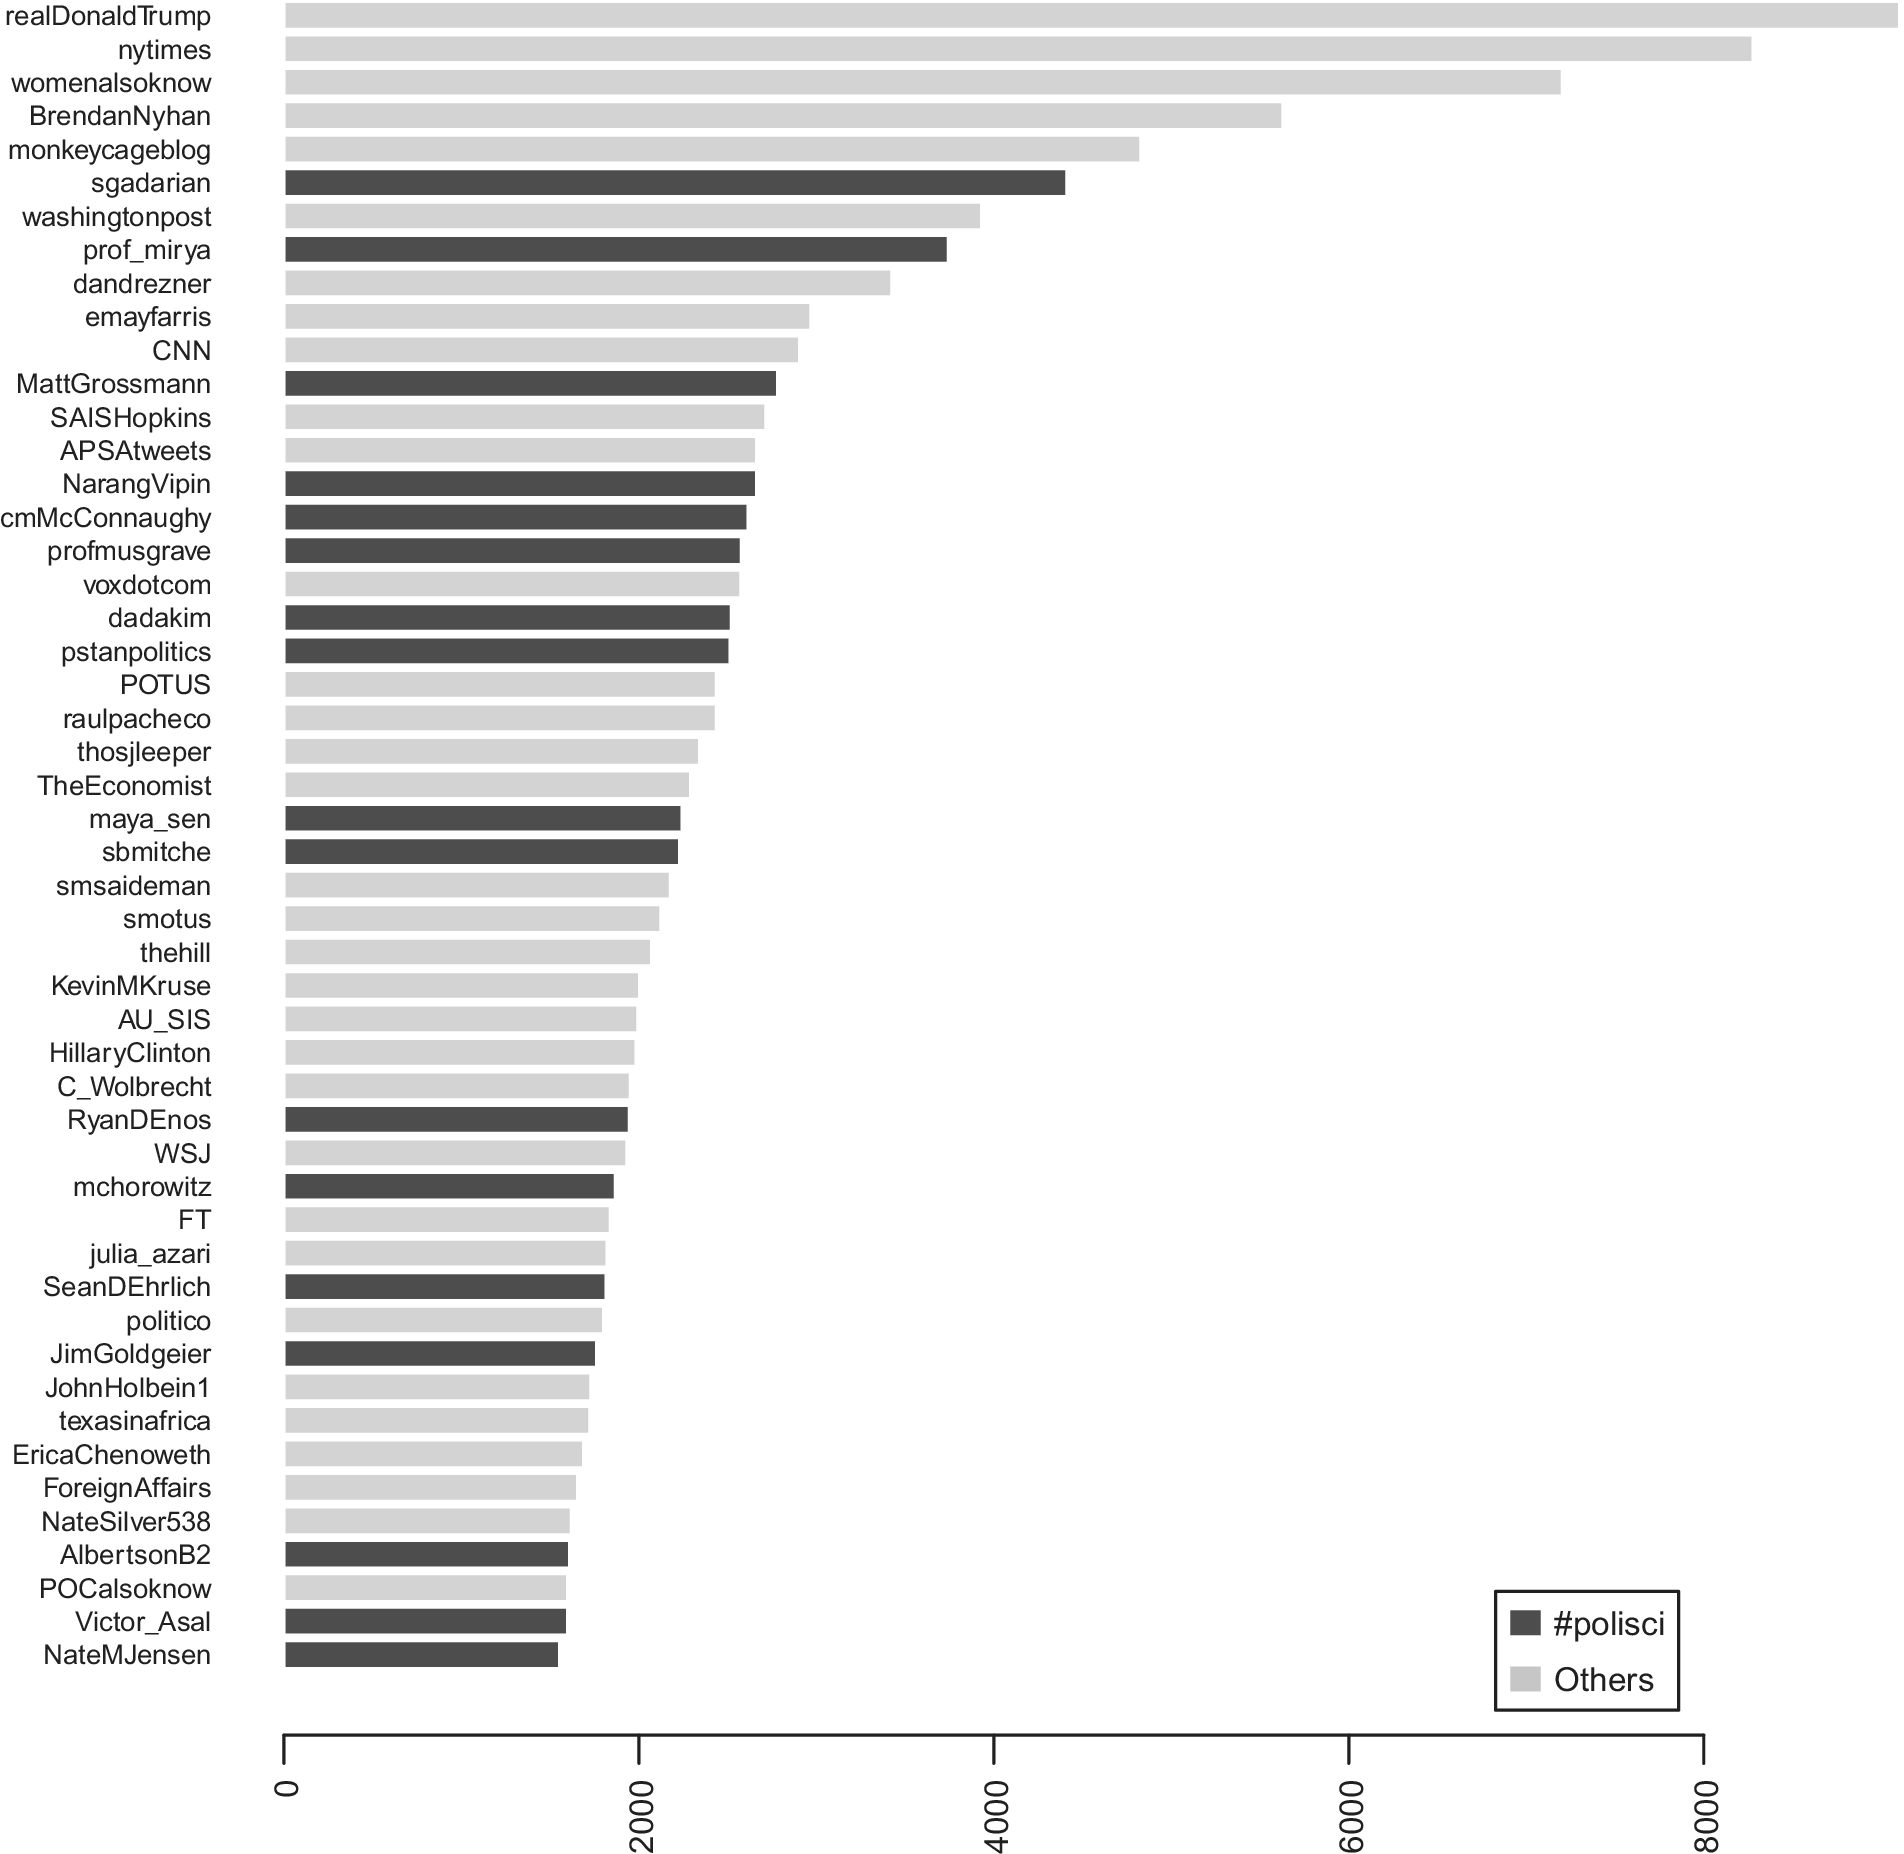
Given the self-imposed constraint of only examining faculty at PhD-granting institutions, we do not have Twitter accounts for several of the most central actors in our network. The top-fifty most-mentioned accounts are summarized in figure 1 and are shaded dark gray if we include these accounts in our #polisci dataset. The top-fifty accounts contain many media outlets, unsurprising for Twitter users with a professional interest in politics. This list also contains several political scientists, including a handful who are not included in our dataset since they were employed in December of 2018 at non-PhD granting institutions.
Top 50 most-mentioned entities overall
Note: Top 50 Twitter accounts mentioned by #polisci Twitter. Dark gray bars indicate accounts that are included in our #polisci Twitter dataset.

Finally, we note the appearance of two accounts that are especially germane to the analysis conducted below: @womenalsoknow and @POCalsoknow. These accounts belong to two organizations dedicated to elevating the voices of women and people of color in academia and are often associated with hashtags bearing their names. In our online appendix, we replicate our main analyses on the subset of scholars who engage with these “alsoknow” hashtags one or more times over the duration of our data. We find that these scholars also exhibit evidence of in-group homophily akin to the patterns documented in the full sample (i.e., men are more likely to retweet other men). However, there is no evidence of an out-group bias in this subset (i.e., men are no less likely to retweet content posted by a woman than a man). We posit that these patterns are consistent with this subset of scholars being more mindful of their innate biases, and provide a snapshot of how #polisci Twitter could look as awareness of under-represented voices improves.
One additional caveat is that we only have access to the tweets that had not yet been deleted. A small group uses a program to automatically delete tweets that are more than ninety days old. The motivation behind this decision is to prevent old tweets from being brought up out of context. Twitter is often used for immediate, topical conversation, a use case that is at odds with the affordance of a permanent, public, searchable archive (Marwick and Boyd Reference Marwick and Boyd2011). By finding users who had fewer recorded tweets in April than in January, we identified thirteen users who we believe are auto-deleting their tweets. This is likely an underestimate of the true number, but it suggests that the bias introduced by this behavior is not large enough to seriously skew our results.
We also matched the institutions in our sample with other datasets to characterize how adoption varies with institutional type, and to serve as control variables to adjust for exogenous factors in later individual-level analyses. The controls are largely limited by data availability, but we have decided to include them as they capture important variations in various measures of power in the discipline.
Objective measures include official designations as public or private institution as well as total graduate enrollment. We also include two measures of institutional reputation; each of these is subjective and imperfect. First, we matched with the list of Research-1 universities identified by the Carnegie Classification System as having “very high research activity.” Second, we took the departmental ranking from the US News 2018 list.
All of the figures reported in this manuscript are based on the April 17, 2019, scrape of the faculty at these 131 PhD-granting institutions in the United States. There are three important dimensions in which this sample can bias, limit, or undermine our conclusions. First there is the fact that we do not observe behavior among graduate students in political science. Our results indicate that Twitter usage is greater among younger scholars, suggesting that graduate students constitute a non-trivial part of the community that our sample ignores. Second, our sample omits the thousands of academics working at non-PhD granting institutions across the United States, as well as those working in other countries. The lack of data on scholars employed in non-U.S. institutions is particularly problematic if cultural differences in communication, norms of professionalism, and even alternative online platforms preclude generalizing our findings. Third, given Twitter's fluid nature, along with our discipline's evolving use of the platform, we do not expect our findings to persist long into the future (Munger Reference Munger2019).
Nevertheless, we believe our contribution is valuable for three reasons. First, our focus on the 131 PhD-granting institutions in the United States is chosen to maximize generalizability given the resource constraints we face. Specifically, these institutions graduate the vast majority of PhDs who go on to work in academia, either in one of these 131 institutions, or others in the United States and elsewhere. Understanding how the adjuncts, lecturers, tenure track and tenured professors, chairs, provosts, and directors who work at these 131 institutions use Twitter provides a snapshot of how these future scholars are being introduced to the professional political science community on the platform.
Second, characterizing the current state of the snapshot of #polisci Twitter available to us can help political scientists find better ways to disseminate novel research, communicate important academic findings with the public, and improve and expand the range of voices that are heard on the platform. Third, insofar as online social media platforms like Twitter reflect core tendencies in human behavior, our analysis should also shed light on broader trends in how scholars elevate and sideline research in general (Bisbee et al. Reference Bisbee, Dehejia, Pop-Eleches and Samii2017) that we hope future research will continue to explore.
Descriptive Analyses
We organize our analyses as a funnel, starting with the broadest overview of who is on #polisci Twitter. We then examine the experiences and behavior of those scholars.
Who Is on Twitter and Where?
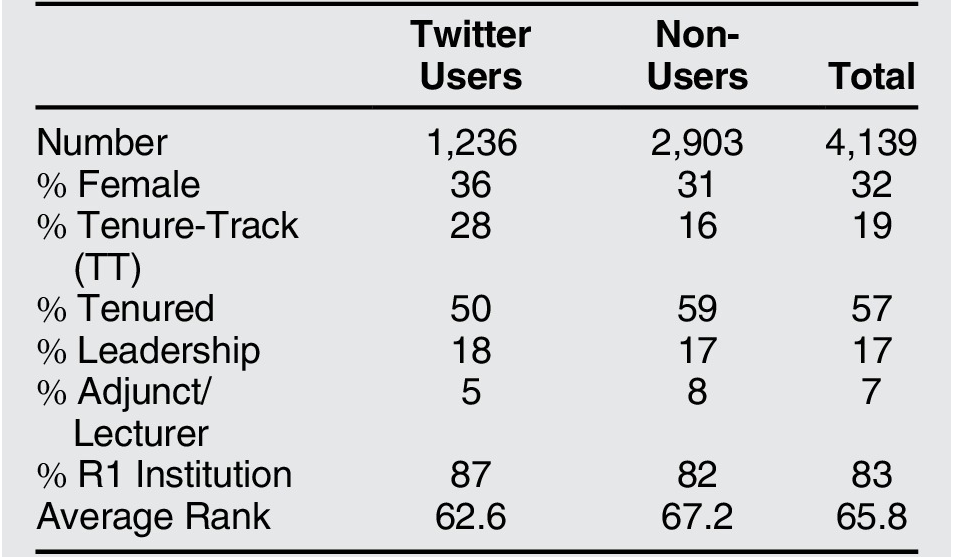
Table 1 displays basic summary statistics of #polisci Twitter. We identified a total of 1,236 Twitter users out of the 4,139 faculty on department websites, or 30%. However, this number is a moving target. Between the time we collected the data and when we scraped Twitter (January 3, 2019), one of 1,236 was no longer active. When we re-scraped the dataset (April 17, 2019), an additional twelve accounts were no longer active.
Summary statistics based on Twitter use

These statistics also throw into sharp relief the unequal representation of women in our sample of 131 PhD-granting institutions in the United States. We emphasize that this sample is not random, and that other research finds more evidence of equality.Footnote 7 As we discuss later, our sample is representative of the institutions that produce many of the scholars who go on to work in the discipline, and on this basis alone we believe it is important to interrogate these imbalances and how Twitter can overcome or further marginalize underrepresented groups. In our sample, women are somewhat more likely to adopt Twitter, comprising 36% of the Twitter population but only 32% of the overall sample. Tenure-track professors were significantly more likely to use Twitter (they are 28% of the Twitter sample but only 19% overall). This is high-level evidence that Twitter may be useful for overcoming some traditional hierarchies within the discipline.
However, scholars from R-1 institutions and “higher” ranked institutions (from the US News and World Report) are actually overrepresented on Twitter. This tracks with previous research on the adoption of new communication technologies; Hindman (Reference Hindman2008) finds that the ostensible openness of the “blogosphere” in the 2000s in fact led to over-representation by bloggers with affiliations from elite institutions. Higher connectivity may thus tend to reinforce existing hierarchies at the institutional level.
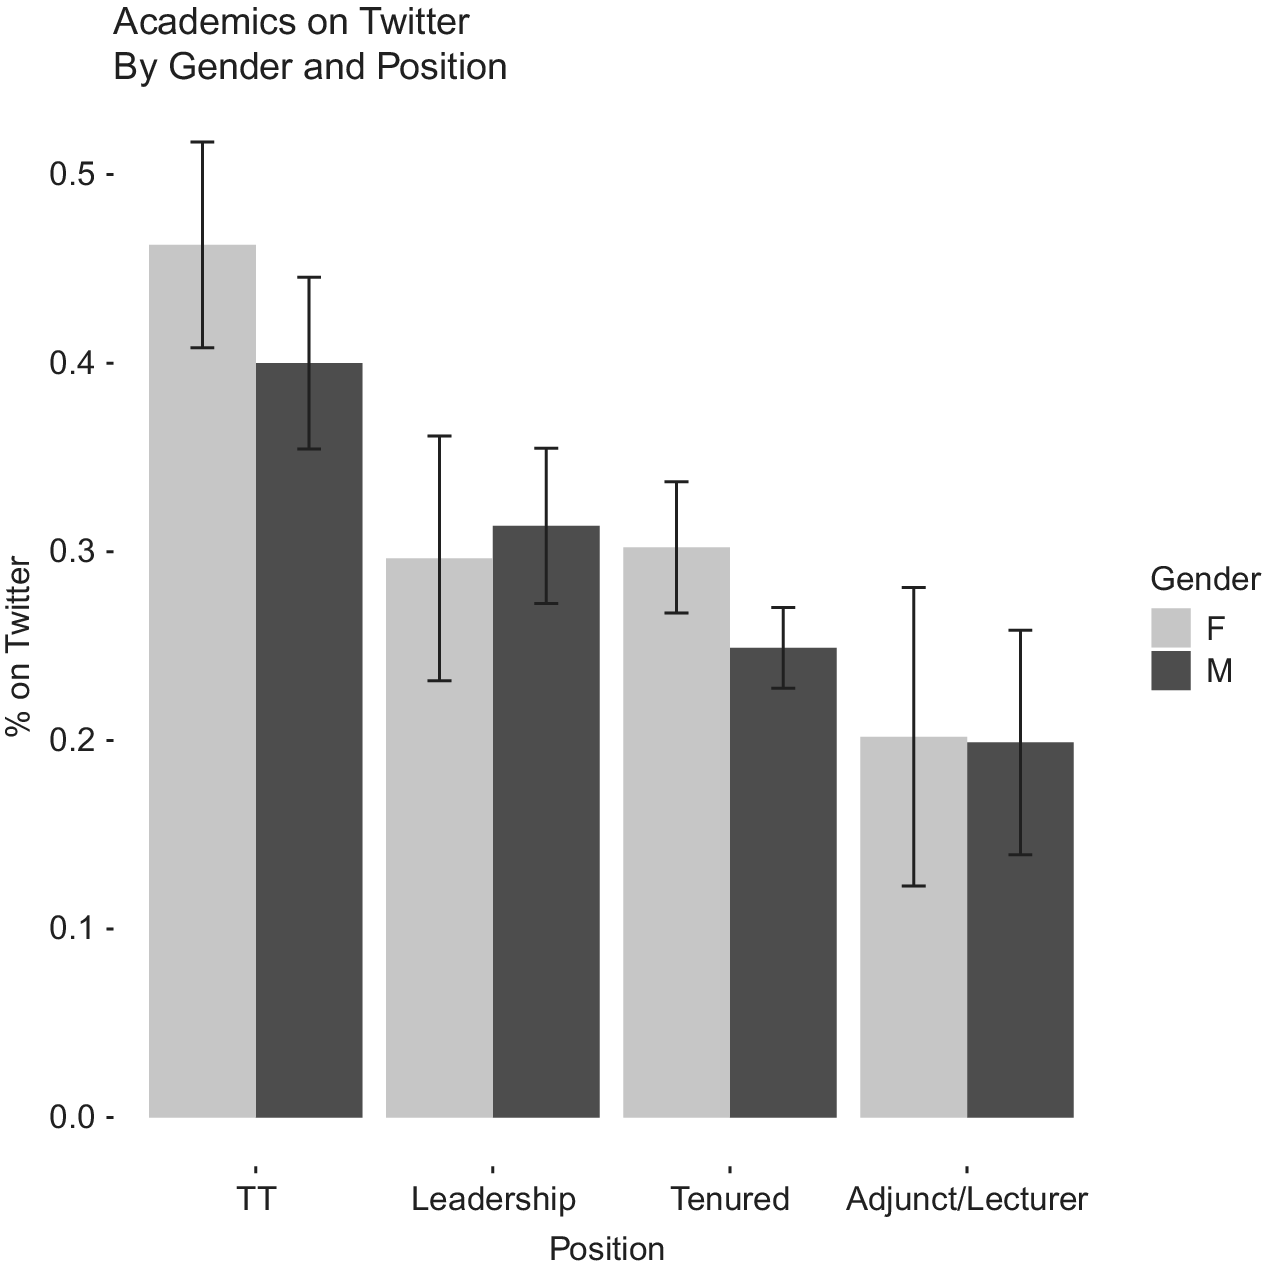
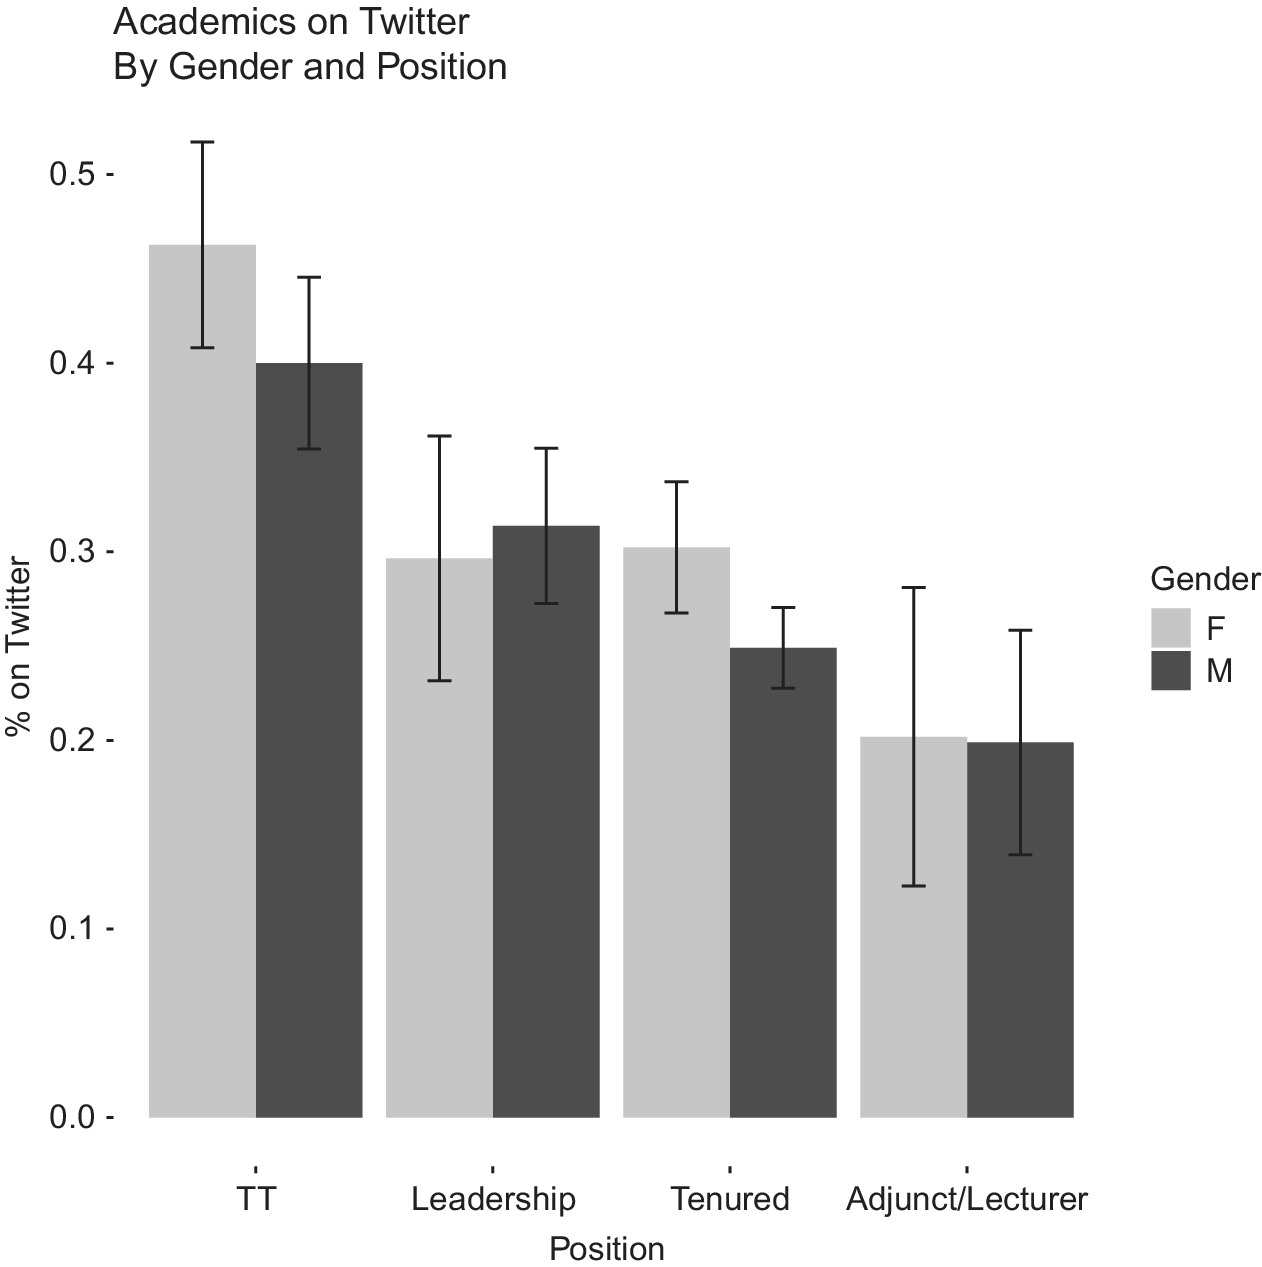
Figure 2 plots the rate of Twitter adoption by gender at different levels of career advancement. Again, we see the greatest adoption among tenure-track faculty and some evidence that female political scientists are more likely to be on Twitter than males. These differences by gender are driven by tenure-track and tenured scholars, with no difference among directors/deans/chairs/provosts (which we label as “Leadership”) or the adjuncts/lecturers category. For the remainder of the analysis, we group tenured and leadership positions together as “tenured” faculty and drop adjuncts and lecturers.Footnote 8 In our online appendix, we find no systematic differences between leadership scholars and tenured, nor any meaningful difference between tenure-track scholars and adjuncts/lecturers.
Academics on Twitter by gender and position
Note: Gendered Adoption by Career Level. Bars indicate the share of each subgroup that is on Twitter out of the total number of academics at each level of their career (x-axis).
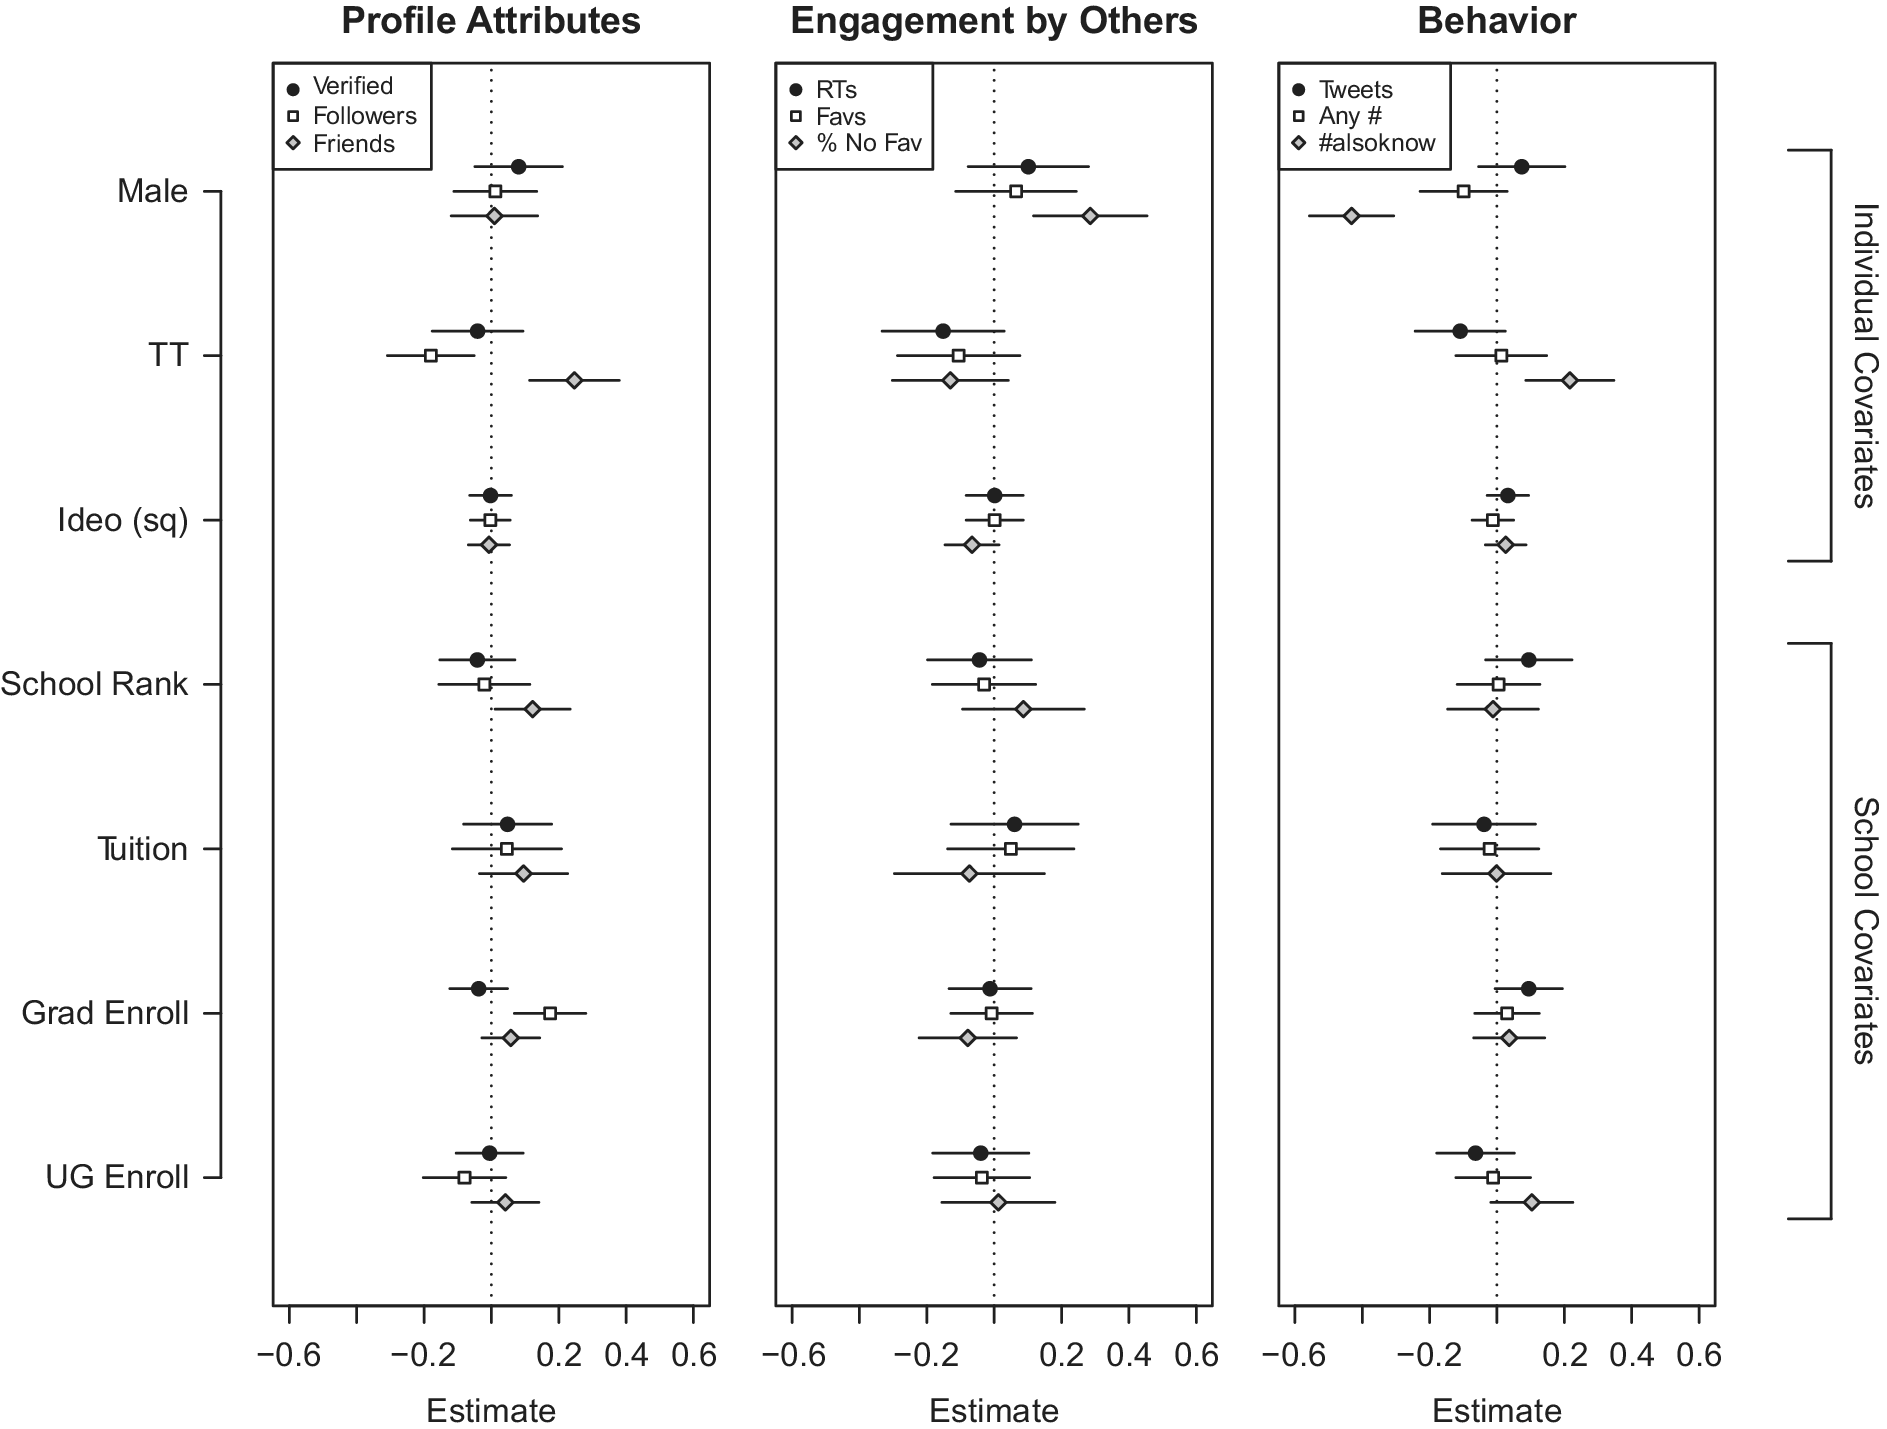
We next classify scholars' Twitter activity in terms of profile attributes including how many people they follow (“friends”) and how many follow them (“followers”), the extent to which others engage them by retweeting and “liking” their posts, and their own activity including tweet volume and hashtag use. We do so by regressing logged counts of the outcome of interest on individual and school-level characteristics via multilevel models with academics nested within schools. We include as a scholar attribute a measure of political ideology estimated based on which political actors a user follows (Barberá Reference Barberá2015).Footnote 9
Figure 3 displays the results. The left panel focuses on profile attributes and shows that tenure-track scholars have few followers but follow many. High graduate enrollment also predicts a larger number of followers, which suggests that a non-trivial amount of Twitter following behavior may occur within a given academic institution.Footnote 10
Descriptive correlations between Twitter presence and scholar attributes
Note: Regressions of number of followers and number of tweets (both logged) on individual-level and school-level covariates. Multilevel regression nests scholars within schools.

The middle and right panels show results for the level of others' engagement with a scholar's original tweets and how she uses the platform, respectively. Overall, gender, position, ideology, and school attributes are not systematically related to how much a scholar uses Twitter and how much other scholars engage her original posts. We see weak evidence that tenure-track scholars' posts are retweeted and favored less, though fewer of their tweets go completely unfavored. Also, male scholars are more likely to post tweets that go completely unliked.
The strongest patterns emerge for behavior related to the #womenalsoknowstuff or #POCalsoknowstuff hashtags. Men are significantly less likely to use the #alsoknow tags than women (approximately 22 percentage points), while tenure-track scholars are significantly more likely to engage with these hashtags (approximately 11 percentage points). In our online appendix we reanalyze our main findings among the subset of 536 scholars who use these hashtags one or more times to see if these scholars are different. The key difference that emerges is that, while in-group homophily persists in this group, there is no evidence of bias against out-groups (refer to the following section).
Network Analysis
To explore how scholars interact on Twitter, we characterize networks among them. We consider five different types of interaction that can each constitute a “link” between two “nodes'—or users—in our data:
• Follows: the underlying follower network is built on directed unweighted links of who follows whom in our network.
• All mentions: a directed weighted link, capturing re-tweets, @-mentions, replies, and quotes.
• Retweets: a directed weighted link between two users.
• Common URLs: if two users share the same URL, either independently or via a quote or re-tweet, we count this as an undirected weighted link.
• Common research: for the subset of URLs that link to scholarly research, we identify who originally shares the URL and then define directed weighted links as those who engage with the research.
Experiences: Communities on #polisci Twitter
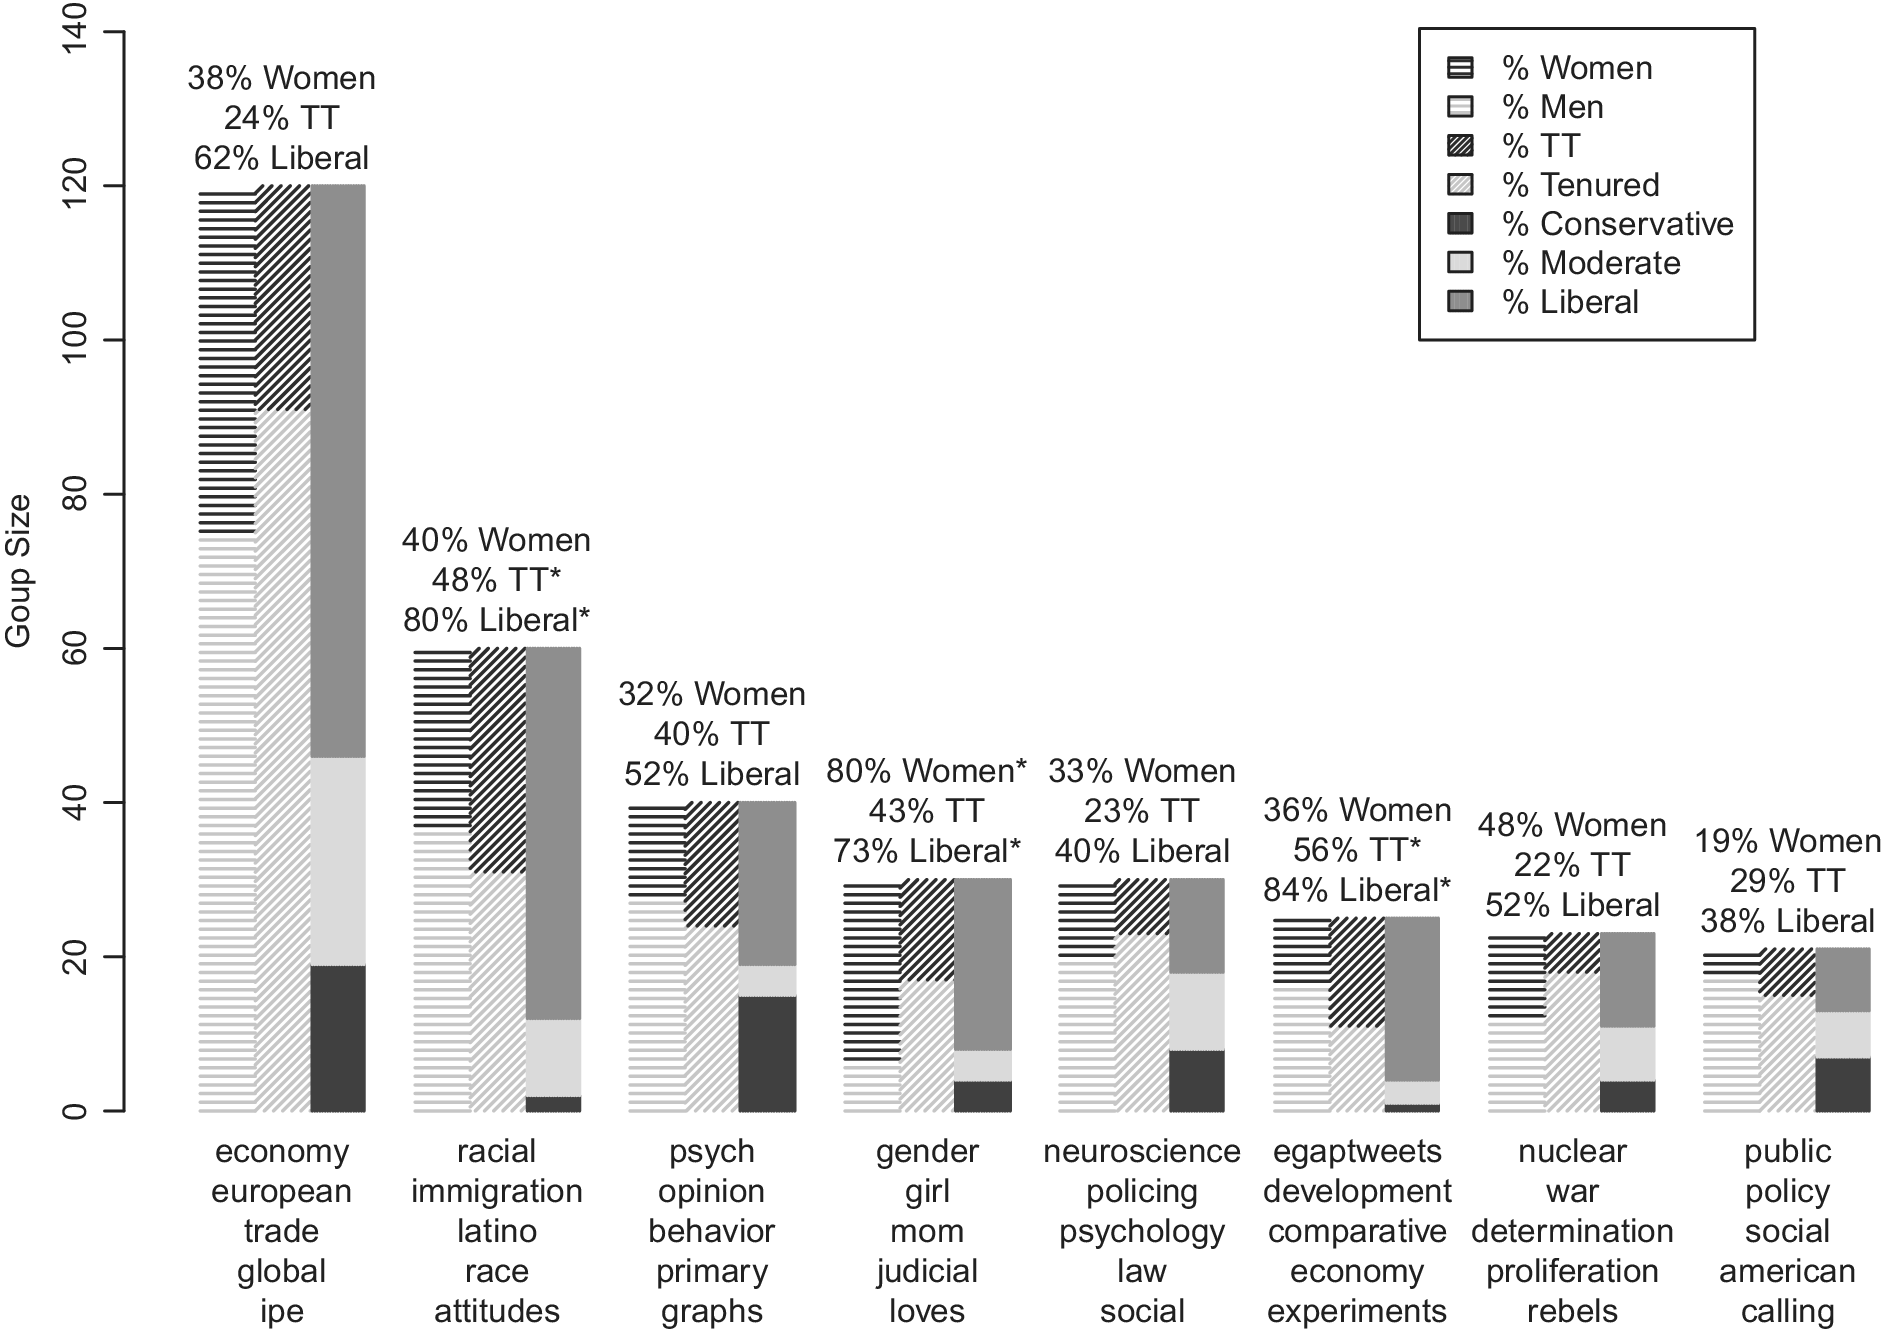
We begin by exploring how interactions are patterned in the network of who mentions whom. We use a set of techniques that look for communities within a network, evidenced by substantial interaction among the community members relative to interactions with others.Footnote 11 We identify the substantive content of these communities by calculating the most frequent terms found in the Twitter bios of their users that are infrequently found in other communities: %—a measure known as term frequency, inverse-document frequency, or TF-IDF. As illustrated in figure 4, the mention network contains eight main communities with more than twenty members.
Communities from network analysis
Note: Bars indicate the number of accounts assigned to each community where links are defined by mentions using the majority label proportion algorithm. Bars are shaded according to the share of each community that is female and male, tenure-track and tenured, and by ideology. Communities are labeled by the top five discriminating words (TF-IDF) based on text analysis of the concatenated Twitter bios of all members.

Figure 4 also presents the composition of each of these eight communities in terms of gender, ideology, and position. The gendered breakdown of research topics mirror those found by Key and Sumner (Reference Key and Sumner2018) in an analysis of dissertation abstracts, and the ideological breakdown maps neatly onto the standard left-right issue space.
Of course, when reviewing these communities, it is important to keep the underlying shares of each group on #polisci Twitter (and the general population of PhD-granting institutions) in mind. While women and tenure-track scholars only comprise 38% and 24% of the largest community and liberals dominate at 62%, these shares are actually very close to the sample itself (36% female, 28% tenure-track, and 55% liberal). We ran t-tests comparing the density of women, tenure-track, and liberal scholars in each community compared to their overall presence in #polisci Twitter. Only a few shares significantly diverged (at the 95% confidence level or greater), indicated by a star.
The most striking differences between the share of these groups in the general population and their representation in these communities are found in communities #2 and #4. Specifically, the community organized around race and immigration politics is disproportionately liberal (80%) and the gender-oriented community is disproportionately female (80%). In addition, we highlight the substantial participation in the comparative politics community (# 6) by tenure-track scholars. In sum, across all of the largest communities, the representation of women and tenure-track scholars is either commensurate to their shares in the overall population or greater. This means that there are some male, tenured faculty who are nominally on Twitter but who do not participate in the most active, largest clusters on Twitter; in practice, this is good news for Twitter's capacity to diminish hierarchies along these dimensions. On the other hand, three of the six largest clusters we identify are disproportionately comprised of liberal scholars, even relative to their general over-representation in the discipline vis-à-vis conservative scholars.
Experiences: Who Are the Most Central Users?
Next we assess importance in the network of political science scholars on Twitter. We calculate three standard measures of network centrality that each captures a different sense of importance.
The first, degree centrality, is the simplest measure; a count of the number of links each node has. With directed networks, this measure can be separated into “in-degree” (the number of links to a node) and “out-degree” (the number of links from a node). The second, betweenness centrality, captures how important a given node is to the flow of information across a network and is calculated by measuring the frequency with which a node sits on the shortest paths between any two other nodes in the network. The third, eigenvector centrality, captures the centrality of a node's neighbors, assigning a higher score to nodes who are connected to nodes that are themselves highly connected.
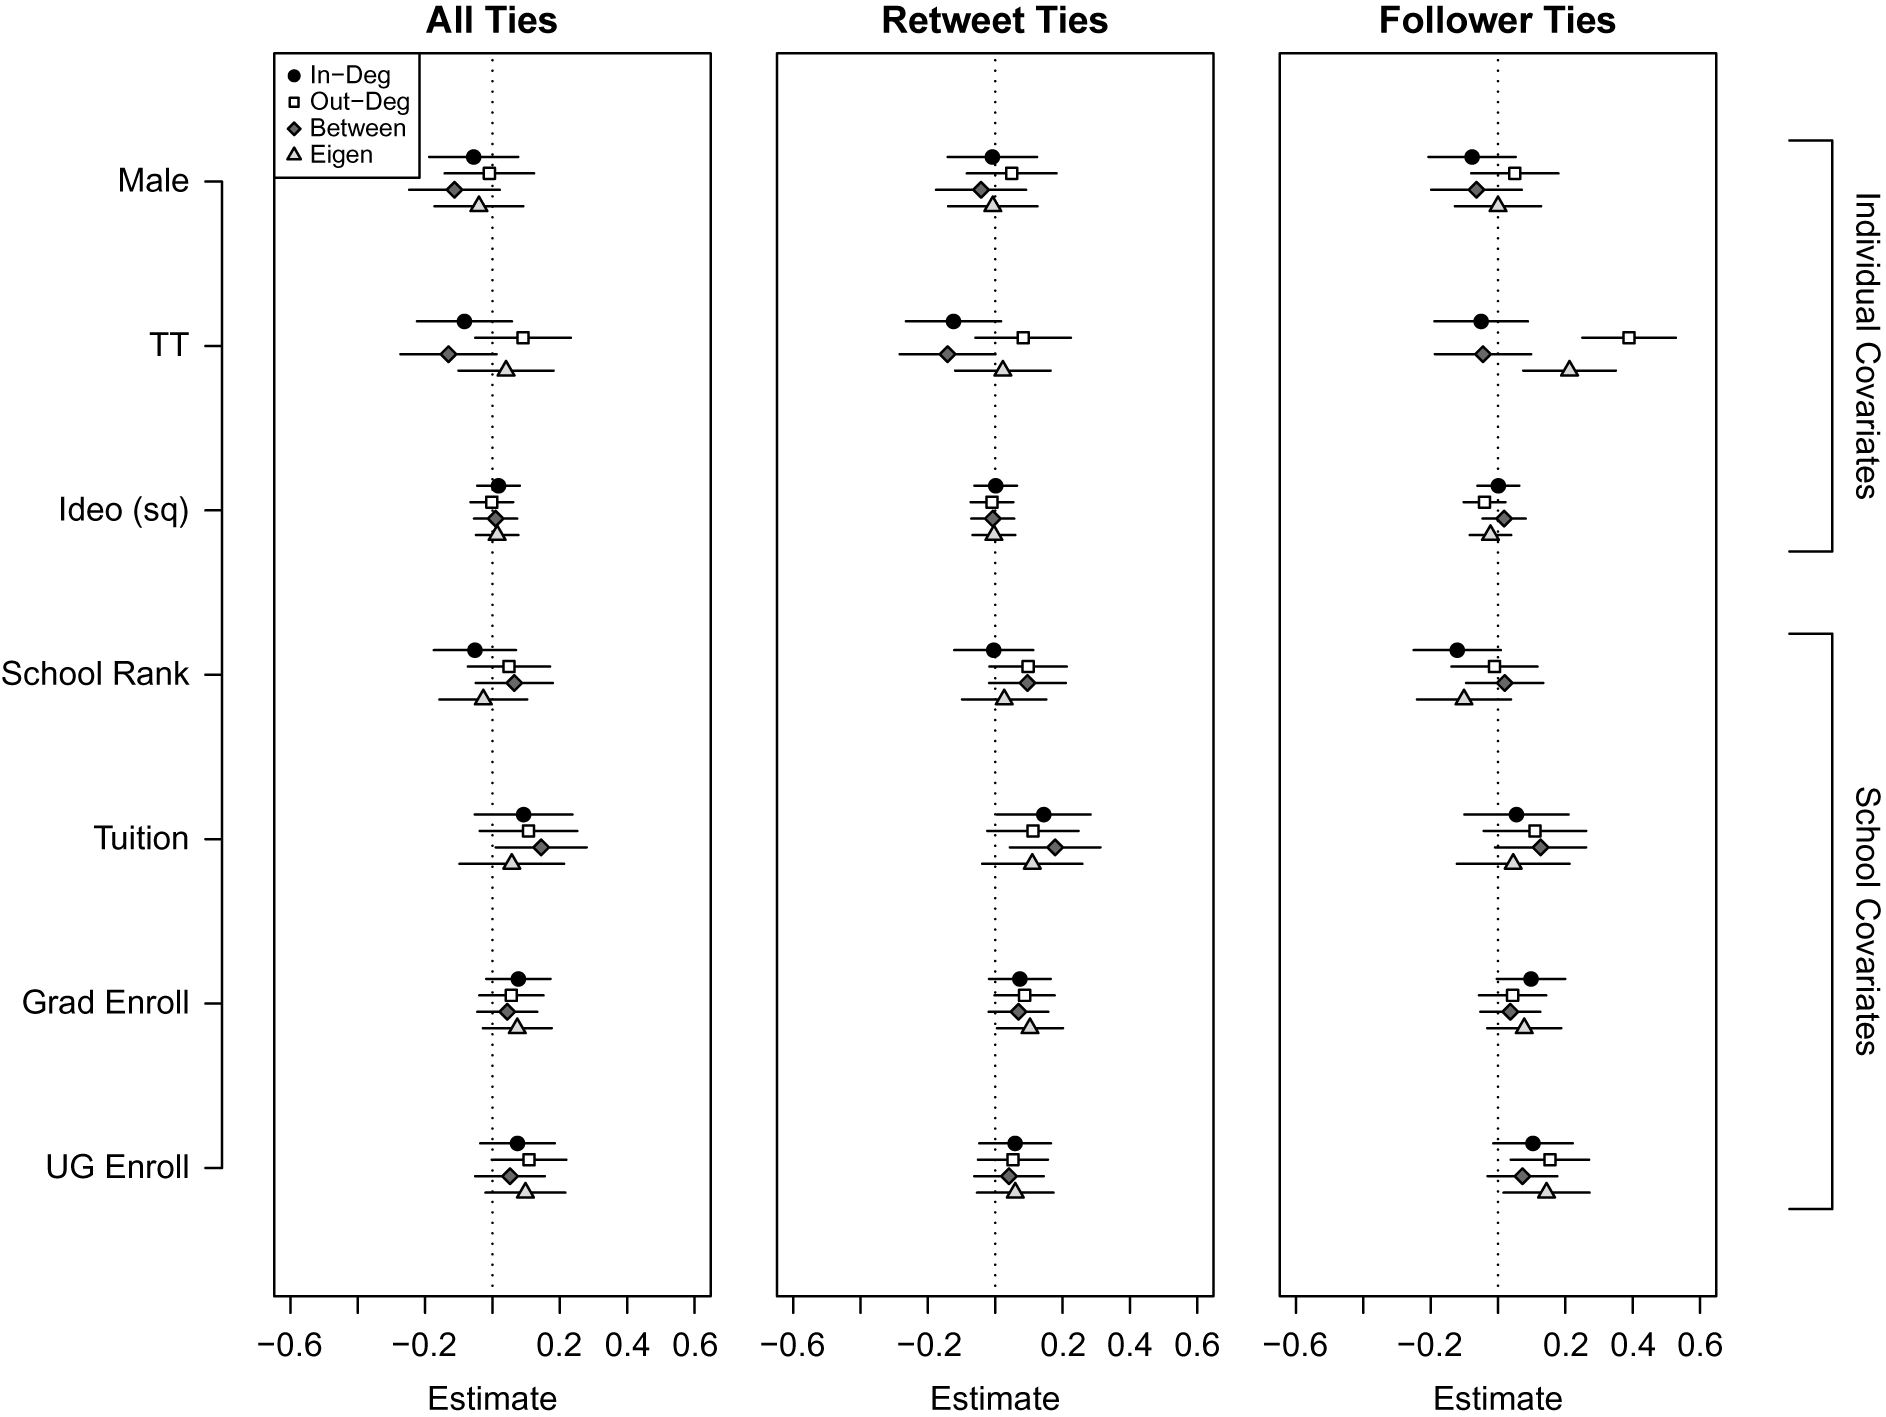
We ask whether gender, ideology, position, and school attributes systematically relate to network centrality. We regress scholars' centrality scores on these attributes, again employing the multilevel specification described earlier, with results shown in figure 5 for the network of all mentions (left), retweets only (center), and following (right).
Descriptive correlations between network centrality and scholar attributes
Note: Coefficients (points) and two standard errors (bars) are based on multilevel regression of centrality measure on individual-level and school-level covariates (y-axis). Different centrality measures are calculated based on in-degree centrality (solid circles), out-degree centrality (hollow squares), betweenness centrality (dark gray diamonds), and eigenvector centrality (light gray triangles). Links are defined according to the panel titles.

School attributes appear to have little to do with a scholar's importance in these networks. Gender and ideology are also unrelated; scholars who are highly central in networks of mentions, retweets, and following relations are not more likely to be male or liberal. The only attribute that is strongly related to network centrality is position. We see weak evidence that tenure-track scholars have lower in-degree and betweenness centrality in the retweet network. This means that they are themselves retweeted less often, and that they rarely hold a bottleneck position in the network such that their removal would devastate the ultimate reach of a tweet. Tenure-track scholars are also much more out-degree central and eigenvector central in the follower network. In other words, they follow many other scholars, and those they follow are themselves highly connected. Tenure-track scholars follow scholars important in the network.
Experiences: Who Benefits Most from #polisci Twitter?
While it is interesting to learn which users are most central in the network, this doesn't actually tell us much about who benefits most from the exposure Twitter can provide. And while membership in a community does capture an aspect of access to #polisci Twitter, it does not illuminate how the choice of engaging with another user plays out. These engagements (we use “mentions” to capture retweets, quotes, replies, and @s) elevate the profile of a scholar by exposing either their tweet or even just their account to a much broader audience.
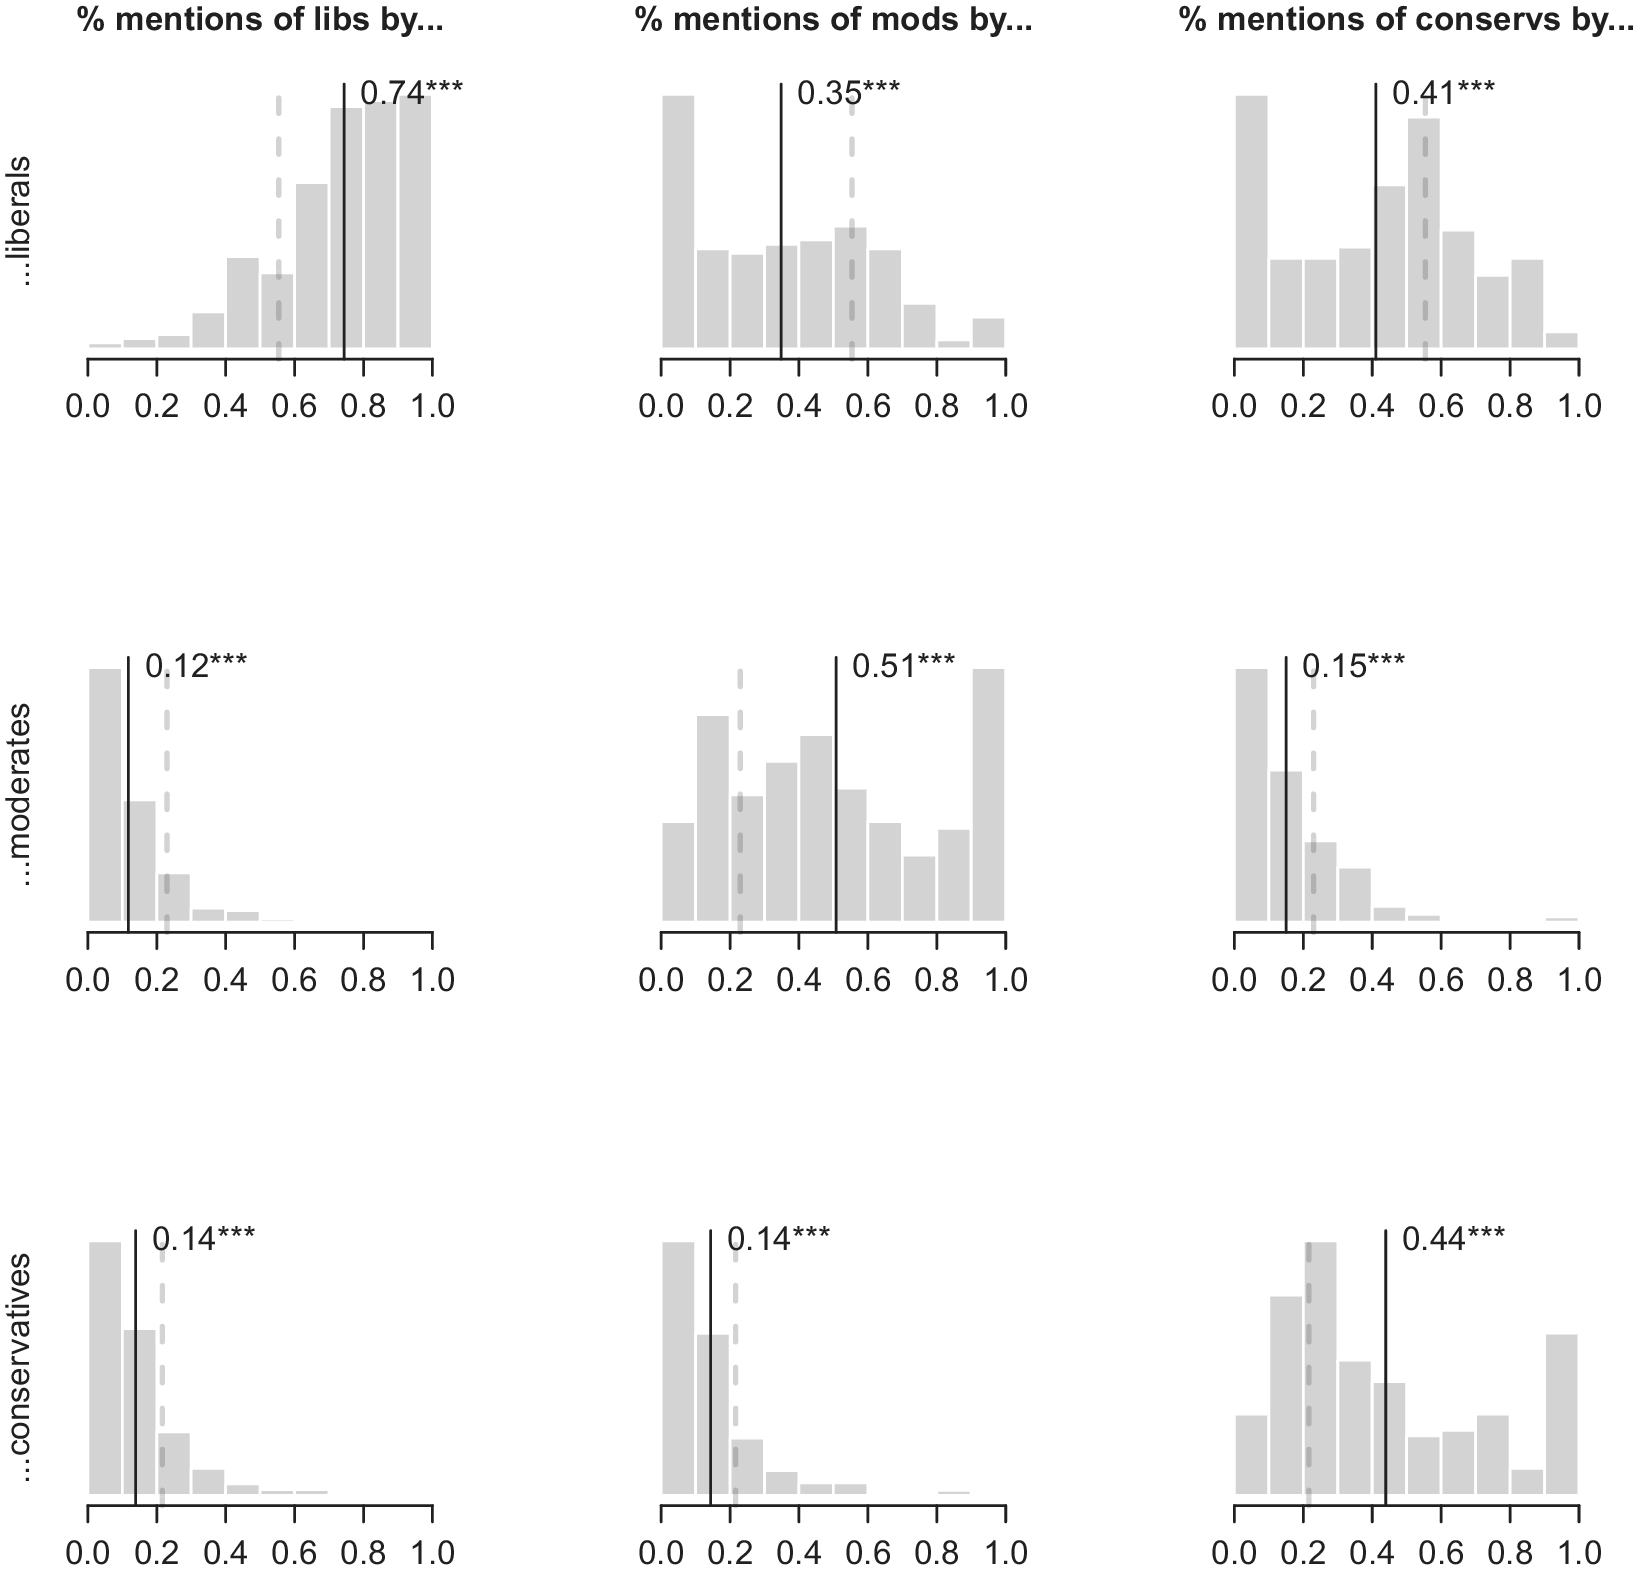
To understand who benefits from the opportunities provided by #polisci Twitter, we calculate the share of total times each user is mentioned by liberals, moderates, and conservatives; men and women; and tenured or tenure-track users in the network. Figure 6 plots these vectors as histograms for each ideological pair, with columns defining the group that is being mentioned, and rows defining the group that is doing the mentioning. Again, given the underlying percentages of each group in the data, we should not expect each group to be evenly divided across mentions. Instead, in the absence of ideological sorting, we would expect liberals to represent approximately 55% of mentions, and moderates and conservatives to represent approximately 23% of mentions each. The significance stars indicate whether a simple t-test between the average share of mentions by a group (solid vertical line) is different from the population average of that group (dashed vertical line). As illustrated, liberals are significantly more likely to be mentioned by liberals than what the population share of liberals would suggest (74% versus 55%, top-left plot). Conversely, liberals are significantly less likely to be mentioned by moderates or conservatives (12% versus 24%, and 14% versus 22%, middle-left and bottom-left plots respectively).
Distribution of mentions by ideology of mentioner and mentioned
Note: Mentions by ideology. Histograms reflect the distribution of share of a user's mentions that come from other users of a given ideology. Columns indicate the ideology of the mentioned users. Rows indicate the ideology of the mentioning user. Vertical solid lines capture the mean of the distribution, given by the black text. Vertical dashed lines indicate the share of the group in the overall data. Significance stars indicate whether a simple t-test difference between the distributions mean and the share of the group in the overall data is significant at conventional levels. * p $<$ 0.1, ** p $<$ 0.05, *** p $<$ 0.01.

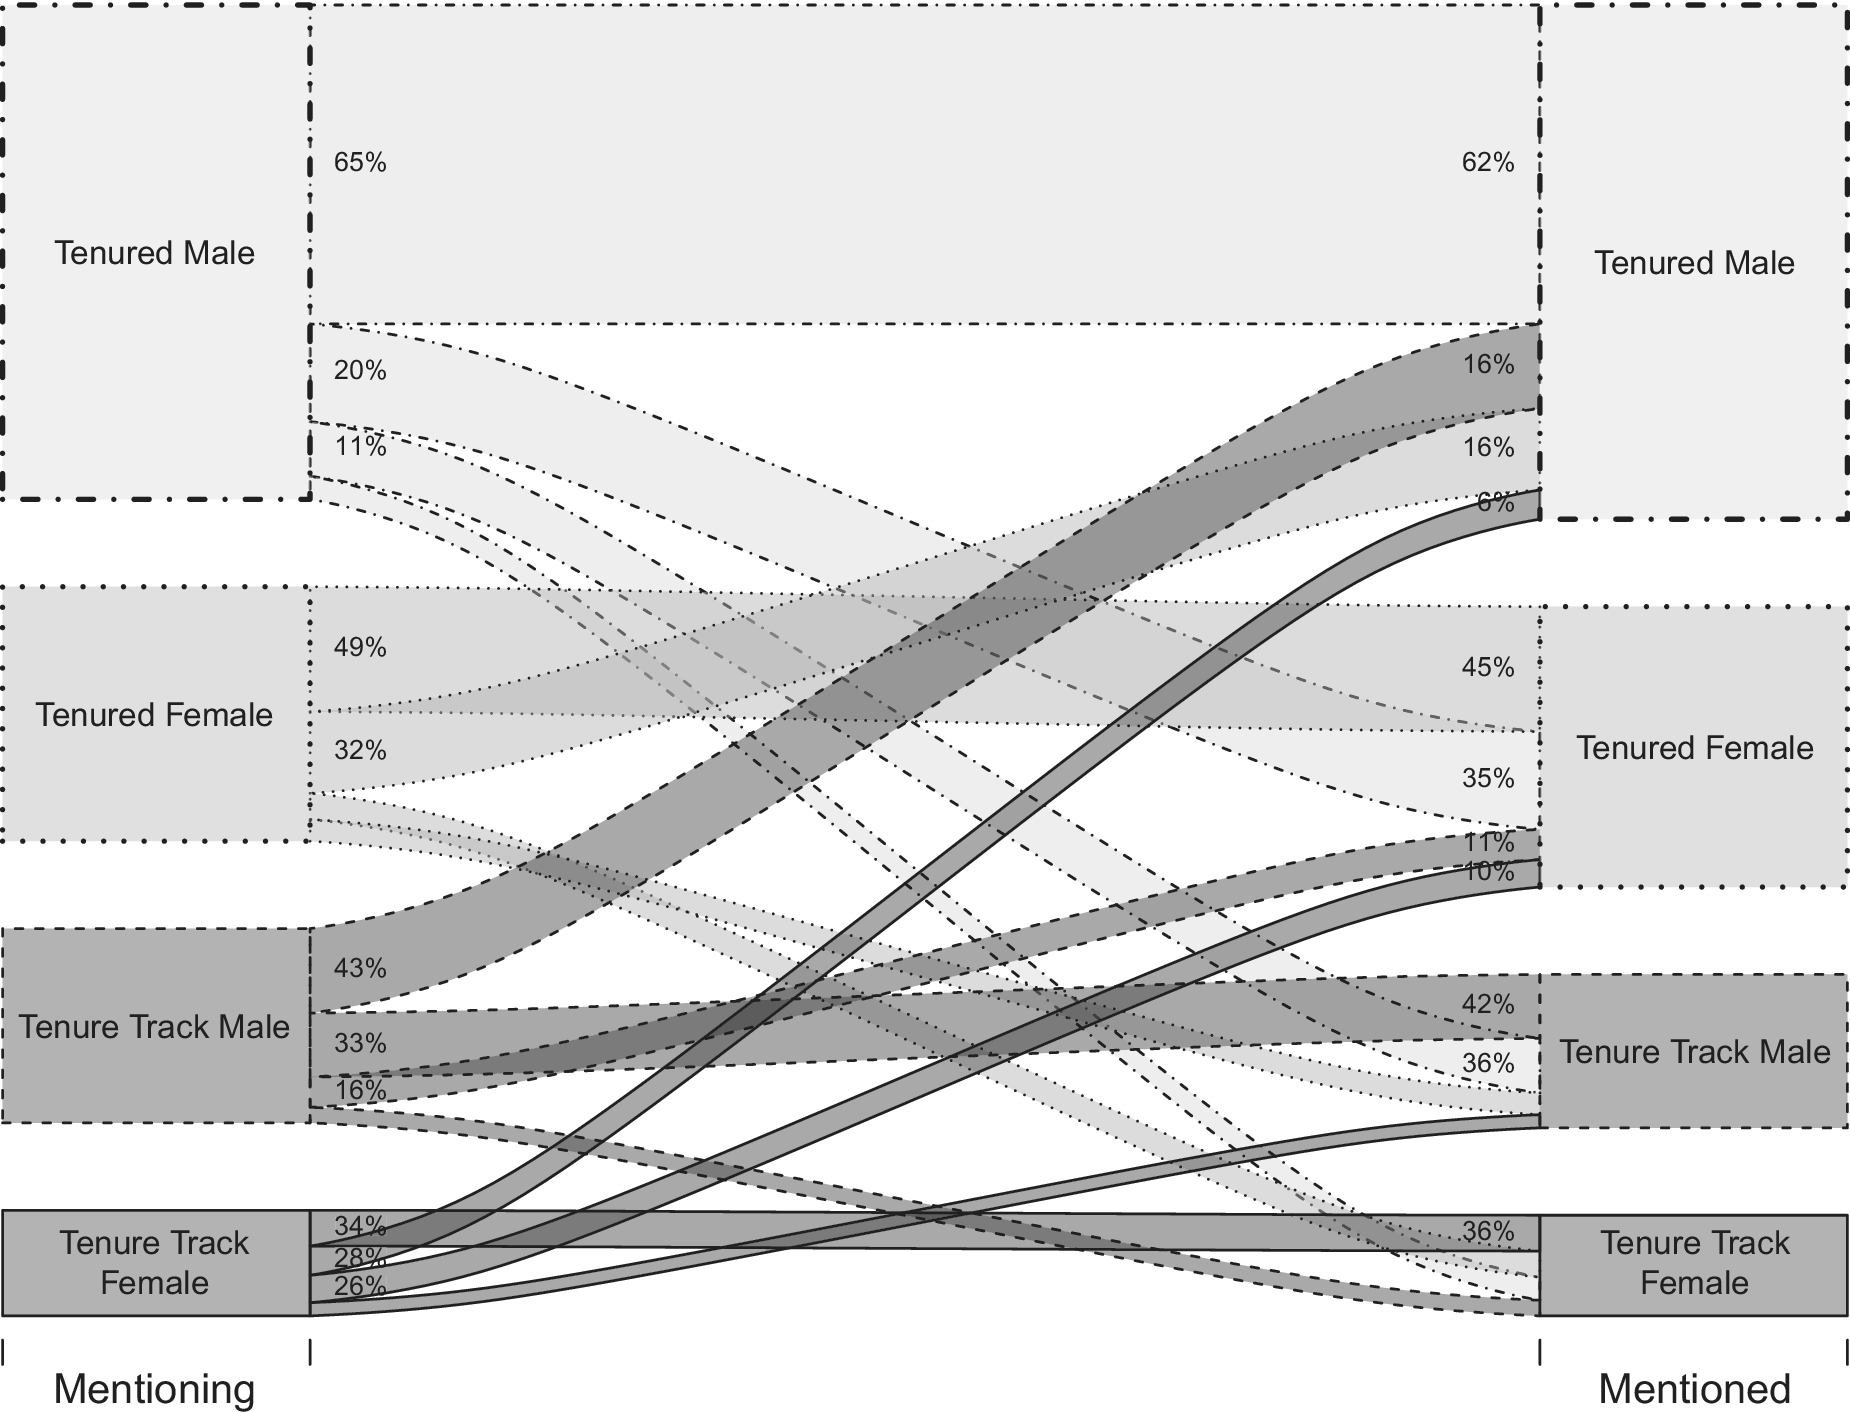
We combine the dimensions of gender and position to examine the flow of mentions in figure 7. This diagram visualizes who does the mentioning on the left and who is mentioned on the right.Footnote 12 For instance, the top bar indicates that 65% of those mentioned by tenured men are themselves tenured men, although this group constitutes only 62% of all mentions tenured men receive.
Flow of mentions by position and gender
Note: Mentions by position and gender. The left column describes the mentioning behavior by different groups, with the flows charting who they mention.

Once again, we see strong evidence of homophily, with three out of the four groups being most likely to mention others in their group. Tenured males are most likely to mention other tenured males (65% of mentions), tenured females are most likely to mention tenured females (49% of mentions), and tenure-track females are most likely to mention tenure-track females (34% of mentions). The one exception to this pattern is among tenure track men who primarily mention tenured male scholars (43%). Tenure-track political scientists differ by gender in the extent to which they “mention across” or “mention up.” Male tenure-track political scientists are most likely to mention tenured male political scientists. Female tenure-track political scientists, by contrast, are most likely to mention other tenure-track female political scientists.
Overall, figures 4, 5, 6, and 7 paint a picture of #polisci Twitter as a forum in which researchers with shared interests interact heavily with one another, and researchers predominately interact with others similar to themselves in terms of gender, ideology, and, by and large, position. The most central positions in networks of Twitter activity are not consistently occupied by individuals of a certain gender or ideology, though tenure-track scholars do more of the following, exposing themselves to the more connected scholars.
Behavior: Who Is Driving Homophily on #polisci Twitter?
The preceding descriptive results suggest that there is a fair amount of homophily among political scientists on Twitter, with men and tenured scholars both being the most active in terms of mentions and receiving the most mentions as a result. But which dimensions of an “ego” (one who mentions) and an “alter” (one who is mentioned) are most prognostic of homophily? To explore this question, we build a dyadic dataset and predict the probability of a user mentioning another user as a function of their gender, ideology, and position, along with school characteristics.
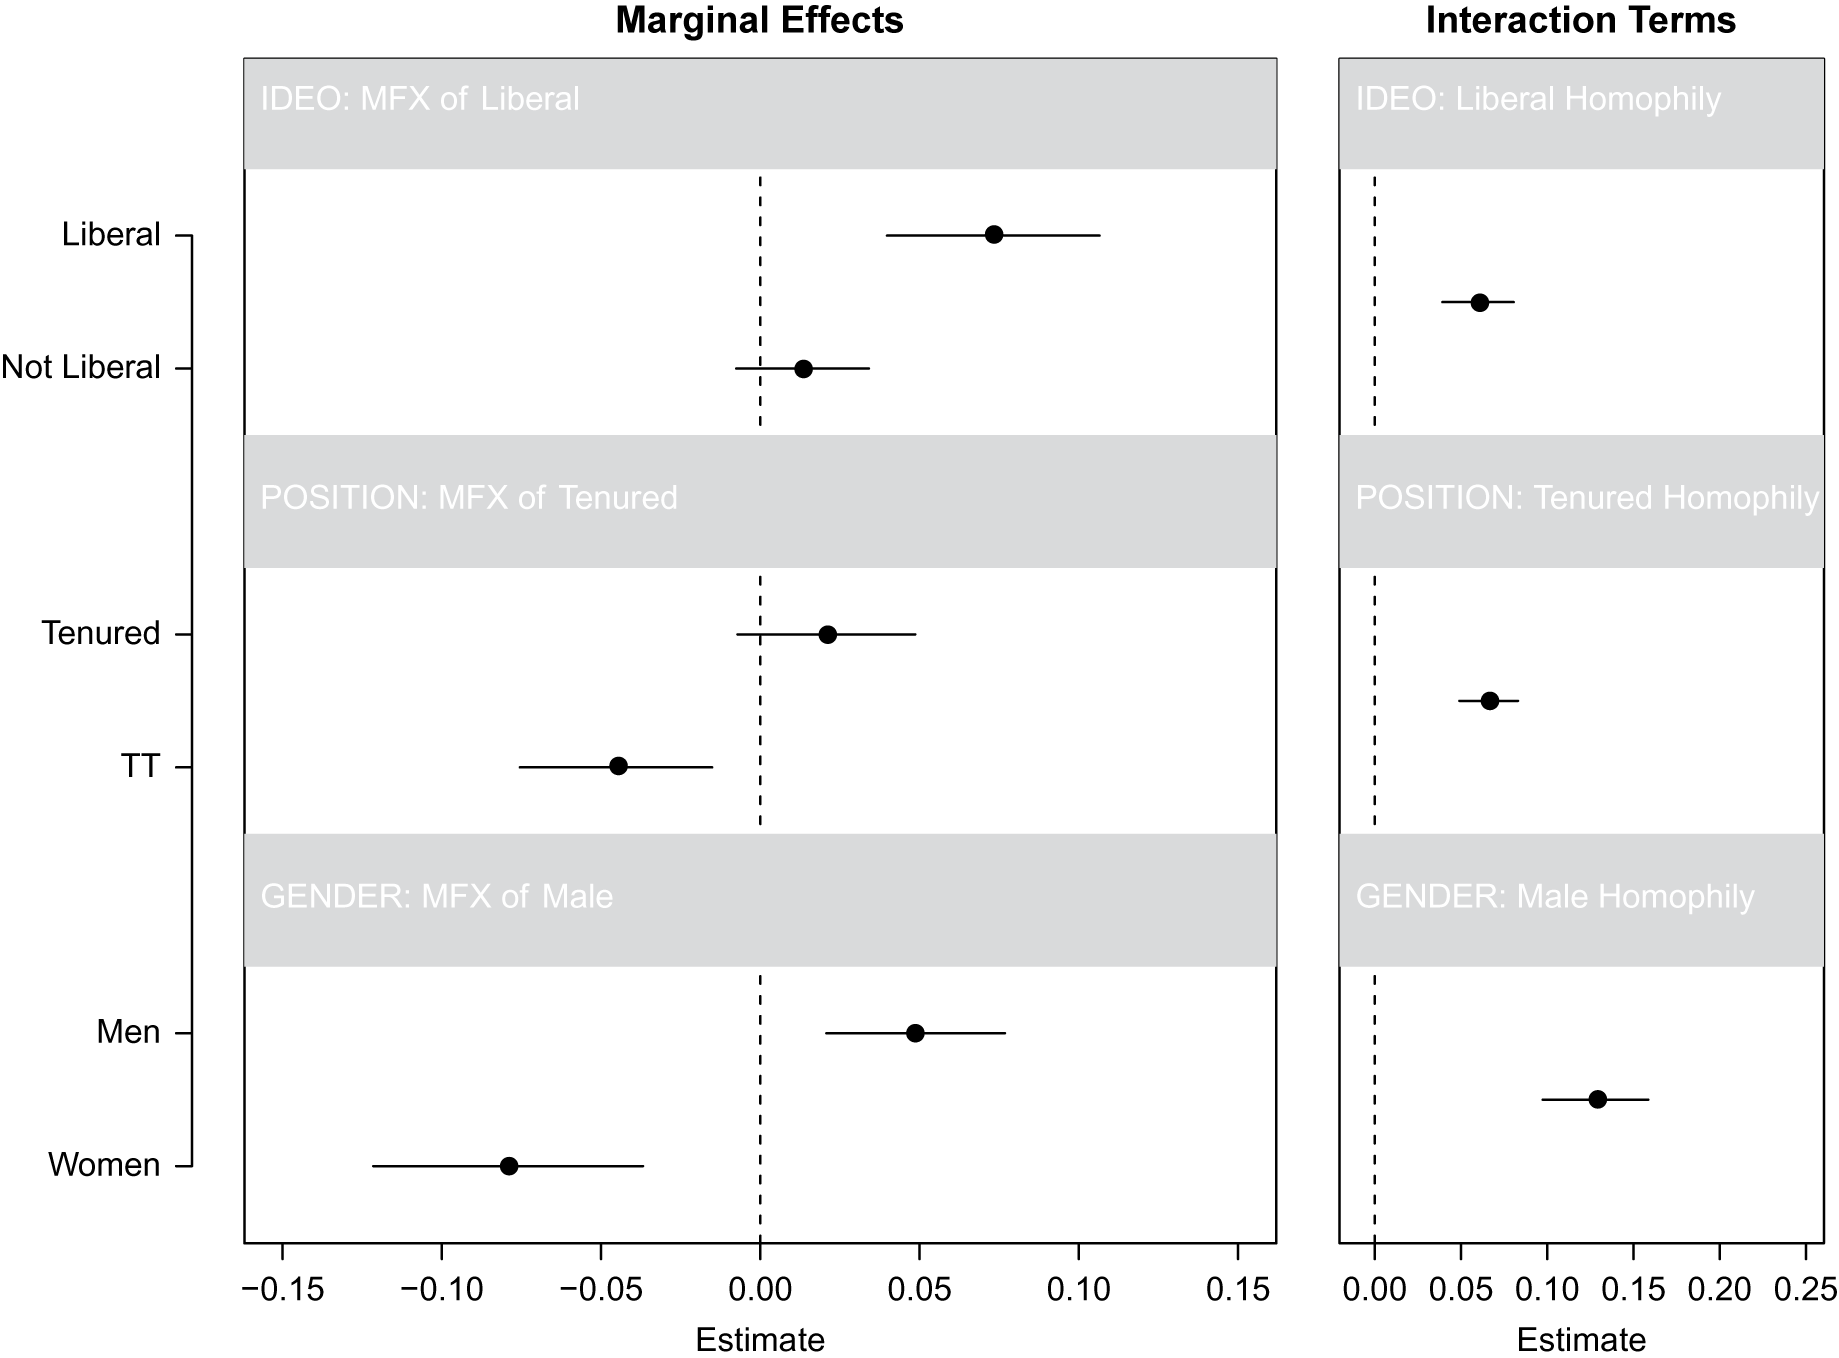
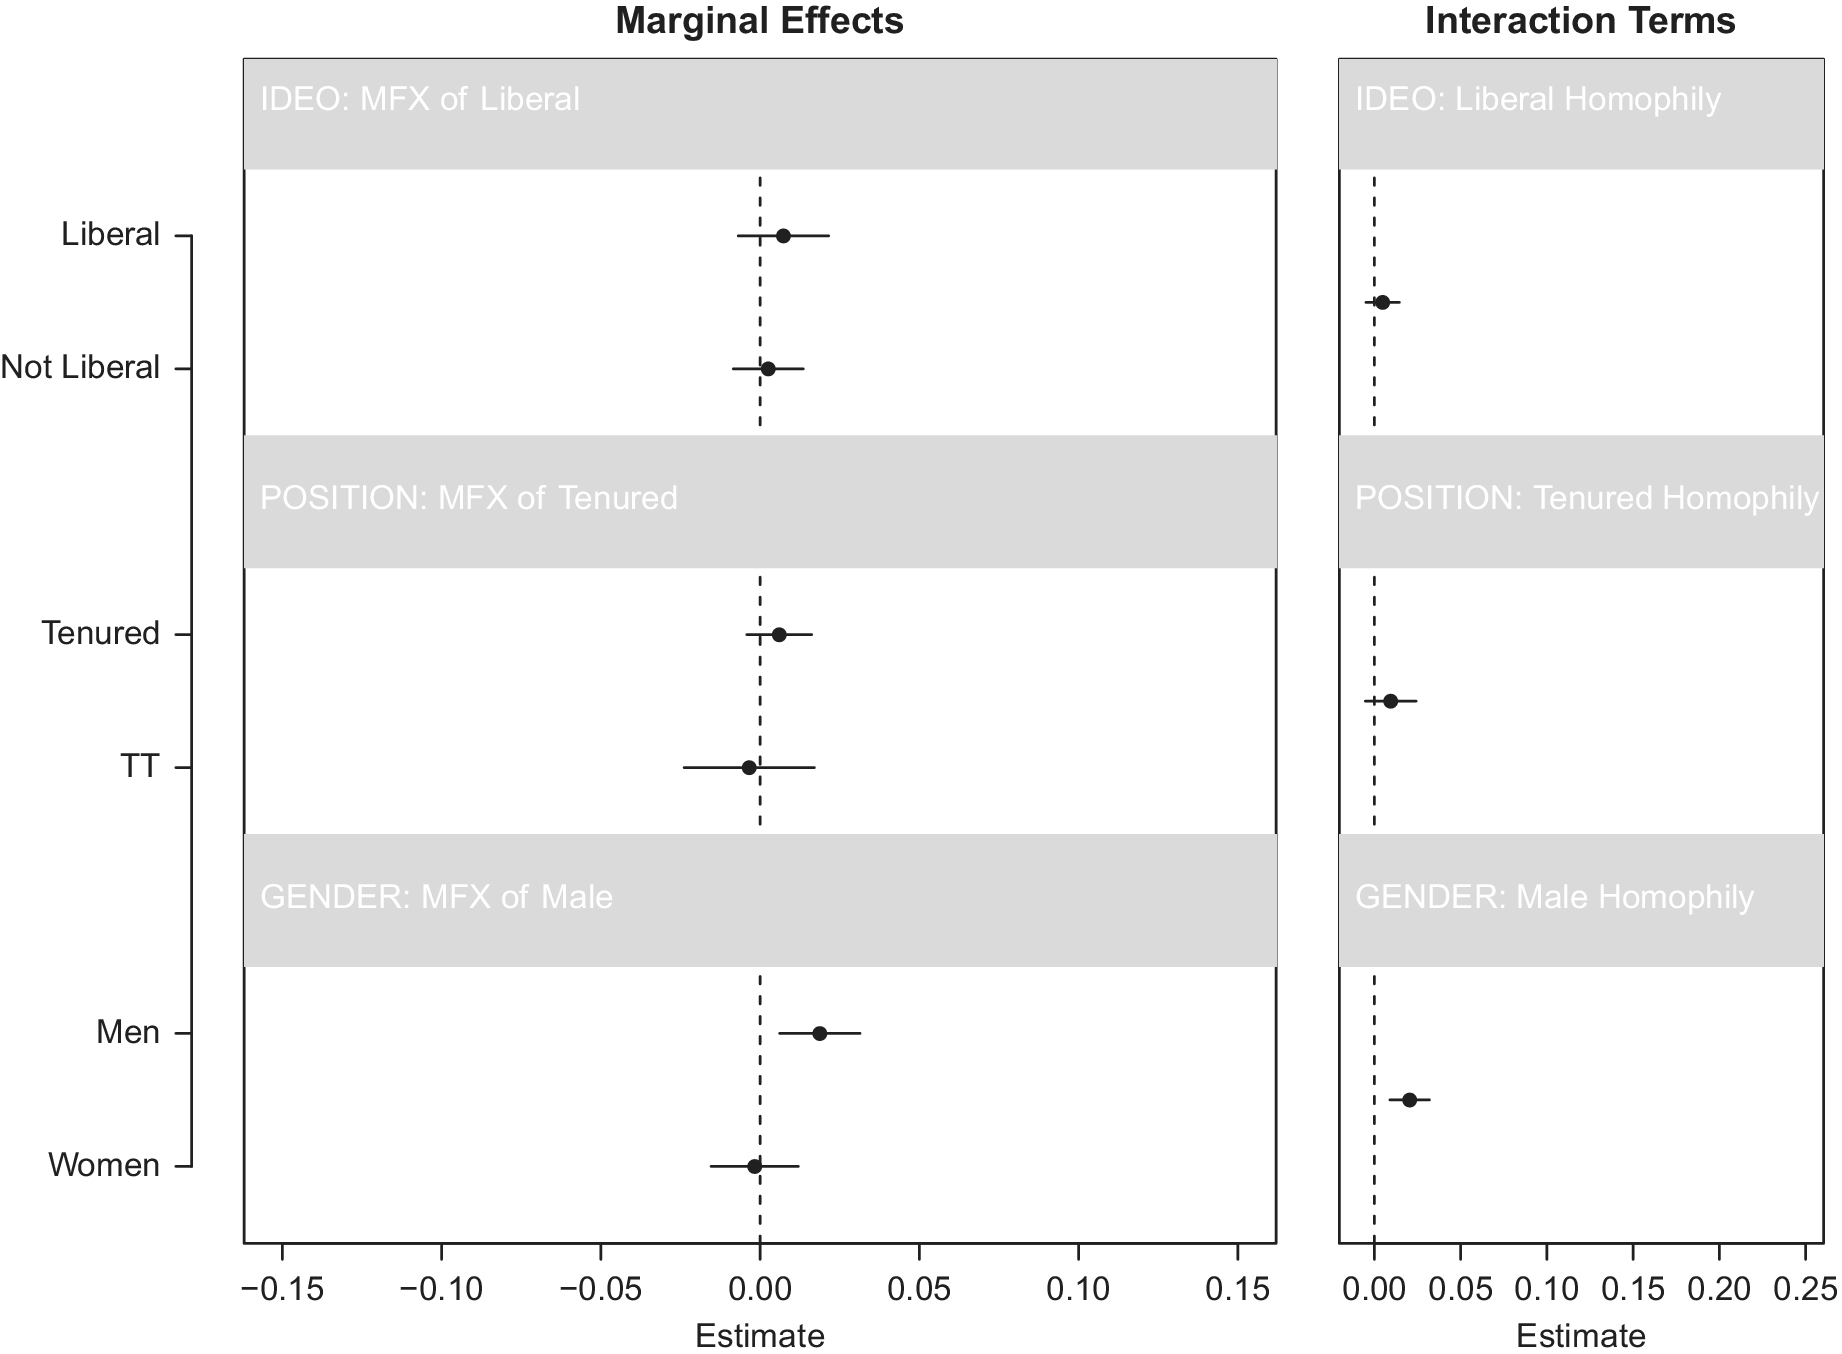
These results are summarized in figure 8. This figure plots the marginal effect of a user being liberal (top row), tenured (middle row), and male (bottom row) on the probability that that user mentions someone who shares that characteristic (top bar in each row) and on the probability that that user mentions someone with a different characteristic (bottom bar in each row). The right panel shows the interaction coefficient, which captures the effect of homophily on a mention.
Heterogeneous effects by ideology, position, and gender
Note: Interaction marginal effects (left panel) and interaction terms (right panel) estimated using dyadic data. Bars indicate two dyad-robust standard errors calculated via multiway decomposition (Aronow, Samii, and Assenova Reference Aronow, Samii and Assenova2015); further technical details in the online appendix.
To take liberals as an example, the top bar suggests that liberal scholars are significantly more likely than non-liberal scholars to mention other liberal scholars. But the bottom bar suggests they are no different from non-liberals when it comes to mentioning other non-liberal scholars. The right panel shows that the net effect is that mentions are more likely within ideology homophilous pairs.
We use the terms “in-group homophily” and “out-group bias” as a shorthand to capture these subtly different dynamics. Here, we can say that liberals exhibit significant evidence of in-group homophily, but no evidence out-group bias. On the other hand, we see that tenured scholars exhibit no evidence of in-group homophily, but significant evidence of out-group bias. The mechanism of tenured scholars refraining from mentioning tenure-track scholars' tweets is more strongly related to the pattern of mentions in the data than the mechanism of tenured scholars going out of their way to mention other tenured scholars. With respect to gender, both dynamics appear to be at play. Male scholars mention male scholars more, and mention female scholars less, in comparison to female scholars, revealing both in-group homophily and out-group bias. As illustrated, the strongest evidence of homophily is along the lines of gender.Footnote 13
That scholars mention other scholars most like themselves, especially in terms of gender, is important to know, but does not in and of itself tell us anything about why. In particular, are scholars actively picking tweets by scholars like themselves to interact with while ignoring others they see, or do they reflect the tweets that a scholar sees in the first place? In other words, do these tendencies of in-group homophily and in-group bias reflect underlying in-group biases in a scholar's antecedent choice of who to follow?
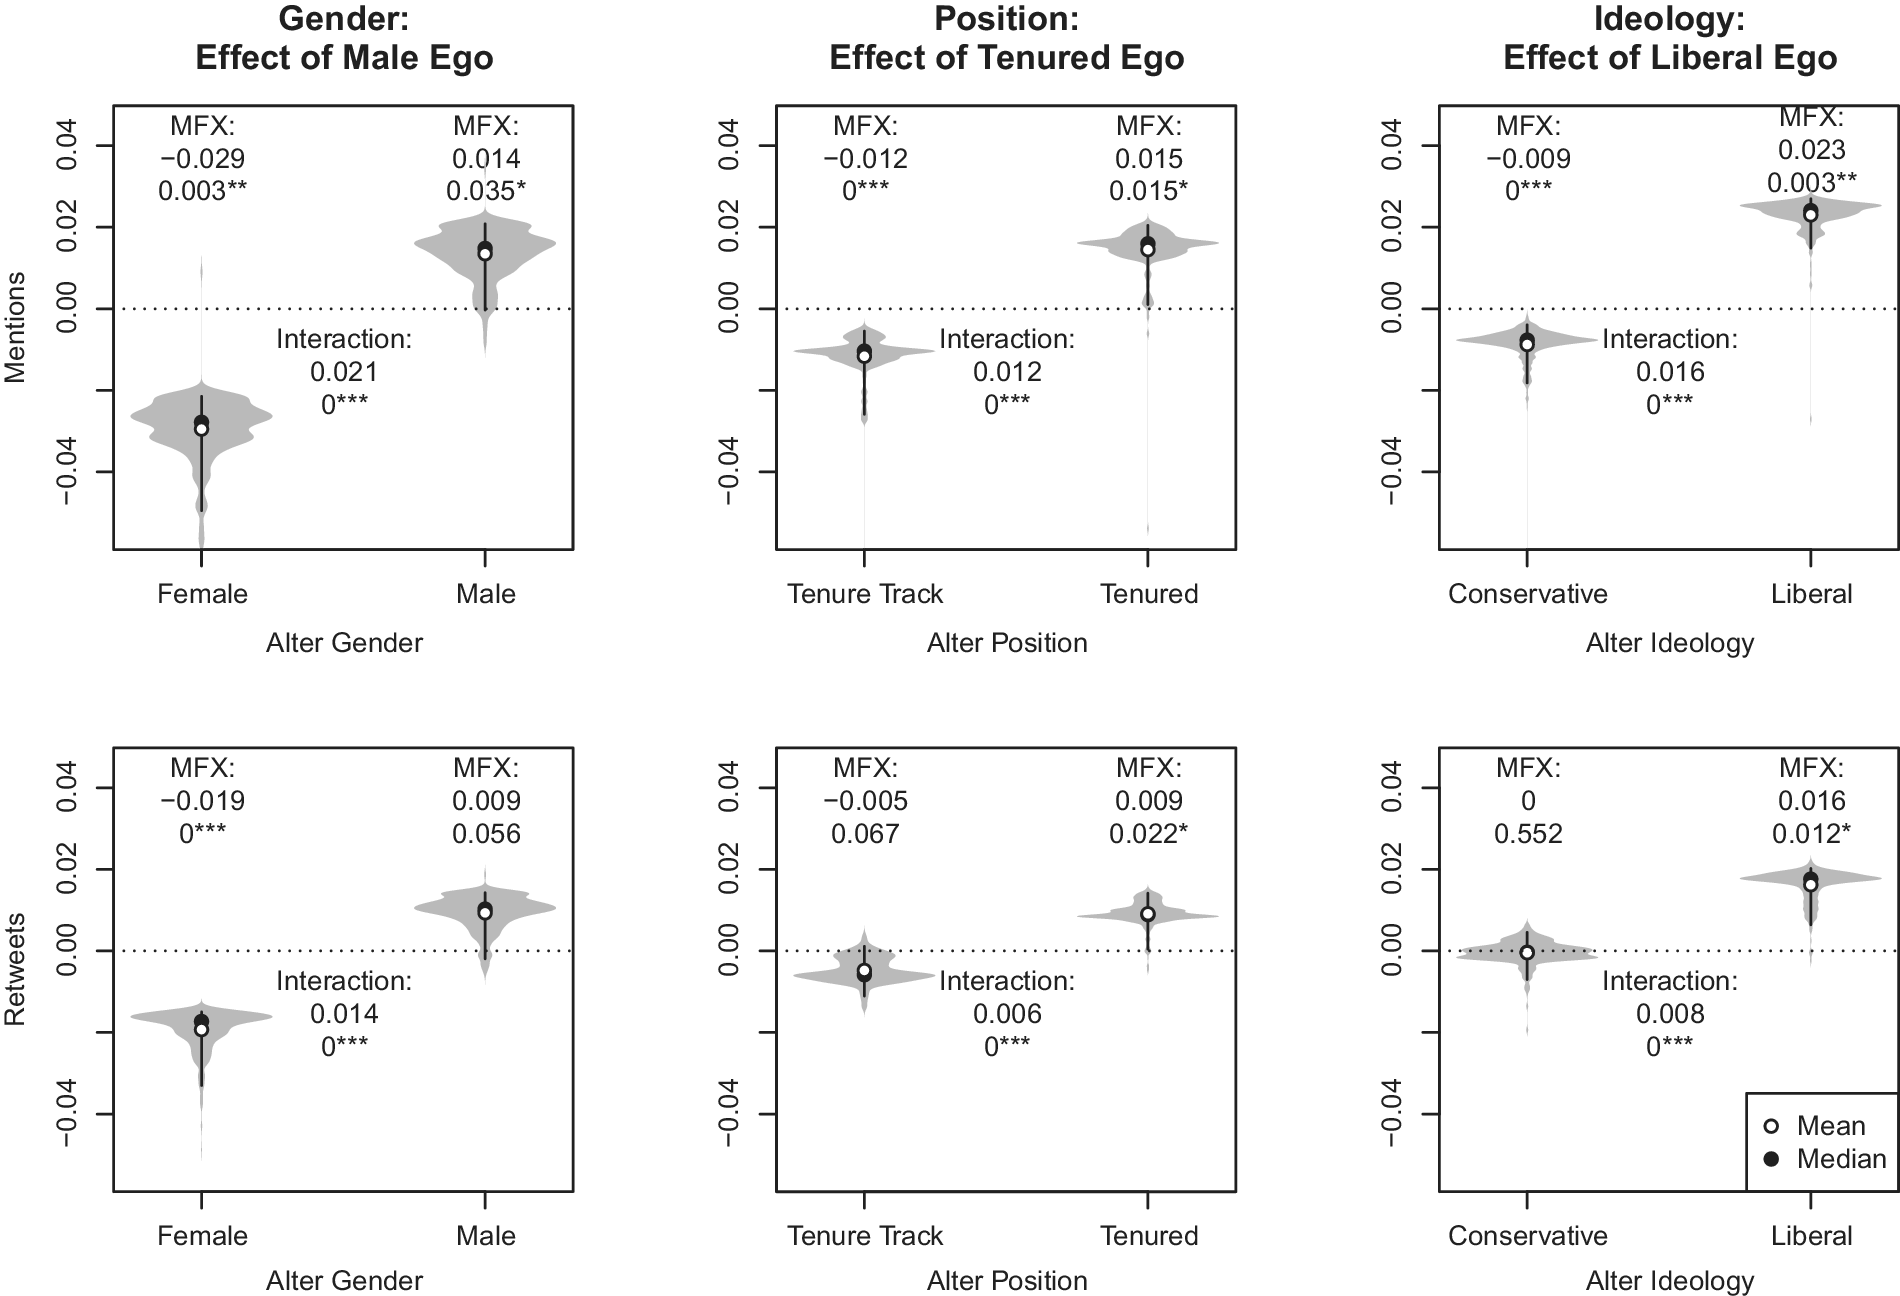
To address this question, we re-ran our analyses on two different subsets of our data. The first includes only a subset of the data that contains scholars with similar friend profiles. In this setting the egos being compared are alike in that they follow similar alters. Figure 9 plots the confidence distribution (Shen, Liu, and Xie Reference Shen, Liu and Xie2018) of these parameters, and shows that even when we are comparing individuals who follow similar scholars, scholars still retweet and mention other scholars who are like themselves, with the strongest correlations again obtaining for gender. Accounting for their exposure to tweets, male scholars are no more or less likely to mention or retweet other men compared to female scholars, but they are significantly less likely to mention or retweet women.
Marginal effects controlling for followers
Note: Dyadic analyses controlling for followers. Bootstrapped marginal effects are displayed as gray densities with average coefficient and p-value indicated in the text. Mean and median bootstrapped estimates are indicated by white and black circles, respectively. Bars represent the 95% confidence interval between 2.5% and 97.5%. Mean interaction coefficient and p-value are also indicated in the text in center of each plot. * p $<$ 0.05, ** p $<$ 0.01, *** p $<$ 0.001.

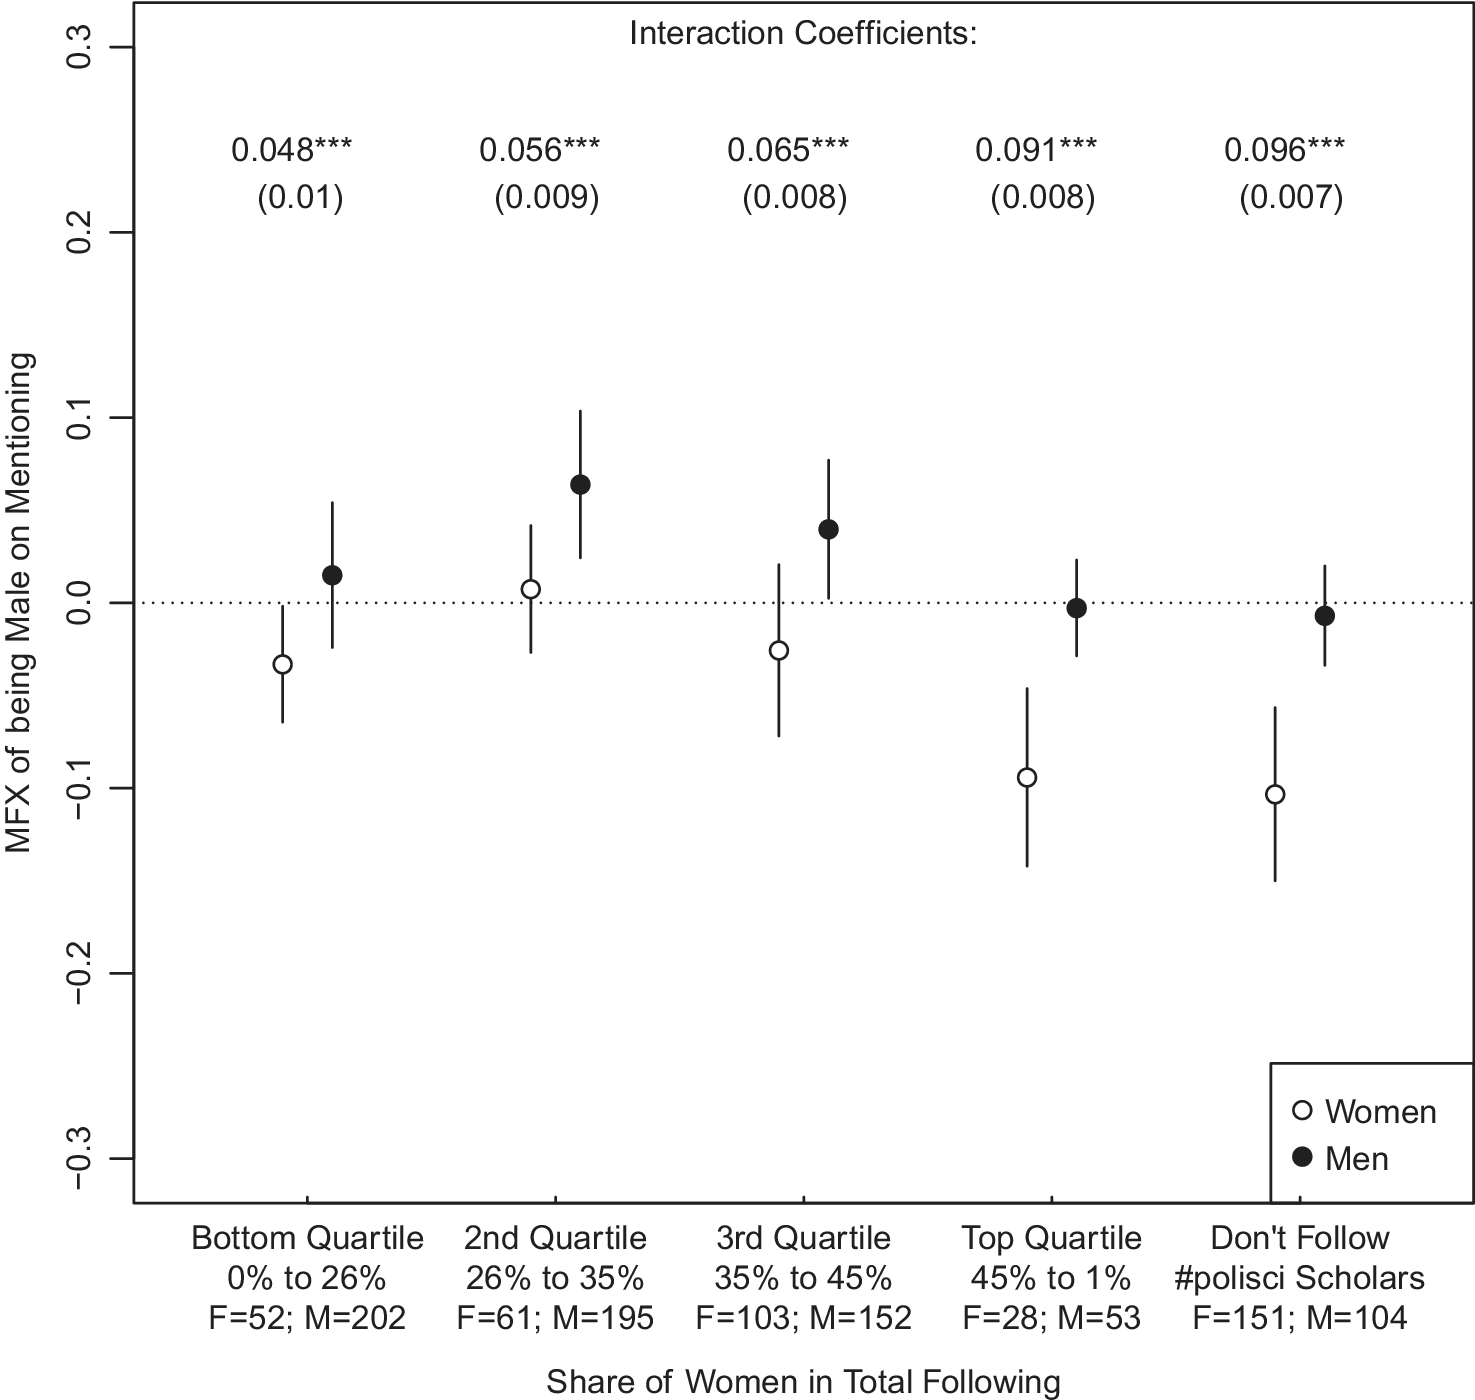
The second subset contains scholars who follow approximately the same proportion of male and female scholars. Now egos being compared are alike in that they have equal exposure to the Twitter activity of men and women. Figure 10 presents the results, separated by the prevalence of female accounts among those followed. From left to right, the first four columns along the x-axis show male scholars with an increasing proportion of female alters. The circles show the marginal effect of being male on the probability of mentioning an alter, with solid circles representing female alters and hollow circles representing male alters. Male scholars in the second quartile of the distribution (those for whom women are between 26% and 35% of their alters) are significantly more likely to mention other men, but don't differ from female scholars in the same quartile when it comes to mentioning women. Conversely, male scholars in the top quartile (those for whom women comprise more than 45% of accounts they follow) are significantly less likely to mention women, but don't differ from female scholars in the top quartile when it comes to mentioning other men. The magnitude of these coefficients is much smaller though, capturing only about 20% of the overall homophily.
Interaction marginal effects of being male
Note: Interaction marginal effects of being male are estimated using dyadic data, subsetting to scholars who follow similar shares of women (x-axis). Bars indicate two dyad-robust standard errors calculated via multiway decomposition (Aronow, Samii, and Assenova Reference Aronow, Samii and Assenova2015).

Taken together, these results suggest two important takeaways. First, homophily in engaging with other scholars on Twitter is the starkest along the lines of gender. Scholars predominantly interact with scholars who share their gender.
Second, the magnitude of gender-based homophily reduces by half if we simply control for followers and falls by 80% when we look across the support of gender-based following behavior. Gendered interactions can be largely (though not entirely) explained by gendered structure—that is, by scholars setting themselves up to see the tweets of scholars like themselves by following scholars like themselves. This suggests that encouraging male scholars to follow more female scholars on Twitter may be a more efficient method of reducing this disparity.
Research Dissemination
What are the implications of this homophily for the spread of research? In this section, we attempt to characterize how research specifically—that is, tweets containing links to research—is disseminated and shared across the network. In the following, we use the terms “impact” and “reach” interchangeably to refer to the number of engagements a given tweet enjoys, either among the scholars who comprise #polisci Twitter, or on the platform more generally.
We begin by identifying all tweets in our dataset that contain links to research by parsing tweets that link to a website in search of URLs that contain the keywords “pdf”, “doi”, “sagepub”, “jstor”, “onlinelibrary”, or “journal(s)*.” We then determine who engaged with these tweets via four actions: re-tweeting, replying, quoting, or favoriting. These measures allow us to identify 1) which research is widely shared and how it is disseminated, and 2) which political scientists are most helpful in reaching a broad cross-section of political scientists on Twitter.
We repeat the network analyses summarized earlier, this time using the network of shared research URLs. A directed link in this network is present from a scholar who posted a tweet with a research URL to another scholar who retweeted, replied to, quoted, or favored it.
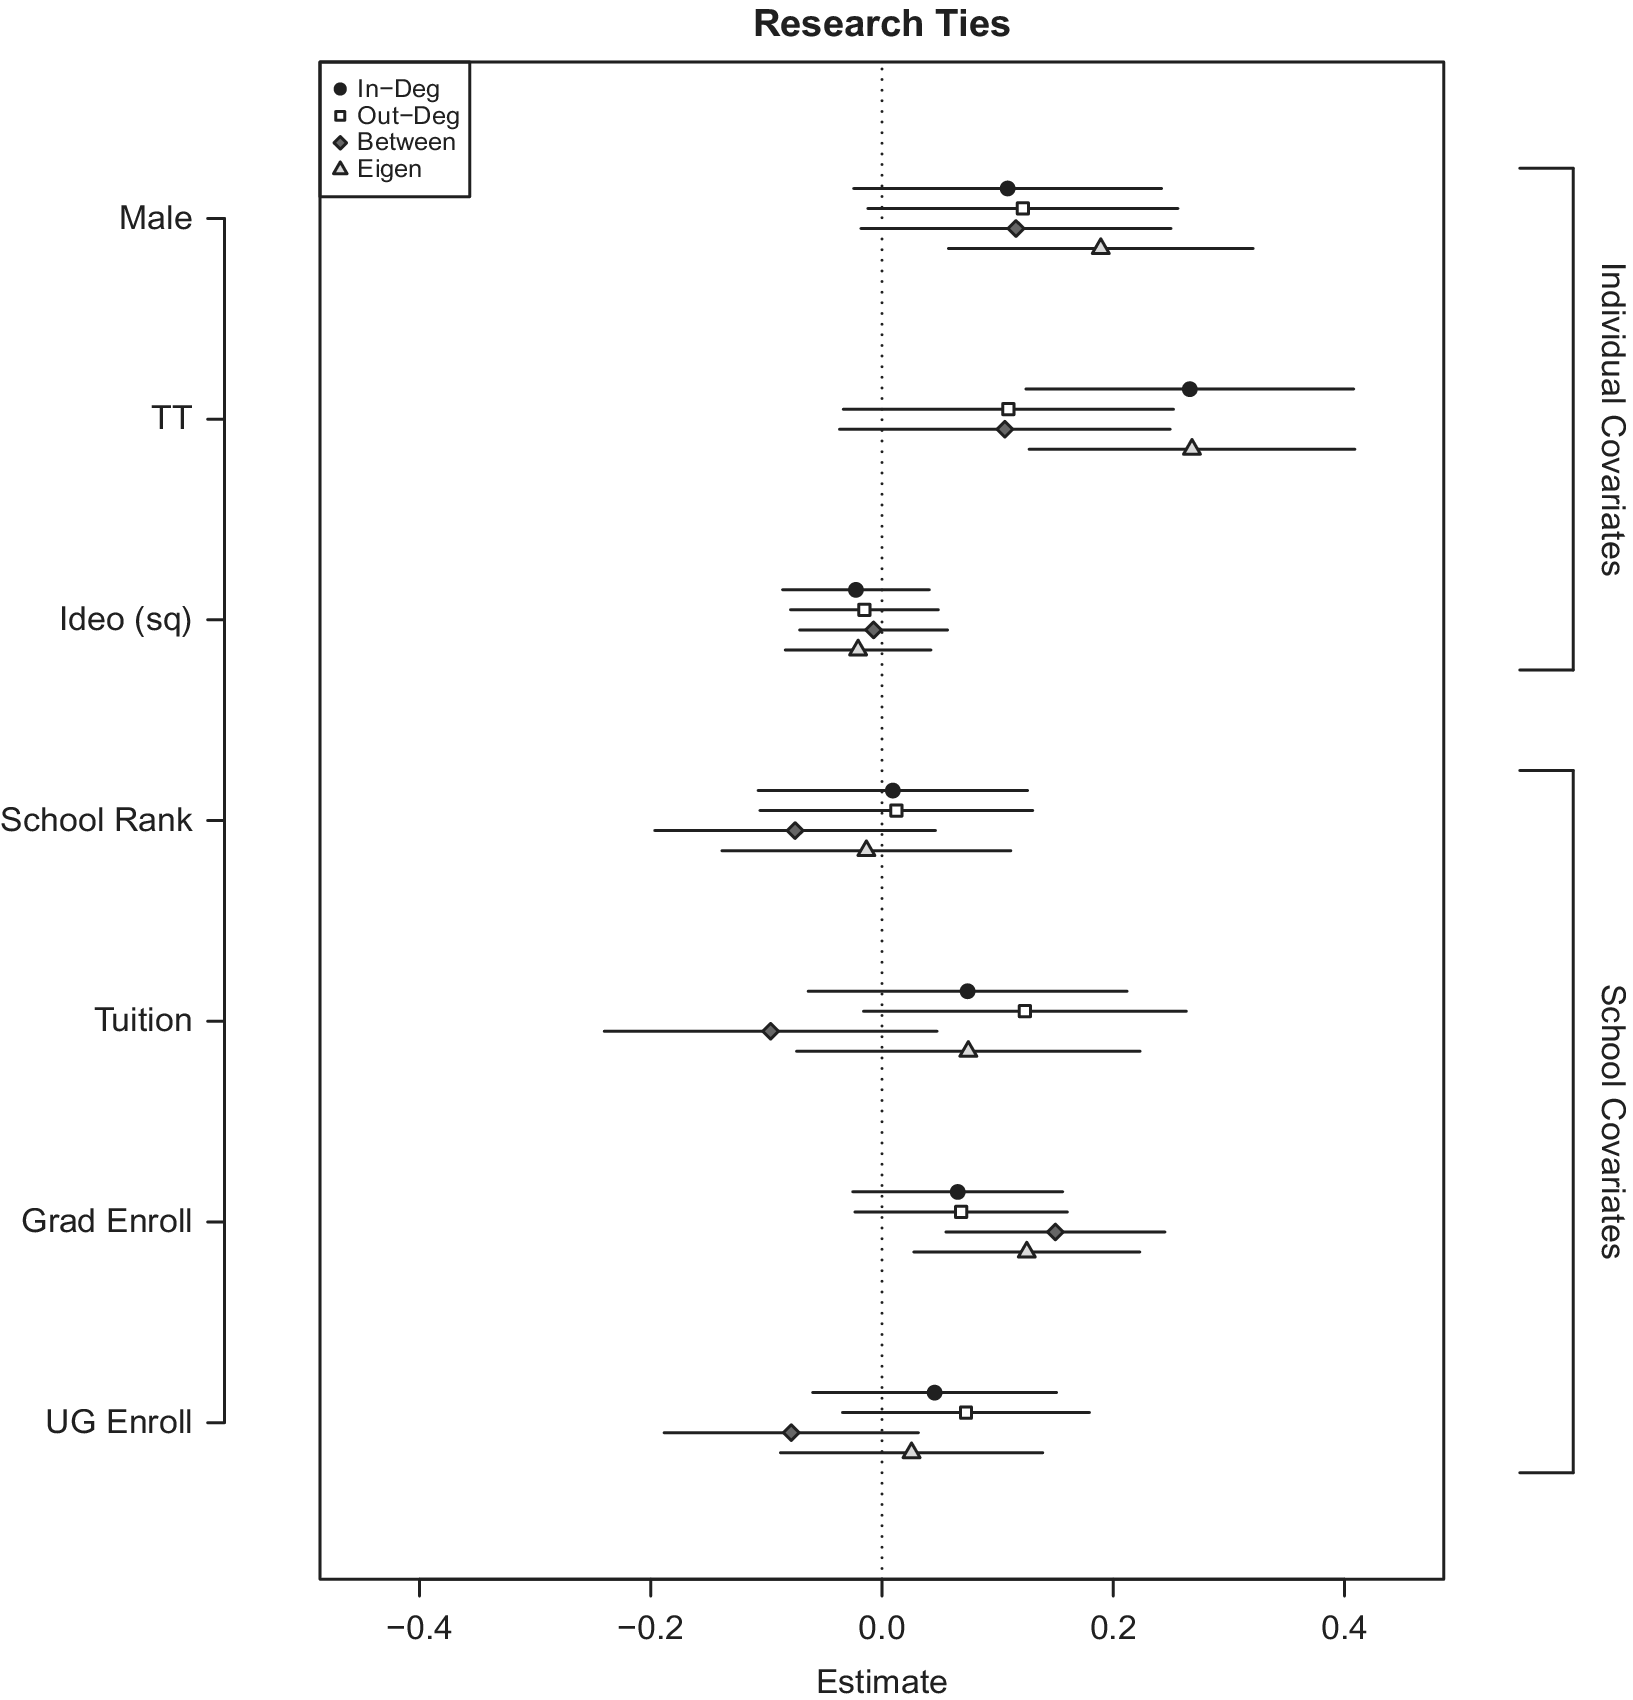
Figure 11 reproduces the centrality analyses using these links (compare to the middle panel of figure 5), confirming that both men and tenure-track scholars are much more central on #polisci Twitter when it comes to discussing research. We also note that there is some prognostic power for school characteristics, specifically the significant and positive coefficients on graduate enrollment for a scholar's betweenness and eigenvector centrality in the research network. Taken together, these suggest that male and tenure-track scholars are engaging with research in a way that gets it to the most central scholars (high eigenvector centrality, what they interact with gets interacted with by relatively connected scholars), even if they are not interacting with the highest volume of research (not significantly high out-degree), and being at an institution with high graduate enrollment appears to help with this.
Descriptive correlations between research network centrality and scholar attributes
Note: Centrality measures for links are defined as research shares. Coefficients (points) and two standard errors (bars) are based on multilevel regression of centrality measure on individual-level and school-level covariates (y-axis). Centrality measures are given in the legend.

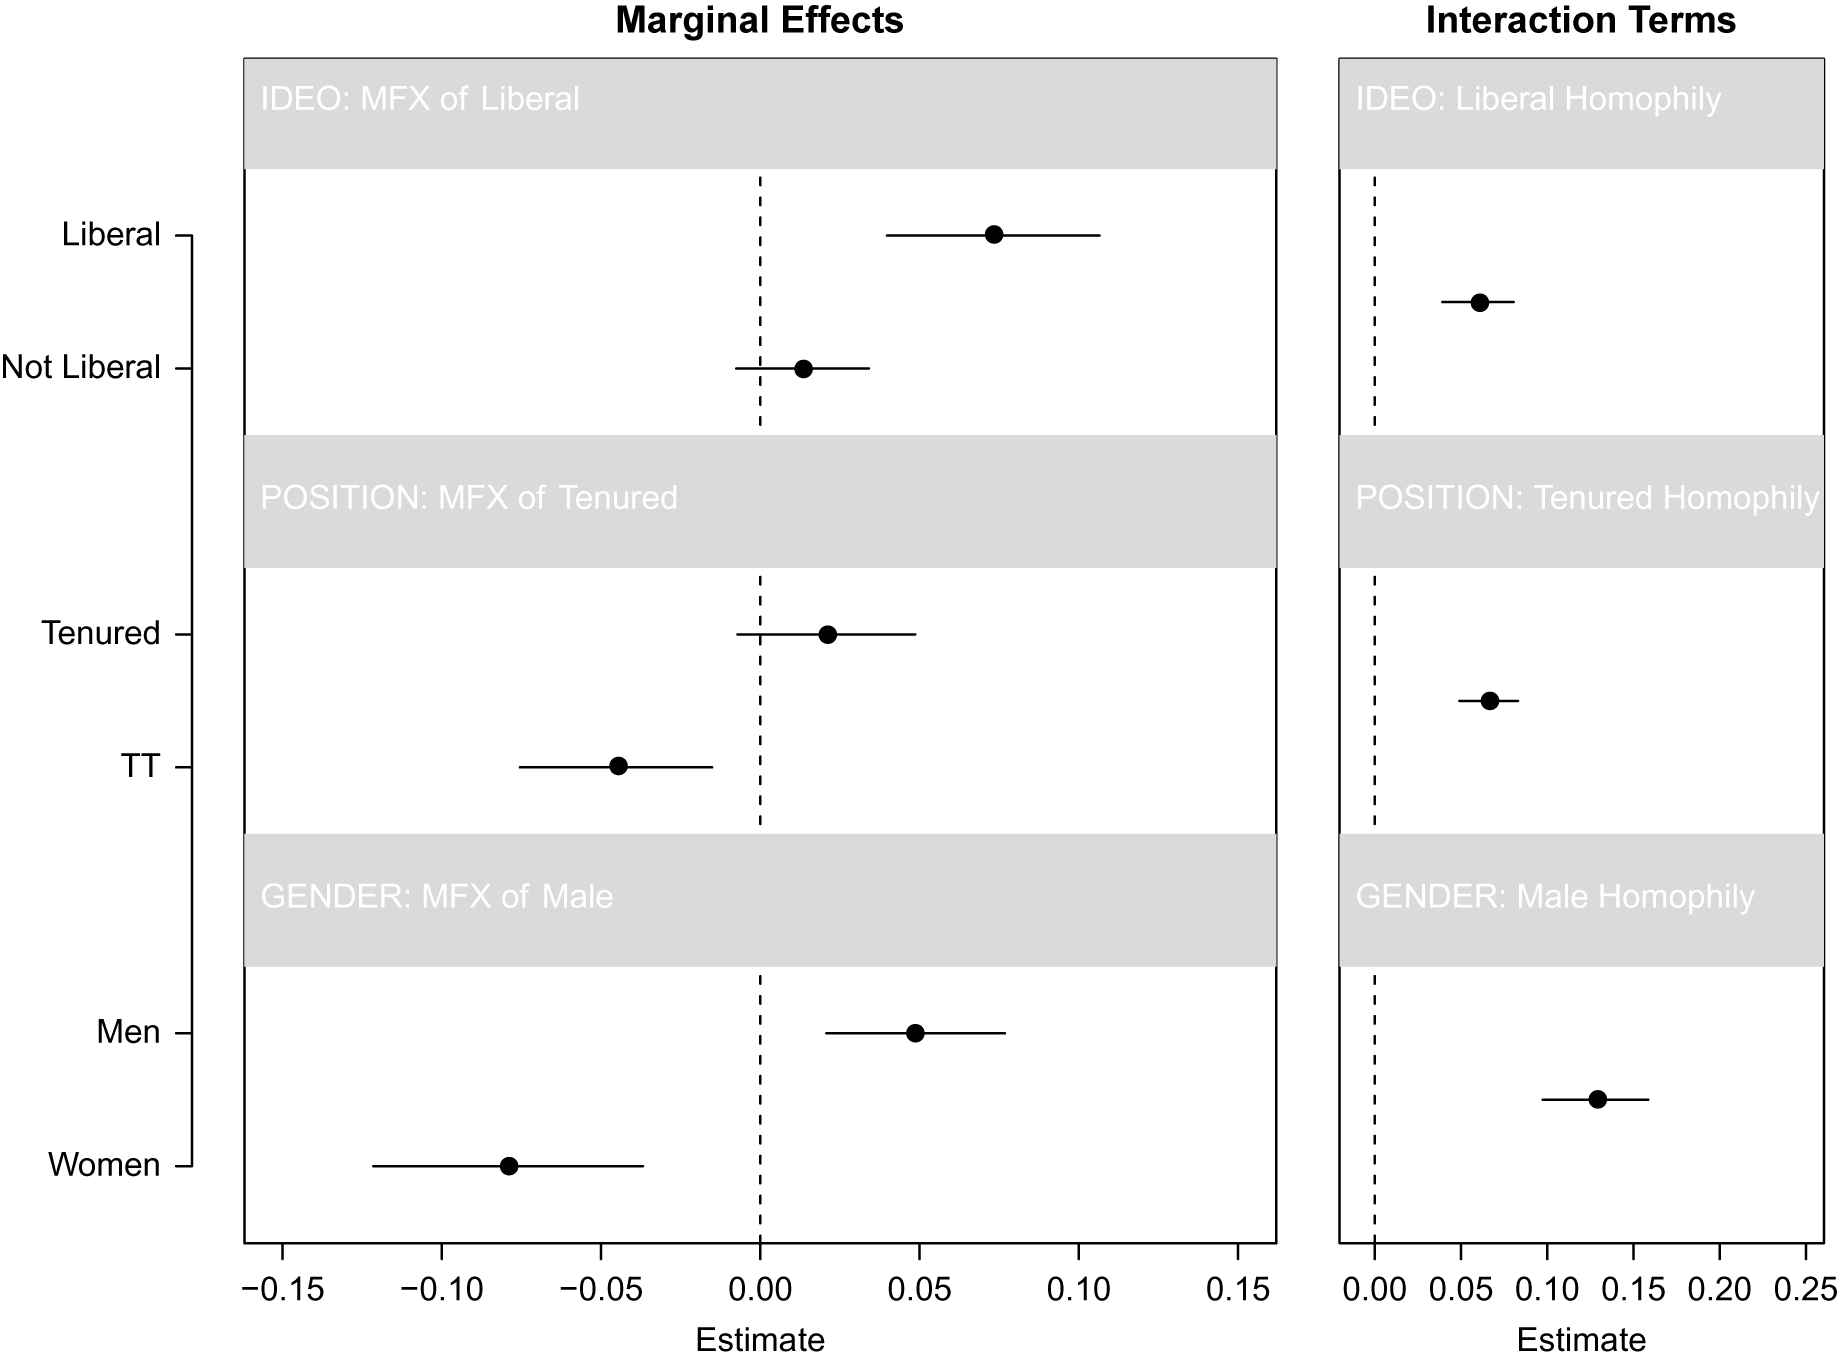
Figure 12 shows the results of re-running the dyadic analyses using research shares as links, finding that when it comes to sharing research on #polisci Twitter, scholars are generally unbiased. The one exception appears to be among male political scientists who are disproportionately more likely to engage with research tweeted by other men, when compared to female scholars. But while these differences are statistically significant, the standardized coefficient is an order of magnitude smaller than those associated with mentions. Put more concretely, gendered biases persist in research engagement, but they are smaller than the biases associated with mentions and retweets.
Heterogeneous effects of research shares by ideology, position, and gender
Note: Interaction marginal effects (left panel) and interaction terms (right panel) are estimated using dyadic data. Bars indicate two dyad-robust standard errors calculated via multiway decomposition (Aronow, Samii, and Assenova Reference Aronow, Samii and Assenova2015).

Dissemination, Impact, and Influence
While informative of who engages with whose research on #polisci Twitter, the preceding findings still treat any type of engagement with a tweet linking to research as a binary indicator. But our data allow us to dig deeper into whose research is shared, how widely it is seen, and whether scholars in our network with certain attributes are particularly influential in boosting the dissemination of research.
To operationalize these ideas, we construct four novel measures of influence in research networks; details of these measures can be found in the online appendix. The first two pertain to the spread of a scholar's research and are measured in terms of the number of times a given research URL is shared. The latter two measures identify which users are particularly good at broadcasting research.
The first measure is simply the ratio of tweets containing original research to the total tweets by a user. This measure captures how frequently each person shares original research. (We are unable to distinguish between an individual's personal research and others' research).
Our second measure is the average number of re-tweets a user's research posts receive. We also supplement this measure with the average number of “likes”. These measures are not constrained to be re-tweets by other #polisci users.
Our third measure focuses on the average number of engagements a user's tweet received from the political science Twitterverse and constitutes a lower bound given the API limitations we describe in the Appendix. Specifically, consider a tweet by @ComparativistsRule which shares a working paper and had a total of twenty-eight re-tweets and forty-nine likes as of April 2019. This was re-tweeted once by @DrStateNLocal, although we are unable to determine what percentage of the twenty-eight re-tweets this single re-tweet was responsible for. On the low end, it may have contributed only a single re-tweet to this number, but on the high end, it is possible that this re-tweet was responsible for a much larger proportion. While we don't know how many re-tweets @DrStateNLocal's re-tweet was responsible for, we can observe the number of times it was liked, in this example zero. In addition, @PolPsychPosse's tweet was also replied to by @ThucydidesRulez, who expressed excitement at the prospect of reading the paper. We do know that this reply received zero re-tweets of its own and two likes, which we count toward the total number of engagements associated with @PolPsychPosse's original tweet. Combining these measures, we assign a total number of engagements to this tweet of 4—one confirmed re-tweet by @DrStateNLocal, one reply by @ThucydidesRulez, and two likes of @ThucydidesRulez's reply.
The preceding measure likely undercounts the penetration of @PolPsychPosse's tweet through #polisci Twitter since 1) we don't know how many of the total twenty-eight re-tweets came from re-tweets of @DrStateNLocal's re-tweet and 2) other users may have seen the tweet but not engaged with it. Thus, our fourth measure is the sum of the total followers of each user who engaged with a tweet and captures the total possible audience exposed to the research by our #polisci Twitterverse. Again, returning to the running example, @PolPsychPosse's tweet would be assigned a value of 1,734 + 734 = 2,468 total followers based on the two political scientists who engaged with his tweet.
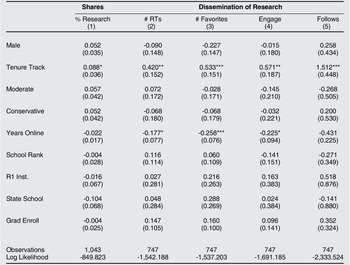
For each of these measures, we predict variation along the lines of gender, ideology, and tenure status, using a multilevel model of the same form as earlier. The main findings concerning the extent to which political scientists on Twitter share research and have these tweets disseminated are summarized in table 2.
Research dissemination
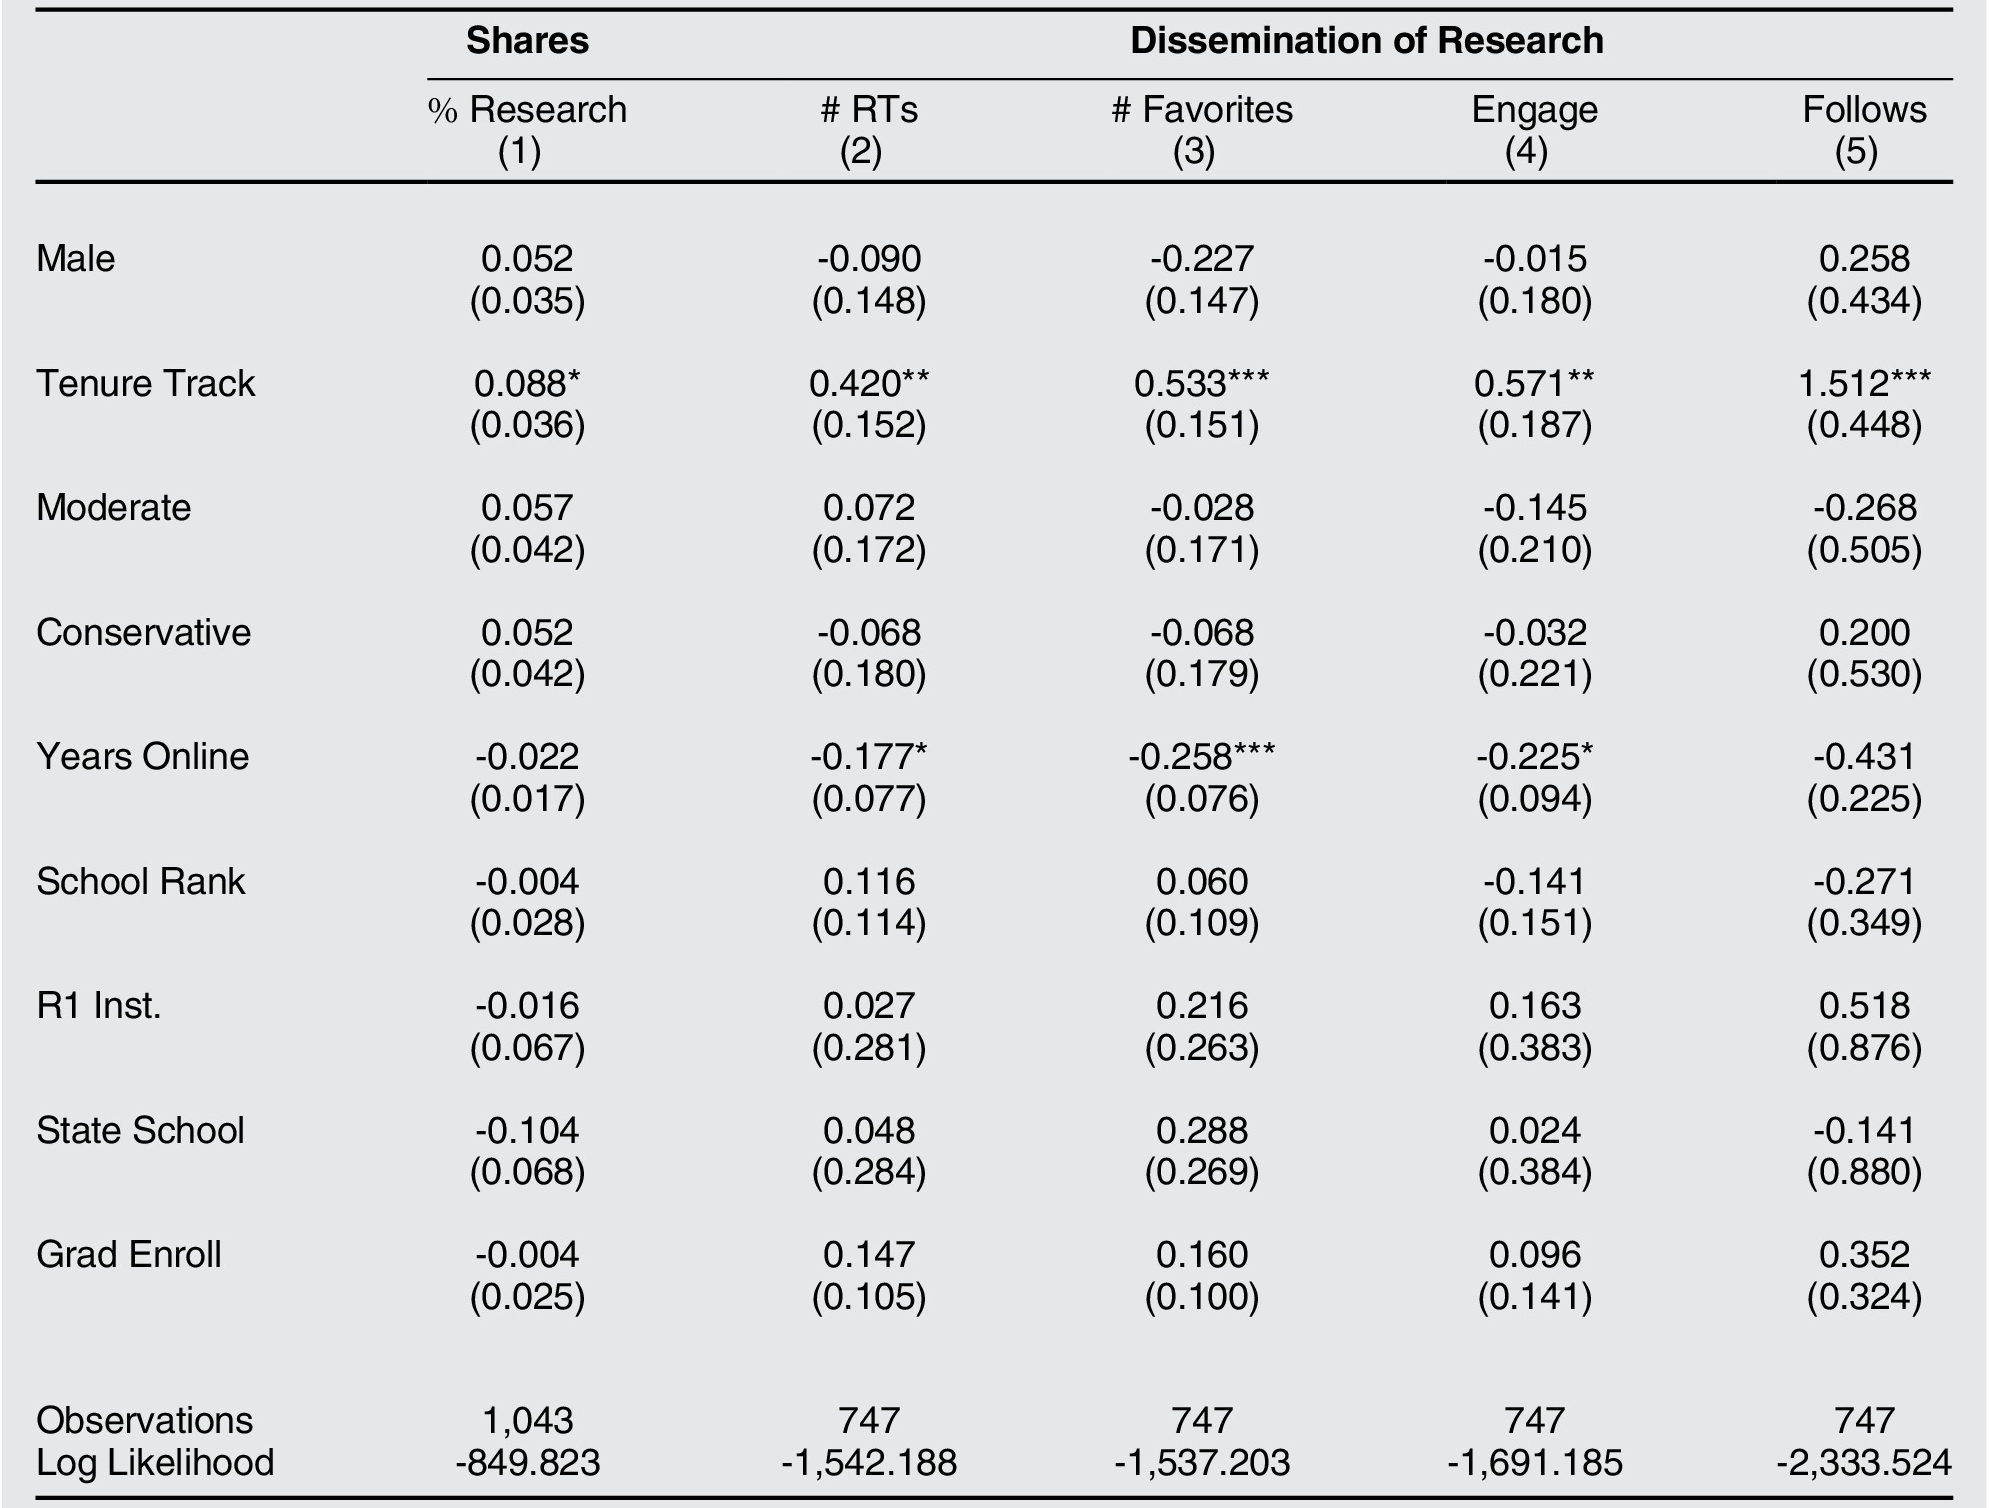
Note: Patterns of sharing research on Twitter. First column regresses the share of tweets that contain a link to research. Ensuing columns regress measures of how popular these tweets are overall (columns 2 and 3) and how much of an impact they make on political science Twitter (columns 4 and 5).
*p**p***p<0.001
The only clear pattern is that those who use Twitter for sharing research—and whose research is more widely disseminated—have been on Twitter for a shorter period of time and are more commonly tenure-track, a finding consistent with the recurrent theme of younger scholars being more active on Twitter. Writ large, we see no evidence that scholars with a particular set of attributes are especially responsible for the impact or wide reach of research on Twitter. Of course, this does not mean that there are not individuals who are more important for impact and reach. Rather, this simply shows that their importance is not highly correlated with attributes of gender, ideology, or school characteristics.
One might be reassured to see that 1) gender, ideology, and school rank are not prognostic of research impact, and 2) younger accounts belonging to tenure track scholars are more likely to have their posts containing research shared widely both among #polisci Twitter and more generally. However, we caution that these patterns capture the visibility of this research on Twitter only. An important question remains whether this exposure is correlated with professional success offline. Does wider research dissemination on Twitter improve a scholar's citations, publication changes, and career advancement? Connecting the online patterns we present here with offline outcomes is an important area for future research in order to fill out our understanding of how online social networks like Twitter ultimately shape the political science profession.Footnote 14
Conclusion
We provide a snapshot of #polisci Twitter as of early 2019. We capture what we believe is the universe of tenure-line academics working at PhD-granting institutions in the United States who have a Twitter account. We provide descriptive analyses of this online social network through a variety of lenses. Our motivating interest is to characterize the degree to which attributes of a social network—clustering, homophily, centrality—perpetuate existing inequalities in political science academia along the lines of gender, position, and ideology.
Our findings vary depending on how we define “links” in this network. Focusing on conventional measures such as mentions and re-tweets reveals significant evidence of homophily along the dimensions of gender, ideology, and position. Men are significantly more likely to re-tweet and mention other men; women do the same for other women; and similar patterns manifest among liberals, moderates, and conservatives, as well as among tenured and tenure-track scholars who use Twitter.
But when we use a status that contain links to academic research, the story changes. Here we find no systematic differences across ideology or position, suggesting that the dissemination of scholarly research is not truncated by these cleavages. However, there is evidence that men are more likely to engage with research that is shared by male scholars, controlling for other dyadic differences and implementing dyad robust standard errors. Troublingly, there is no evidence of the converse, highlighting an important blockage in the flow of academic research corresponding to a male gender preference.
In terms of engagement, we document significant evidence that female and tenure-track scholars are more likely to be on Twitter than their counterparts. In addition, tenure-track scholars are more likely to use Twitter to share research; are more likely to have these tweets engaged with by other members of the #polisci Twitter community; and are more central in the network overall, regardless of how we define lines between users and how we calculate centrality. Furthermore, female scholars' membership in the most dominant Twitter communities is commensurate to, or greater than, their share of the overall population, suggesting that Twitter is a valuable platform for raising the profile of under-represented groups in political science (Klar et al. Reference Klar, Krupnikov, Ryan, Searles and Shmargad2020). In our online appendix, we use Natural Language Processing on the content of tweets themselves, finding that women are more likely to be mentioned in toxic tweets than men, although we also note that the vast majority of discourse among political scientists is very non-toxic.
Our findings are based on data that is both incomplete and fluid. In terms of the incompleteness, there are several important nodes in the network that we do not observe. Some of these members of #polisci Twitter, such as @BrendanNyhan and @emayfarris, are central actors who we miss due to their positions at non-PhD granting institutions at the time of our data collection. Others, such as @womenalsoknow and @monkeycageblog, are important entities comprised of an assortment of scholars. Furthermore, the contours of this network will have already changed by the time a set of eyes other than the authors' read these words. Finally, by focusing on the 131 PhD-granting institutions in the United States, we are focusing on a subset of the discipline that is more unequal in the representation of women, and is also the environment in which many future scholars are currently earning their degrees.
With these caveats in mind, we present this research as the first comprehensive analysis of the role of Twitter in re-structuring the rhythms and flows of academic knowledge dissemination. Our findings underscore the persistence of gender inequalities well-documented elsewhere in political science that persist on #polisci Twitter. Yet we highlight the attenuation of these inequalities when it comes to arguably the most important aspect of #polisci Twitter—the dissemination of research. We hope that this contribution improves the discipline’s presence online by highlighting the remaining areas of concern and presents a vision for what a more diverse discipline—and the #polisci Twitterverse—could look like.
Acknowledgements
They are grateful to feedback from Neil Malhotra and anonymous reviewers at the Journal of Politics, Francesca Parente, Mitchell Watkins, Abigail Vaughn, Jared Finnegan, Elif Kalaycioglu, Jan Zilinsky, Jonathan Mummolo, myriad political scientists who replied to a draft shared on Twitter, and three incredibly helpful anonymous reviewers at Perspectives on Politics.
Supporting Materials
Appendix A. Technical Details from Main Paper
Appendix B. Quality of Life Online
Appendix C. Heterogeneity across \also know" Engagement
Appendix D. Citations and Network Centrality
Appendix E. Robustness to Ivies and Productivity
Appendix F. Lecturers and Adjuncts
Appendix G. Community Behavior and Cross-Pollination
Appendix H. Homophily within Communities
Appendix I. ERGMs: Homophily Robustness
Appendix J. Ideology
Appendix K. Community Detection Robustness
Supplementary Materials
To view supplementary material for this article, please visit http://doi.org/10.1017/S1537592720003643.