Implication
This study showed that the fractional degradation rate (k d ) of starch of the washout fraction was lower than generally assumed. In addition, the rinsing method affected the k d caused by particulate matter loss. The effect of both observations on the effective degradation of starch varied between feed ingredients, and can therefore change the ranking in nutritive value.
Introduction
To meet nutrient requirements for high milk yields, diets for dairy cows are formulated for high intake of absorbable nutrients. In practical terms, this has been accomplished mainly through the addition of starch rich feed ingredients. Perceived benefits of feeding starch include increased metabolizable energy and metabolizable protein supply per unit of feed intake and thus greater milk and milk protein yield compared with feeding fibre, although there is no clear evidence as to the advantages of postruminal digestion of starch to enhance milk yield or to change milk composition compared with ruminal digestion of starch (Nocek and Tamminga, Reference Nocek and Tamminga1991). Starch digestion site is important for calculating the total fermentable carbohydrate supply to the rumen, which is relevant for managing rumen fermentation level, or potentially acidosis. Moreover, the site of starch digestion determines the type of nutrient (volatile fatty acid v. glucose) that is available for the animal, which is relevant for mechanistic nutritional models (Mills et al., Reference Mills, France and Dijkstra1999). Most starch is subject to extensive anaerobic degradation in the rumen. The standard procedure to measure ruminal degradation is the in situ method which is based on the disappearance of substrate from porous nylon (or dacron) bags in the rumen of rumen fistulated animals as described by Ørskov and McDonald (Reference Ørskov and McDonald1979), which is also used for starch (Cerneau and Michalet-Doreau, Reference Cerneau and Michalet-Doreau1991). The starch degradation rates obtained by the in situ method are used in numerous feed evaluation systems, such as DVE/OEB (van Duinkerken et al., Reference Duinkerken, Blok, Bannink, Cone, Dijkstra, van Vuuren and Tamminga2011), Norfor (Volden, Reference Volden2011) and PDI (Sauvant et al., Reference Sauvant, Perez and Tran2004), and mechanistic rumen models (Mills et al., Reference Mills, France and Dijkstra1999) to predict the nutritional value of feed ingredients.
One of the methodological problems of the in situ procedure is the loss of non-degraded particulate matter from the bags by rinsing both incubated and non-incubated nylon bags. This loss by rinsing is influenced by the interaction of the particle size of the feed material in relation to the pore size of the bag (Michalet-Doreau and Ould-Bah, Reference Michalet-Doreau and Ould-Bah1992; Vanzant et al., Reference Vanzant, Cochran and Titgemeyer1998; López, Reference López2005) and the severity of rinsing. The degradation rate of this washout fraction cannot be measured in situ and therefore in various feed evaluation systems assumptions on this degradation rate are made to be able to estimate the fermentability of the washout fraction (Offner et al., Reference Offner, Bach and Sauvant2003; van Duinkerken et al., Reference Duinkerken, Blok, Bannink, Cone, Dijkstra, van Vuuren and Tamminga2011; Volden, Reference Volden2011). The washout fraction of starch is relatively large and highly variable between feeds (Offner et al., Reference Offner, Bach and Sauvant2003; de Jonge et al., Reference Jonge, van Laar, Hendriks and Dijkstra2013) and is generally considered to be rapidly degradable based on theoretical assumptions about the degradation of small particles (France et al., Reference France, Dhanoa, Theodorou, Lister, Davies and Isac1993) and comparison between in situ and in vivo data (van Duinkerken et al., Reference Duinkerken, Blok, Bannink, Cone, Dijkstra, van Vuuren and Tamminga2011). However, the assumption that material washed out of nylon bags is rapidly and completely degraded in the rumen is not supported by in vitro gas production results (Yang et al., Reference Yang, Tamminga, Williams, Dijkstra and Boer2005; Cone et al., Reference Cone, van Gelder and Chai2006; Stevnebø et al., Reference Stevnebø, Seppälä, Harstad and Huhtanen2009). It should be noted that the rate of gas production reflects fermentation of the organic matter (OM) present, not solely the starch fraction. The size of the washout fraction in combination with the assumptions on its degradation rate strongly influence the effective in situ rumen degradation (effective degradation (ED)) of starch in feed ingredients (Offner et al., Reference Offner, Bach and Sauvant2003; Huhtanen and Sveinbjörnsson, Reference Huhtanen and Sveinbjörnsson2006) and the evaluation of the effects of expansion, extrusion and toasting on in situ starch degradation (Goelema et al., Reference Goelema, Spreeuwenberg, Hof, van der Poel and Tamminga1998; Offner et al., Reference Offner, Bach and Sauvant2003). Significant relationships with in vivo ruminal starch degradability have been found for both in situ measurements and in vitro approaches based on incubation with rumen fluid followed by determination of starch in the residue, with a stronger correlation for in situ than for in vitro estimates (r=0.84 and r=0.76; Weisbjerg et al., Reference Weisbjerg, Boas, Huhtala, Larsen and Hvelplund2011). Tahir et al. (Reference Tahir, Hetta, Larsen, Lund and Huhtanen2013) reported a somewhat higher correlation (R 2=0.81) between the predicted ruminal neutral detergent soluble digestibility based on in vitro gas production with ruminal starch digestibility for several products.
The hypothesis of this study is that the degradation of the washout fraction of starch can be estimated by using a modified in situ method combined with in vitro measurements. The modified in situ method uses a gentle rinsing method that strongly reduces the washout fraction of starch in feed ingredients compared with the conventional washing machine procedure (de Jonge et al., Reference Jonge, van Laar, Hendriks and Dijkstra2013). The differences found between the fractional degradation rate (k d ) of starch as determined by either rinsing method will depend on whether the k d of the washout and the non-washout fraction of starch are actually different. To gain insight into potential differences in k d between washout and non-washout fraction, the in vitro measurements are based on the comparison of starch degradation between the total feed ingredient and their non-washout fraction.
Material and methods
Rumen incubations were carried out with four lactating Holstein-Friesian dairy cows and were approved by the Experimental Animal Committee of Wageningen University, The Netherlands.
Materials
The feed ingredients barley, faba beans, maize, peas, oats and wheat were obtained from local commercial suppliers and were ground to pass a 3-mm sieve (ZM100; Retsch, Haan, Germany). For the in situ and in vitro experiment, different batches of these feed ingredients are used.
Methods
Design
This study consisted of an in situ and an in vitro experiment that were conducted with the six feed ingredients. The in situ experiment involved the comparison of rinsing nylon bags after rumen incubation, using a moderate rinsing method as described by de Jonge et al. (Reference Jonge, van Laar, Hendriks and Dijkstra2013) v. rinsing by a wool wash programme of a commercial washing machine (see the ‘Rinsing methods’ section). The k d of starch obtained with both rinsing methods was estimated. The particulate matter loss from the bag that occurs during incubation in the rumen was estimated by in vitro simulation and was used to correct the k d obtained with the moderate rinsing method. The in vitro experiment involved the incubation of the feed ingredients and their non-washout fractions obtained by the washing machine, in buffered rumen fluid during 48 h. The disappearance of starch in the residue and the gas production was measured during this incubation.
Rumen incubations
The cows were housed indoors and fed ad libitum a mixed ration of 50% grass silage (N, 16.6 g/kg dry matter (DM); NDF, 516 g/kg DM) and 50% maize silage (N, 11.5 g/kg DM; NDF, 397 g/kg DM; starch, 374 g/kg DM) at 0700 h. Cows received each day an additional 2 kg of protein-rich concentrate feed (N, 53.0 g/kg) and commercial concentrate feed (N, 29.8 g/kg) according to milk production level up to a maximum of 7 kg (on average 3±1 kg). Cows were 290±53 days in milk and produced 23.9±4.0 kg milk/day. All incubation times were conducted separately on different days, starting at 0900 h, according to the all in–all out principle. Samples were incubated for 2, 4, 8, 12, 24 and 48 h. Nylon bags were prepared according to the Dutch in situ protocol as described by Tas et al. (Reference Tas, Taweel, Smit, Elgersma, Dijkstra and Tamminga2006). Briefly, nylon bags with an inner size of 10×8 cm, a pore size of 40 μm and porosity of 0.30 (PA 40/30; Nybolt, Zurich, Switzerland) were filled with ~5 g of feed ingredient. The number of bags for each feed ingredient, rinsing method and incubation time combination was four per animal.
Rinsing methods
The modified rinsing method described by de Jonge et al. (Reference Jonge, van Laar, Hendriks and Dijkstra2013) was used. Briefly, four nylon bags were placed in a glass vessel (Ø 19 cm, 7 cm height) containing 500 ml buffer solution (12.2 g/l NaH2PO4·H2O and 8.9 g/l Na2B4O7·10H2O, adjusted to pH 6.2 with hydrochloric acid). The vessels were placed in a mechanical shaker (SW-20c; Julabo, Seelbach, Germany) and were shaken during 60 min at 40 s.p.m. at room temperature. For feed ingredient samples that were not rumen incubated, the buffer solution after rinsing was centrifuged for 15 min at 20 000×g at 25°C and the pellet containing the washout fraction (i.e. W-S fraction) of starch was quantitatively collected and weighed. The washing machine method was performed as described by Tas et al. (Reference Tas, Taweel, Smit, Elgersma, Dijkstra and Tamminga2006), using a programmable washing machine (AEG Turnamat, Nuremberg, Germany) with tap water at ~18°C and a gentle wool wash programme without centrifuging (40 min in ~80 l tap water with three swing turns). For both rinsing methods, the residue of starch in the nylon bags of non-rumen incubated feeds was defined as the non-washout fraction (i.e. D fraction).
Nylon bags after rinsing and the isolated pellets, obtained from non-incubated nylon bags using the modified rinsing method, were air-dried for at least 48 h at 70°C and weighed. The content of the four bags was combined by feed ingredient, animal and incubation time and ground to pass a 1-mm sieve. The samples were analysed for DM and starch.
In vitro simulation of particulate matter loss
An in vitro simulation, as described by de Jonge et al. (Reference Jonge, van Laar, Hendriks and Dijkstra2015), was conducted to mimic the process of particulate loss of starch during the incubation. For this purpose, nylon bags containing the feed ingredients were continuously rinsed at a shaking speed of 40 s.p.m. that previously showed the best correspondence to the rumen conditions (de Jonge et al., Reference Jonge, van Laar, Hendriks and Dijkstra2015). Data obtained for the decrease of starch in the residue from the nylon bag as a function of the incubation time were used to estimate the fractional particulate matter loss rate (k pl; h−1), the fraction of starch insensitive (F IS) and sensitive (F S; calculated as 1−F IS) to particulate matter loss, with the PROC NLIN procedure of SAS (2002) using a first-order model:
 $$Y\left( t \right)=F_{{\rm S}} {\times}{\rm exp}\left(\! {{\minus}k_{{{\rm pl}}} {\times}\,t} \right){\plus}F_{{{\rm IS}}} $$
where Y(t) is the fractional residue of starch after rinsing during t hours.
In vitro method
The in vitro fermentation was performed using a fully automated gas production technique as described by Cone et al. (Reference Cone, van Gelder, Visscher and Oudshoorn1996). Rumen fluid was collected 2 h after morning feeding from three lactating rumen-cannulated cows (220±38 days in milk; production 27.9±3.3 kg milk/day), fed as described in the previous section. Samples of 0.5 g of the total feed ingredient and their isolated non-washout fraction obtained by washing machine rinsing were incubated in 60 ml buffered rumen fluid in 250 ml bottles in a shaking water bath at 39oC, and gas production was recorded for 48 h as described by Cone et al. (Reference Cone, van Gelder, Visscher and Oudshoorn1996). Individual incubations were stopped at 4, 8, 24 and 48 h by addition of hydrochloric acid and contents of the bottles were freeze dried. The amount of starch was quantitatively determined in the lyophilized residue. All incubations were repeated in two independent runs containing one replicate within a run.
Chemical analyses
DM content was determined by drying to a constant weight at 103°C (ISO 6496, 1999). Starch was determined by an enzymatic method (ISO 15914, 2004).
Statistical analyses and calculations
The k d (h−1) of starch in both the in situ and the in vitro incubations was estimated with the PROC NLIN procedure of SAS (2002) using a first-order model:
 $$Y\left( t \right)={\rm exp}\left(\! {{\minus}k_{d} {\times}t} \right)$$
where Y(t) is the fractional residue of starch after incubation during t hours either expressed relative to residue after rinsing at t=0 h (in situ) or as relative to total starch incubated (in vitro). This model was fitted without a non-degradable fraction as starch was assumed to be totally degradable in both the in situ and in vitro method (Offner et al., Reference Offner, Bach and Sauvant2003). The effect of microbial contamination on the amount of starch in the nylon bag was regarded to be very small and was therefore ignored (Volden, Reference Volden2011).
The k d of starch corrected for particulate matter loss during incubation (k d -corr; h−1) was estimated as described by de Jonge et al. (Reference Jonge, van Laar, Hendriks and Dijkstra2015) with the PROC NLIN procedure of SAS (2002) using a first-order model, with F S, F IS and k pl taken from the in vitro simulation of particulate matter loss:
 $$\eqalignno{Y\left( t \right)=F_{{\rm S}} {\times}\,{\rm exp}\left(\! {{\minus}\left( {k_{d} {\rm {\hyphen}corr}{\plus}k_{{{\rm pl}}}\! }\right)\!\,{\times}\!\,t\!} \right) \cr\quad{\plus}F_{{{\rm IS}}} {\times}{\rm exp}\left(\! {{\minus}k_{d} {\rm {\hyphen}corr}{\times}t} \right)$$
Where Y(t) is the fractional residue of starch after incubation during t hours. The ED (g/g) of starch was calculated as:
 $${\rm ED}={\rm 1}{\minus}D{\plus}D{\times}\!\left[ {{\rm }k_{d}\! /\!\left( {k_{d} {\plus}k_{{\rm p}} } \right)} \right]$$
where D is the non-washout fraction of starch (g/g) and k p the fractional passage rate (h−1). In this study, a fixed value of 0.06 was used as k p.
In the in vitro method, the residues of the W-S fraction for all incubation times were estimated by:
 $$\eqalignno{ {\rm Residue}{\minus}{\rm washout}\,\left( t \right)={\rm exp}\left(\! {{\minus}k_{d} \left( {{\rm total}} \right){\times}t} \right)\,-\,D\cr & \quad \ {\times}{\rm exp } \left(\! {{\minus}k_{d} \left( D \right){\times}t} \right) $$
where k d (total) is the fractional disappearance rate of starch in the total feed ingredient and k d (D) the fractional disappearance rate of starch in the D fraction. The in vitro k d of the W-S fraction was estimated with the PROC NLIN procedure of SAS (2002) by using the estimated residue W-S as function of the incubation time as input variable.
The gas production results were fitted to a mono-phasic Gompertz curve (equation 6) using the PROC NLIN procedure of SAS (2002):
 $${\rm gas}\left( t \right)=A{\times}{\rm exp}\,\left(\! {{\minus}B{\times}{\rm exp}\,\left(\! {{\minus}C{\times}t} \right)} \right)$$
where gas(t) is the total volume of produced gas (ml) per g OM at time t, A the maximal gas production (ml/g OM incubated), and B and C are parameters that are related to the start time of gas production and the fractional rate of gas production, respectively. Parameter C is related to the k d obtained with the in vitro incubation, which were analysed with a first-order model.
ANOVA was conducted using the GLM procedure of SAS (2002). For the in situ measurements, the model consisted of the effect of rinsing (modified method and washing machine) for each feed ingredient. For the analysis of the difference of starch in the residue obtained with both rinsing methods, the model consisted of the effect of incubation time within feed ingredient. For the in vitro measurements, the model consisted of the effects of whole material or non-washout fraction and the feed ingredient. When treatment effects were detected (i.e. P<0.05), Tukey’s test was used to test multiple pairwise comparisons.
Results
In situ experiment
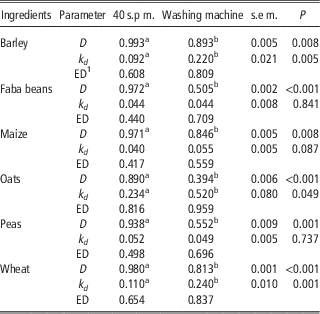
The new rinsing method increased (P<0.05) the non-washout fraction of starch for all feed ingredients compared with washing machine rinsing (Table 1). This increase ranged from 0.100 g/g for barley to 0.496 g/g for oats, leading to a non-washout fraction for starch between 0.890 g/g for oats and 0.993 g/g for barley using the modified rinsing method. The k d of starch for faba beans, maize and peas were comparable between both rinsing methods and varied between 0.040 and 0.055 h−1. For barley, oats and wheat, the k d of starch was lower with the new rinsing method compared with the washing machine method. For these products the average k d for starch decreased from 0.327 h−1 using the washing machine to 0.144 h−1 using the new rinsing method. The average ED decreased from 0.761 g/g using the washing machine to 0.572 g/g using the new rinsing method. The differences in ED of starch between rinsing methods varied between 0.141 g/g for maize and 0.269 g/g for faba beans.
Non-washout fraction (D; g/g, n=2), fractional degradation rate (k d ; h−1, n=4) and the calculated effective degradation (ED; g/g) of starch in six feed ingredients using the modified rinsing method (40 s.p.m.) or the washing machine method

Starch content (g/kg DM): barley 574; faba beans 441; maize 681; oats 427; peas 476; wheat 674.
a,bMeans in the same row with different letters differ (P<0.05).
1 Calculated as ED=(1−D)+D×(k d /(k p+k d )), where k p (fractional passage rate) is 0.06 h−1.
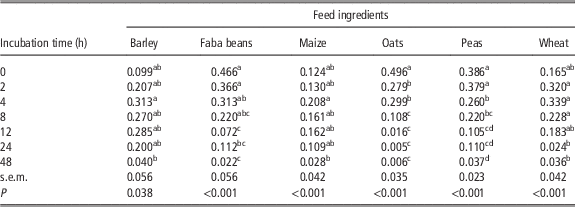
The difference in the amount of starch in the residue between 40 s.p.m. rinsing and the washing machine rinsing, expressed as fraction of the original amount of starch, as a function of the incubation time showed two patterns (Table 2). For faba beans, oats and peas, the difference between starch in the residue obtained with both rinsing methods decreased with longer incubation time. For these three feeds with high washout fraction the average difference between both rinsing methods decreased from 0.449 g/g at 0 h to 0.021 g/g at 48 h. For barley, maize and wheat, the difference between the relative amount of starch in the residue obtained with both rinsing methods increased during the first 4 h and then decreased with incubation time. For these ingredients, the average difference between both rinsing methods increased from 0.129 g/g at 0 h to 0.286 g/g at 4 h and subsequently decreased to 0.034 g/g at 48 h.
Difference between the amount of starch in the residue after rinsing at 40 s.p.m. and after the washing machine, expressed as fraction of the original amount, for different incubation times for six feed ingredients (n=4)

a,b,c,dMeans in the same column with different letters differ (P<0.05).
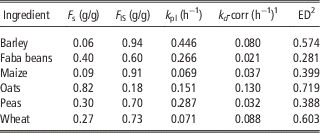
Particulate matter loss of starch during simulation of the rumen incubation by rinsing at 40 s.p.m. (Table 3) was different for the feed ingredients. For barley and maize only a small fraction of starch (i.e. <0.1) was sensitive (i.e. F s) to particulate matter loss and correction for this loss led to a decrease for the k d of starch of barley and maize of 0.012 and 0.003 h−1, respectively. For faba beans, peas and wheat, F s varied between 0.27 and 0.40 g/g, with a lower fractional disappearance rate (i.e. k pl) for wheat (0.071 h−1) than for peas and faba beans (0.287 and 0.266 h−1, respectively). Correction for particulate matter loss for these feed ingredients led to an average decrease in k d of 0.022 h−1. For oats, F s was large (i.e. 0.82 g/g) and correction led to a decrease of 0.104 h−1 in k d . Upon correction for particulate matter loss, the average ED decreased from 0.572 to 0.494 g/g. The decrease in ED ranged from 0.018 g/g for maize to 0.159 g/g for faba beans.
Fraction of starch in six feed ingredients sensitive to particulate matter loss (F S; g/g), fraction of starch insensitive to particulate matter loss (F IS; g/g) and fractional particulate matter loss rate (k pl; h−1) of F S obtained with simulation by rinsing at 40 s.p.m., as well as fractional degradation rate (k d -corr; h−1) and effective degradation (ED; g/g) for starch after correction of in situ k d for simulated particulate matter loss during incubation

1 Calculated as residue (t)=F S×exp(−(k pl+k d -corr)×t)+F IS×exp(−k d -corr×t).
2 Calculated as ED=(1−D)+D×(k d -corr/(k p+k d -corr)), where k p is 0.06 h−1 and D in Table 1.
In vitro experiment
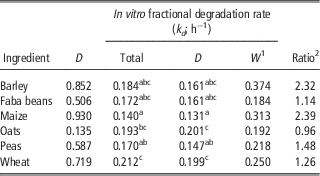
The non-washout fraction of starch of this batch of the feed ingredients ranged from 0.135 g/g for oats to 0.930 g/g for maize (Table 4) and differed from the results from the previous batch (Table 1). These differences ranged from 0.001 g/g for faba beans to 0.259 g/g for oats. The in vitro k d of starch in the total product significantly differed between the feed ingredients and ranged from 0.140 h−1 for maize to 0.212 h−1 for wheat (Table 4). The k d of the non-washout fraction was on average 0.93 of that of the total fraction and the difference was not significant. The calculated k d of the washout fraction (i.e. W) varied between 0.184 h−1 for faba beans and 0.374 h−1 for barley. The ratio between the k d of the washout and non-washout fraction ranged from 0.96 for oats to 2.39 for maize.
Starch non-washout fraction (D; g/g) obtained with the washing machine, in vitro fractional degradation rate (k d ; h−1) of starch in the total feed ingredient, and starch in the D fraction, and based on these the calculated k d in the washout fraction (W) of six feed ingredients (n=2)

For k d of total and D fraction: feed ingredient: P=0.001 with s.e.m. 0.009; fraction: P=0.126 with s.e.m. 0.005; no interaction between feed ingredient and fraction was observed (P=0.83).
a,b,cMeans in the same column with different letters differ (P<0.05).
1 Calculated based on the difference between the degradation of the total and D fraction.
2 Ratio is k d (W)/k d (D).
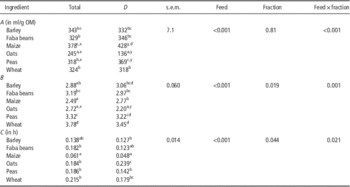
For all ingredients, all gas production characteristics (i.e. A, B and C in equation 5) were significantly affected by the feed and the interaction between feed and fraction while B and C were also significantly affected by the fraction (Table 5). The maximal gas production (A) ranged from 136 ml/g OM for the non-washout fraction of oats to 428 ml/g OM for the non-washout fraction of peas. For maize and peas, the maximal gas production of the total product was lower than that of the non-washout fraction, but for oats it was the reverse. The correlation between the maximal gas production and the content of starch in the samples was high (R 2=0.69) and further increased when the data set was limited to grains only (R 2=0.94). The fractional rate of gas production (C) for the total product differed significantly from the non-washout fraction. For all ingredients, except for oats, this rate was numerically larger for the total product than for the non-washout fraction, whereas for oats it was the reverse. The correlation between the rate of increase of the gas production characteristic C and the in vitro k d of starch (see Table 4) was high (R 2=0.76) and further increased when the data set was limited to grains (R 2=0.91).
Gas production characteristics (A, maximal amount of gas produced; B, scaling parameter related to the start of gas production; C, parameter related to fractional rate of gas production) of the total feedstuff and the non-washout starch (D) fraction of five feedstuffs

OM=organic matter.
Calculated as Gas(t)=A×exp (−B×exp (−C×t)) (Gompertz curve).
Starch content (g/kg): barley 520 (total) and 565 (D); faba beans 350 (total) and 385 (D); maize 620 (total) and 715 (D); oats 390 (total) and 106 (D); peas 400 (total) and 460 (D); wheat 550 (total) and 595 (D).
a,b,cMeans in the same column with different letters differ for each parameter (P<0.05).
x,yMeans in the same row with different letters differ (P<0.05).
Discussion
The aim of this study was to estimate the in situ rumen k d of starch of feed materials in both the washout and non-washout fraction by using a modified in situ protocol and additional in vitro measurements. The modified in situ measurement was based on reduction of the washout fraction and comparison of the k d to that obtained by the traditional washing machine procedure. Although with the modified method the reduction in washout fraction was successfully realized, which was in line with previous observations (de Jonge et al., Reference Jonge, van Laar, Hendriks and Dijkstra2013), this did not lead to a significant increase of k d of starch, as would be expected based on the assumptions on k d of the washout fraction used in the Dutch DVE/OEB system (i.e. 2×k d (D fraction)+0.375; van Duinkerken et al., Reference Duinkerken, Blok, Bannink, Cone, Dijkstra, van Vuuren and Tamminga2011) or the Scandinavian Norfor system (i.e. 1.5 h−1; Volden, Reference Volden2011). For faba beans, maize and peas, the k d remained the same despite the marked reduction of the washout fraction when using the new rinsing method, whereas for barley, oats and wheat the k d decreased compared with the washing machine rinsing method. These observations would suggest that the washout fraction of starch has a lower degradation rate than the non-washout fraction, which seems to be unrealistic based on the physical state of this fraction (France et al., 1993). An alternative explanation for this decrease in degradation rate is the process of particle size reduction during the incubation in combination with particulate matter loss, which was different for the two rinsing methods. This process is described as secondary particulate matter loss by Huhtanen and Sveinbjörnsson (Reference Huhtanen and Sveinbjörnsson2006) which is the breakdown of particles during the incubation to a size smaller than the pore size of the nylon bag, which makes them potentially sensitive to losses during rinsing. Results obtained for the washout fraction clearly demonstrated that the washing machine rinsing was much more effective in removing these small particles from the nylon bag compared with the modified method. Consequently, the in situ method was more affected by the process of particle size reduction when applying washing machine rinsing. For barley, wheat and to a lesser extent maize, this effect could be observed by an increase of the difference in the residual starch between both rinsing methods during the first 4 h of incubation, which implicates an increase of small particles in the polyester bags during the first stage of the incubation (Table 2). The effect of secondary particulate matter loss was also found in the study by Tothi et al. (Reference Tothi, Lund, Weisbjerg and Hvelplund2003). They showed a decrease of the k d of starch in barley and maize by reducing the pore size of the nylon bag from 36 to 15 μm. The consequence of secondary particulate matter loss is that the difference found for the k d of starch between both rinsing methods was not exclusively caused by the degradation rate of the washout fraction and could not be used to estimate the k d of this fraction.
The in vitro starch degradation results were not affected by the problem of secondary particulate matter loss and did not indicate any significant difference in k d between both methods. The ratio between the calculated k d of the washout fraction and the k d of the non-washout fraction averaged 1.59, but varied between 0.96 for oats and 2.39 for maize. The highest ratio was still lower than that which may be calculated using feed evaluation systems (van Duinkerken et al., Reference Duinkerken, Blok, Bannink, Cone, Dijkstra, van Vuuren and Tamminga2011; Volden, Reference Volden2011). The results from the gas production, especially for the fractional rate of gas production, were clearly correlated to the in vitro results and therefore also did not support the general assumption about the very fast degradation of the washout fraction of starch in feed ingredients. The negative effect of the presence of the washout fraction in oats on both the in vitro k d and the rate of increase of the gas production was quite remarkable. The results for the gas production were in line with the study by Stevnebø et al. (Reference Stevnebø, Seppälä, Harstad and Huhtanen2009) that showed no great differences between the small and large particles in several barley cultivars.
The in situ method is the standard method to predict the ruminal ED of nutrients and is used to rank feed ingredients according to nutritional value. The methodological weaknesses of applying washing machine rinsing were the use of assumptions for the washout fraction and the effect of secondary particle loss on the k d which led for starch to an overestimation of the in situ degradation. This overestimation, however, seems to partly compensate for the unfavourable fermentation conditions caused by limited access of microbes and accumulation of end products in the nylon bag compared with in vivo rumen conditions (Offner et al., Reference Offner, Bach and Sauvant2003), and for the high fractional passage rate assumed that ignores selective retention of feed particles in the rumen (Allen and Mertens, Reference Allen and Mertens1988). Hindle et al. (Reference Hindle, van Vuuren, Klop, Mathijssen-Kamman, van Gelder and Cone2005) showed that the efficiency of this compensation for unfavourable fermentation conditions varied strongly between feed ingredients. In that study a good match between the in vivo and in situ degradation of starch in wheat was obtained whereas for starch in maize a very large difference was found. The modified method reduced the methodological weakness of the washout fraction, but also reduced this compensation and therefore emphasized the difference between the calculated ED and the in vivo results for these ingredients as reported by Larsen et al. (Reference Larsen, Lund, Weisbjerg and Hvelplund2009). This difference even further increased when a full correction was made for possible particulate loss during the incubation leading to very low k d for starch (see Table 3). A regression between in vivo and in situ data, as given by Offner and Sauvant (Reference Offner and Sauvant2004), seems to be a good approach to convert in situ results into in vivo data.
The in vitro method could be an attractive alternative for the in situ method because of the absence of the problem of particulate matter loss that makes the need for assumptions on the k d of the washout fraction redundant. The gas production method, however, contains the disadvantages that it is not specific for starch and that the relation between starch degradation and gas production differs between feed ingredients (Chai et al., Reference Chai, van Gelder and Cone2004). In this study, this problem was observed by the decrease of the correlation between in vitro degradation and the rate of increase in gas production when the results from legume seed, containing a high amount of soluble proteins (de Jonge et al., Reference Jonge, van Laar, Hendriks and Dijkstra2013), were added to those from grains. An in vitro method based on measuring the starch degradation could be an attractive alternative, although the results of Weisbjerg et al. (2011) showed that this approach needs further improvement and validation. This approach, however, also required a conversion of in vitro results to the in vivo situation. To evaluate the benefit of this method above the in situ procedure additional research involving a larger set of feed ingredients with in vivo, in vitro and in situ techniques is required.
Conclusions
The in vitro results showed for all ingredients that the k d of starch in the non-washout fraction did not differ from that in the total product. The differences between k d of the washout and the non-washout fraction were much less than typically assumed in feed evaluation systems
The in situ k d of starch in barley, oats and wheat was affected by the particle size reduction of these products during the incubation, especially when using washing machine rinsing. The use of the modified rinsing method reduced the problem of particulate matter loss, but also led to a lower effective degradability when compared with in vivo results.
Acknowledgements
The authors thank Johan Heeren for assistance during the in situ trials and Saskia van Laar and Jane- Martine Muylaert to conduct the in vitro and chemical analyses, and the Dutch Product Board Animal Feed (PDV, Zoetermeer, The Netherlands) for financial support.