Introduction
Over the last century or so, the use of synthetic adsorbents in industrial gas separation and purification has become widespread.Reference Ruthven1–Reference Sircar6 As a result, pressure swing adsorption (PSA), the most common separation method, is now a mature technology. The materials used traditionally in these applications include activated carbons, activated alumina, silica gels, and zeolites.Reference Ruthven4,Reference Sircar, Myers, Auerbach, Carrado and Dutta5,Reference Sircar7 In recent years, the number of available adsorbents has increased significantly and now includes ordered mesoporous silicas,Reference Ciesla and Schüth8,Reference Edler, Bruce, O’Hare and Walton9 permanently microporous metal-organic frameworks,Reference Kondo, Yoshitomi, Matsuzaka, Kitagawa and Seki10–Reference MacGillivray14 covalent organic frameworks,Reference Han, Furukawa, Yaghi and Goddard15 and amorphous microporous organic polymers.Reference McKeown, Budd, Msayib, Ghanem, Kingston, Tattershall, Makhseed, Reynolds and Fritsch16–Reference Jiang and Cooper18 The dramatic growth in the range of materials and our ability to control their properties and characterize them at the nanometer scale, combined with a technological focus on the development of clean energy sources, has led to worldwide research efforts aimed at new gas storage, separation, and purification applications.
Characterizing the adsorption properties of a material under practical conditions is crucial both to assess its suitability for a specific task and to improve our understanding of the processes involved. Gas storage requires elevated pressures due to volumetric capacity considerations and the need to deliver gas at ambient pressure or above. Separation and purification, meanwhile, involve the selective adsorption of particular species from gas mixtures. However, both high pressures and multicomponent adsorption pose significant experimental challenges. In this article, following an introduction to nanoporous materials, we cover some emerging gas adsorption applications and discuss the associated measurement challenges.
Nanoporous materials and their gas adsorption properties
The term nanoporous refers to any material with a pore size below 100 nm. This encompasses both the microporous (<2 nm) and mesoporous (2–50 nm) regimes, as defined by International Union of Pure and Applied Chemistry (IUPAC) guidelines.Reference Sing, Everett, Haul, Moscou, Pierotti, Rouquérol and Siemieniewska19 There are many different types of nanoporous materials currently available.
Activated carbons are highly porous amorphous carbonaceous materials with large surface areas, and their properties are strongly dependent on the activation method and conditions used. They can possess a wide pore size distribution ranging from macropores down to micropores, although the carbon molecular sieves used for air separation typically have narrow pore constrictions (≈0.4 nm), which give them molecular sieving properties.Reference Chagger, Ndaji, Sykes and Thomas20 Zeolites, which are crystalline aluminosilicates formed from AlO4 and SiO4 tetrahedra, and other zeolitic materials, sometimes known as zeotypes that include aluminophosphates, borosilicates, and gallogermanates,Reference Lobo, Auerbach, Carrado and Dutta21 are microporous, although mesoporosity can be introduced into their structure.Reference Egeblad, Christensen, Kustova and Christensen22,Reference Lopez-Orozco, Inayat, Schwab, Selvam and Schwieger23 Silicas, including gels and surfactant-templated materials, such as MCM-41 (Mobil crystalline material),Reference Ciesla and Schüth8,Reference Edler, Bruce, O’Hare and Walton9 tend to be mesoporous. Silica xerogels and aerogelsReference Pierre and Pajonk24 have a disordered pore structure,Reference Ciesla and Schüth8,Reference Edler, Bruce, O’Hare and Walton9 whereas surfactant-templated materials have highly uniform pore networks that are determined by the surfactant micelles used in their synthesis.Reference Ciesla and Schüth8,Reference Edler, Bruce, O’Hare and Walton9
New materials include metal-organic frameworks (MOFs), which are formed from metal complexes, known as secondary building units, joined by organic linkers.Reference Férey13,Reference MacGillivray14 They can be formed, for example, from first row transition elements and multidentate carboxylic and pyridinic ligands and are generally microporous,Reference Suh, Park, Prasad and Lim25 although a significant number of mesoporous MOFs are now known.Reference Fang, Makal, Young and Zhou26,Reference Song, Zhang, Sun, Xu, Li, Zhang, Si, Jiao, Li, Liu, Liu, Zhou, Sun, Du, Cao and Gabelica27 The different types of microporous organic polymers (MOPs) include polymers of intrinsic microporosity,Reference McKeown, Budd, Msayib, Ghanem, Kingston, Tattershall, Makhseed, Reynolds and Fritsch16 hyper-cross-linked polymers,Reference McKeown, Budd and Book17 and conjugated microporous polymers, which are all noncrystalline.Reference Jiang and Cooper18 Covalent organic frameworks (COFs) are another type of MOP, which are crystalline, and can also be mesoporous.Reference Feng, Ding and Jiang28 More specifically, COFs are organic analogues of MOFs, formed from light elements such as H, B, C, O, and Si.Reference Feng, Ding and Jiang28–Reference Ding and Wang30
There are also many naturally occurring porous materials, including clays, shales,Reference Loucks, Reed, Ruppel and Jarvie31 coal,Reference White, Smith, Jones, Goodman, Jikich, LaCount, DuBose, Ozdemir, Morsi and Schroeder32–Reference Busch and Gensterblum34 and natural zeolites.Reference Ackley, Rege and Saxena35 Clays and zeolites tend to be microporous, while coal and shales are highly heterogeneous and possess a wide pore size distribution.
Nanoporous materials are of interest for adsorption applications because of the properties related to their porous structure, such as high surface area, large pore volume, and specific surface chemistry. However, some classes of nanoporous materials possess other properties that can also affect their adsorption behavior, such as framework (or structural) flexibility in the case of MOFs.Reference Fletcher, Thomas and Rosseinsky36 Surface functional groups may be added or modified by chemical treatment in the case of porous carbons,Reference Jagiełło, Sanghani, Bandosz and Schwarz37,Reference Zhao, Xiao, Fletcher and Thomas38 and MOFs are also amenable to post-synthetic modification.Reference Tanabe and Cohen39
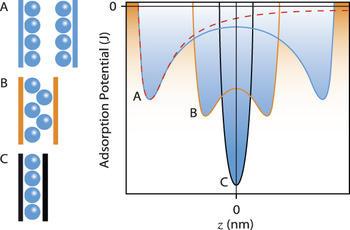
Gas adsorption is defined as the enhancement of the density of a particular species at the gas-solid interface. Physical adsorption, or physisorption, occurs as a result of van der Waals and electrostatic interactions and can be enhanced in micropores due to the overlap of the potential energy fields from the pore walls, which are known as adsorption potentials. However, adsorption in mesopores can also be significant, even in the absence of significant adsorption potential overlap, due to changes in the phase behavior of confined fluids.Reference Gelb, Gubbins, Radhakrishnan and Sliwinska-Bartkowiak40,Reference Monson41 This can lead to capillary condensation, in which a liquid-like phase forms under subcritical conditions at a pressure significantly below the saturation pressure. The change in adsorption potential with pore size is illustrated in Figure 1.
A schematic representation of the adsorption potentials for different width (graphitic) slit micropores (<2 nm), based on calculations using a 10–4 potential,Reference Everett and Powl42,Reference Kaneko and Murata43 which can be obtained from the integration, over two dimensions, of a 12–6 (Lennard-Jones) potential, to represent the intermolecular interactions between an adsorbate molecule and the surface carbon atoms in a graphite surface. The pore size, which is defined by the distance between the two graphite surfaces, decreases from A to C, while z expresses the distance from the central plane between the two surfaces. It can be seen that the potentials become deeper with decreasing pore size. The dashed red line shows the adsorption potential for a single graphite surface.

In terms of adsorption performance, there is typically a trade-off between the surface area, pore volume, and pore size. For example, in principle, a large total pore volume or surface area provides a significant region for adsorption, but materials containing mesopores might satisfy this condition while not possessing the high degree of microporosity required for enhanced adsorption. A balance must therefore be obtained between the pore size, pore volume, and surface area of a material in order to combine the benefits of each property. As a result, attempts to increase gas adsorption capacity by only increasing the pore size have limitations. The pore size is particularly crucial for some applications, for example, cavities and pore windows close to the dimensions of some adsorptives can lead to molecular sieving, in which the entry of certain species into the pores is either prevented entirely or is kinetically controlled. This effect has applications for gas separation.Reference Sircar, Myers, Auerbach, Carrado and Dutta5,Reference Ruthven44
Applications for gas adsorption by nanoporous materials
Adsorption plays a pivotal role in many applications, including catalysis, gas sensing, and drug delivery. However, we will focus on those that depend specifically on the high physical gas adsorption capacities of porous materials, namely gas storageReference Suh, Park, Prasad and Lim25,Reference Thomas45–Reference Makal, Li, Lu and Zhou48 or gas separation and purification.Reference Ruthven1,Reference Yang2,Reference Sircar6,Reference Li, Sculley and Zhou49,Reference Li, Kuppler and Zhou50
Gas storage
Gas storage applications exploit the enhancement in the density of an adsorbate in the pores of a material due to overlap of the adsorption potentials. For any given pressure, using nanoporous materials should, in principle, allow the storage of a gas at a higher density as compared to a compressed gas store or at a more practical temperature compared to a liquid. Two of the most prominent applications are the storage of supercritical hydrogen and methane for use as alternative energy carriers or fuels for transportation. In this case, the challenge is to find a material that can adsorb significant amounts of either species at ambient temperature and reasonable pressures (e.g., <10 MPa). This tends to rely on adsorption in micropores. Low temperatures are generally required for hydrogen adsorption, although other properties can be exploited to potentially raise the operational temperature, including the enhanced interaction of gases with specific surface sites and structural flexibility, which offers the possibility of trapping the adsorbate molecules within the pore structure.Reference Zhao, Xiao, Fletcher, Thomas, Bradshaw and Rosseinsky51
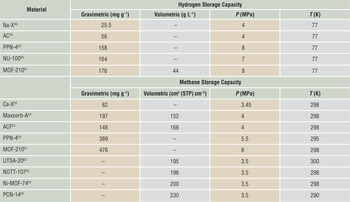
Many nanoporous materials have been investigated for hydrogen storage.Reference Suh, Park, Prasad and Lim25,Reference Thomas45,Reference Broom46 An increasing number are MOFs, but zeolites, silicas, carbons, and MOPs have all been the subject of recent studies.Reference Thomas45,Reference Tedds, Walton, Broom and Book52 Investigations of methane storage are increasing, and this trend is likely to continue due to the renewed interest in natural gas as an energy source.Reference Voser53 Previous studies of methane storage tended to focus on carbonReference Lozano-Castelló, Alcañiz-Monge, de la Casa-Lillo, Cazorla-Amorós and Linares-Solano54 and, to a lesser extent, zeolites and silicas.Reference Menon and Komarneni55 However, the emergence of MOFs as a potential storage material has inevitably led to an increased interest in their use for methane storage.Reference Konstas, Osl, Yang, Batten, Burke, Hill and Hill47,Reference Makal, Li, Lu and Zhou48,Reference Düren, Sarkisov, Yaghi and Snurr56–Reference He, Zhou, Krishna and Chen58 The materials exhibiting the highest hydrogen and methane storage capacities reported to date are listed in Table I. In practical applications, the compressed gas stored between the particles in the bed and in larger macropores, in which significant adsorption does not occur, also needs to be considered, together with the weight and volume of the storage system itself.
Absolute hydrogen and methane storage capacities of the best performing nanoporous materials, with some activated carbon and zeolite capacities included for comparison.

AC, ACF, and Maxsorb-A are porous carbons; Na-X and Ca-X are zeolites; PPN-4 is a porous organic polymer; the others are types of metal-organic frameworks. For comparison, the 2017 US Department of Energy (DOE) storage system targets for hydrogen include a gravimetric capacity of 0.055 kg H2 kg–1 (55 mg g–1 or 5.5 wt%) and a volumetric capacity of 0.04 kg H2 L–1 (40 g L–1)Reference Suh, Park, Prasad and Lim25 in the (delivery) temperature range of 233 to 358 K. The US DOE methane target, set in 2000, is 180 cmReference Talu3 (STP) cm–3 at 298 K and 3.5 MPa (where cm3 (STP) cm–3 is the standard temperature and pressure equivalent volume of methane per unit volume of the adsorbent).Reference Düren, Sarkisov, Yaghi and Snurr56,Reference Zhou57 Note: AC, activated carbon; ACF, activated carbon fiber; MOF, metal-organic framework; NOTT, Nottingham; NU, Northwestern University; PCN, porous coordination network; PPN, porous polymer network; UTSA, University of Texas at San Antonio.
Related applications include the sequestration of carbon dioxide and the exploitation of shale gas and coal bed methane. In the former, CO2 is removed from the atmosphere by injecting it into locations such as shale formations and non-economic coal seams.Reference White, Smith, Jones, Goodman, Jikich, LaCount, DuBose, Ozdemir, Morsi and Schroeder32,Reference Sakurovs, Day, Weir and Duffy66–Reference Sakurovs, Day and Weir68 This is related to the use of coal bed methaneReference Busch and Gensterblum34 and shale gas.69,Reference Kargbo, Wilhelm and Campbell70 The latter is classified as an unconventional gas resource. Recent advances in hydraulic fracturing and horizontal drillingReference Kargbo, Wilhelm and Campbell70 have made exploitation economically viable.69 This has been successfully demonstrated in the United States and has had a dramatic effect on the natural gas market.Reference Kuhn and Umbach71 The small total pore volume of shale causes a problem for gas adsorption studies because of the low uptakes, which are difficult to measure. However, in practice, the low sorption capacities of shale are counterbalanced by the prevalence of shale resources.69
For geological applications, it is important to assess the capacity of different formations, which can contain both compressed gas in macropores and an adsorbed phase in nanopores. Different materials have different storage capacities, and accurate assessment of this is an important challenge in adsorption research. However, for the exploitation of coal bed methane and shale gas, it is also important to understand the depletion of the resource, which is dependent on both the thermodynamics and kinetics of adsorption.Reference Busch and Gensterblum34
Separation and purification
Adsorption by nanoporous materials is used extensively for gas separationReference Ruthven1–Reference Sircar6 and is often the technology of choice for the production and purification of industrial gases.Reference Häring72 Examples include H2 purification, N2 and O2 production from air, and He production from natural gas. The most common mechanism used is the difference in the equilibrium uptakes of different gas or vapor species by the same adsorbent.Reference Sircar, Myers, Auerbach, Carrado and Dutta5,Reference Ruthven44 In fixed bed adsorption, a gas mixture is passed through an adsorbent column, in which one component is more strongly adsorbed. The bed is then regenerated by reducing the pressure or by heating. The former is known as pressure swing adsorption (PSA) and is the most commonly used method;Reference Sircar, Myers, Auerbach, Carrado and Dutta5,Reference Sircar6 the latter is known as temperature swing adsorption.
A key factor for any separation process is the selectivity, the definition of which depends on the mechanism. If separation is based on differences in equilibrium uptake, a simple selectivity can be calculated by comparing the isotherm uptakes at specific pressures. In the case of kinetic separations,Reference Ruthven1,Reference Yang2,Reference Sircar, Myers, Auerbach, Carrado and Dutta5,Reference Ruthven44 the ratio of the linear driving force rate constants can be compared. For air separation by PSA using carbon molecular sieves, for example, the equilibrium amounts of adsorbed O2 and N2 are very similar, whereas the linear driving force rate constant for O2 is at least 20 times that of N2, which results in highly selective adsorption of O2.Reference Chagger, Ndaji, Sykes and Thomas20,Reference O’koye, Benham and Thomas73–Reference Reid and Thomas75 However, for both types of separation, the working capacity of the adsorbent is also important. This may be defined as the difference between the uptake at the adsorption and desorption or purge pressures. Other important considerations include the ease of regeneration, the kinetics of adsorption/desorption, and the thermal stability of the material. The ease of regeneration requires a relatively low enthalpy of adsorption, to ensure the adsorbate is not too strongly bound, and the kinetics must be rapid enough to not inhibit the adsorption and regeneration processes.
CO2 is widely used in a range of industries and can be produced from many different sources, the most common being synthesis gas, or syngas, a term that covers a variety of gas mixtures consisting mainly of H2, CO, and N2, with lower concentrations of hydrocarbons, CO2, and Ar.Reference Häring72 Syngas itself can be produced in a number of ways, including the gasification of fossil fuels and biomass and steam reforming of natural gas.Reference Häring72 However, an emerging application is carbon capture and storage (CCS) for the reduction of greenhouse gas emissions from power plants.Reference Figueroa, Fout, Plasynski, McIlvried and Srivastava76–Reference Espinal and Morreale79 This involves CO2 removal from both pre- and post-combustion gas streams, and adsorption is one of the proposed methods for its capture. It has potential advantages over absorption by liquids, such as amine solutions, and a variety of porous adsorbents are therefore being considered.Reference Choi, Drese and Jones80–Reference Liu, Thallapally, McGrail, Brown and Liu84
Pre-combustion capture refers to the separation of CO2 from syngas that has undergone the water-gas shift reaction, in which H2O reacts with CO, to convert the CO into CO2 and produce further H2. The mixture therefore consists primarily of H2 and CO2, so the capture process mainly involves CO2/H2 separation. Depending on the gasification or reforming process, the pressure is typically a few MPa.Reference Plasynski, Litynski, McIlvried and Srivastava77,Reference Kanniche, Gros-Bonnivard, Jaud, Valle-Marcos, Amann and Bouallou85 Post-combustion capture predominantly involves the removal of CO2 from N2-rich flue gases at ambient pressure.Reference Figueroa, Fout, Plasynski, McIlvried and Srivastava76,Reference Drage, Snape, Stevens, Wood, Wang, Cooper, Dawson, Guo, Satterley and Irons86 It therefore requires CO2/N2 separation, normally in the presence of water vapor, and so hydrothermal stability is crucial.Reference Choi, Drese and Jones80–Reference D’Alessandro, Smit and Long82,Reference Liu, Thallapally, McGrail, Brown and Liu84,Reference Drage, Snape, Stevens, Wood, Wang, Cooper, Dawson, Guo, Satterley and Irons86,Reference Kizzie, Wong-Foy and Matzger87 Both hydrothermal and thermal stability are issues for MOFs and MOPs, because they are typically less stable than traditional adsorbents. However, some types, such as zeolitic imidazolate frameworks (e.g., ZIF-8), are reported to be relatively stable.Reference Li, Sculley and Zhou49,Reference Liu, Thallapally, McGrail, Brown and Liu84 Materials must also be resistant to other contaminants in flue gas.Reference Keskin, van Heest and Sholl81,Reference Liu, Thallapally, McGrail, Brown and Liu84,Reference Drage, Snape, Stevens, Wood, Wang, Cooper, Dawson, Guo, Satterley and Irons86,Reference Granite and Pennline88
New materials for CCS should therefore satisfy the stringent performance and long-term stability criteria for large-scale industrial use, involving real gas mixtures under cyclic conditions, as well as exhibiting high selectivities and working capacities, as determined under laboratory conditions. It is important to note that, due to its large quadrupole moment in comparison with other permanent gases, such as H2, CH4, and N2,Reference Reid and Thomas75 CO2 will generally adsorb more strongly, so most nanoporous materials could, in principle, be used for its separation.Reference Keskin, van Heest and Sholl81 Demonstrable CO2 selectivity alone is therefore not enough to qualify a material as a strong candidate for CCS applications. Economic and production scale-up considerations are also critical, which is particularly relevant, for example, when expensive MOFs are considered.Reference Liu, Thallapally, McGrail, Brown and Liu84
Adsorption measurement
Accurate determination of the adsorption behavior of a material is clearly important, regardless of the application. Data are required by chemical engineers for process design,Reference Sircar7 but such characterization is also critical for new materials discovery and development. Understanding the most important physical or chemical properties of a material and their effect on the thermodynamics and kinetics of adsorption will clearly help guide the materials development process.
Single component adsorption measurement techniques
Single component measurements most commonly involve the determination of adsorption isotherms, which are plots of the uptake of a particular gas versus pressure at constant temperature. In addition to providing the capacity of a material, isotherms measured at a range of temperatures also allow the determination of the enthalpy of adsorption at zero surface coverage,Reference Chen, Zhao, Putkham, Hong, Lobkovsky, Hurtado, Fletcher and Thomas89 which provides a fundamental measure of the adsorbate-adsorbent interaction. At higher loadings, adsorbate-adsorbate interactions can modify the enthalpy of adsorption.
The traditional methods are the volumetric and gravimetric techniques.Reference McBain and Bakr90–Reference Kiefer and Robens94 The most common form of the volumetric technique is the manometric method, in which the sorbed quantity is determined by measuring the change in pressure in a system of fixed volume. This is an indirect measurement in which gas is dosed from a calibrated volume into the sample cell. The pressure drop in the absence of adsorption can be calculated from the ratio of the dosing volume to the total dead volume of the system. Any further reduction in pressure is attributed to adsorption, the magnitude of which is calculated from a molar balance expression. This approach is commonly applied to the measurement of adsorption at sub-ambient pressure by commercial surface area and pore size distribution analyzersReference Lowell, Shields, Thomas and Thommes95 used as standard characterization tools for new nanoporous materials. The gravimetric method, on the other hand, is a direct measurement that uses a microbalance. A measurement begins at vacuum, and any weight gain at higher pressure is then attributed to adsorption.
In both techniques, isotherms are determined by sequentially dosing gas at increasing pressure. The calculated adsorption data must allow for the presence of the sample in the measurement chamber. The gravimetric method therefore requires corrections for the buoyancy effect, whereas the manometric method requires so-called dead volume or dead space corrections to account for the difference between the volume of the empty and loaded sample cell.
In principle, both techniques also allow for the determination of adsorption kinetics,Reference Kärger, Ruthven and Theodorou96 but the gravimetric approach has the significant advantage that kinetic measurements can be performed under isobaric (constant chemical potential) conditions. The data are then amenable to the application of kinetic models, such as the linear driving force,Reference Chagger, Ndaji, Sykes and Thomas20,Reference Reid and Thomas97 stretched exponentialReference Klafter and Shlesinger98–Reference Fletcher, Uygur and Thomas100 and double exponential models,Reference Fletcher, Cussen, Bradshaw, Rosseinsky and Thomas101 and solutions to the diffusion equation.Reference Chagger, Ndaji, Sykes and Thomas20,Reference Kärger, Ruthven and Theodorou96,Reference Crank102
Other methods have also been reported for the measurement of single component gas adsorption, although these are not as widely applied because they are either less convenient to implement or have lower accuracy. For example, there are a number of variations on the volumetric technique, which include differential volumetric measurementReference Zielinski, Coe, Nickel, Romeo, Cooper and Pez103,Reference Qajar, Peer, Rajagopalan and Foley104 and flowing methods.Reference Rouquerol, Rouquerol and Sing92,Reference Nelsen and Eggertsen105 Frequency response techniques have also been used to study kinetics.Reference Sircar7,Reference Kärger, Ruthven and Theodorou96
Multicomponent (competitive) adsorption measurement techniques
Multicomponent adsorption can be determined from variations of the volumetric and gravimetric techniques, but both require an additional method of determining the amount of each species adsorbed. Flowing gravimetric systems can be used, with the gas phase composition beyond the sample determined using a mass spectrometer.Reference Fletcher, Benham and Thomas106 Different volumetric approaches are also available, including both open and closed systems.Reference Talu3,Reference Talu107 Closed system methods typically involve the circulation of a mixture through an adsorbent bed and the analysis of the gas phase composition after equilibration. Open system approaches involve equilibrating an adsorbent bed with a mixture and either using a molar balance expression to calculate the amount of each component adsorbed, or desorbing the entire contents of the bed and subsequently analyzing its composition.Reference Sircar7
The volumetric and gravimetric techniques can also be combined such that the total adsorption is determined both volumetrically and gravimetrically. Providing that the adsorbates under investigation differ sufficiently in molecular weight, the amount of each component adsorbed can be calculated. The isotope exchange technique, which is a closed loop cycle approach involving isotopic tracers, can also be used.Reference Sircar7,Reference Rynders, Rao and Sircar108
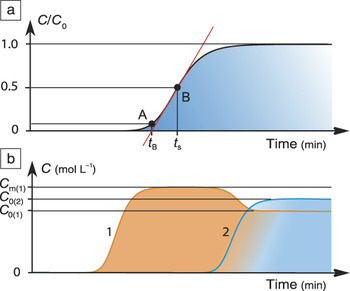
The measurement of breakthrough curves for packed beds, which show the time required for the components of the challenge (inlet) mixture to reach a preset fraction of the input concentration (C 0) at the outlet (see Figure 2), can also be used to study multicomponent adsorption.Reference Keskin, van Heest and Sholl81 Breakthrough curves can provide both a qualitative and quantitative comparison between materials, but the data can also be fitted to expressions, such as the Wheeler–JonasReference Wood109,Reference Lodewyckx, Wood and Ryu110 and constant pattern linear driving forceReference LeVan, Rodrigues, LeVan and Tondeur111 models, and others based on assumptions applicable to the adsorbate-adsorbent system under investigation. These expressions allow the quantification of kinetic parameters, as well as the breakthrough time (see Figure 2). The assumptions can include models for the variation in flow velocity across the reactor, isothermal or non-isothermal conditions, and linear or nonlinear isotherm behavior.Reference Ruthven1,Reference Yang2 Model breakthrough curves for single component and binary mixtures are shown in Figure 2.
Model breakthrough curves for (a) a single component in a carrier gas and (b) a two component mixture in a carrier gas.Reference Wood109C/C 0 is the breakthrough fraction, or the relative concentration of the adsorbate in the effluent gas stream, where C is the concentration at any given time, and C 0 is the inlet (challenge) concentration. A curve can be characterized by the breakthrough time, t B, which is the time taken for C/C 0 to reach a particular threshold (A), and the stoichiometric time, t s, which is the time taken to reach C/C 0 = 0.5 (B). The gradient of the red line is dependent on interparticle diffusion and intraparticle sorption kinetics, axial flow dispersion, and heat transfer effects.Reference Ruthven1 For the binary mixture, C m(1) is the maximum concentration in the bed reached by component 1, which is greater than its concentration at the inlet, C 0(1). C 0(2) is the inlet concentration of component 2, for which the adsorbent has a higher adsorption capacity.

Experimental challenges
Despite its conceptual simplicity, adsorption is surprisingly difficult to measure from a practical standpoint. Although low pressure single component gas adsorption measurements are relatively straightforward, care is still required to avoid common pitfalls and hence perform accurate measurements. However, some of the potential error sources increase significantly at higher pressures, which are often required in order to analyze the performance of materials for practical applications. The measurement of multicomponent adsorption, on the other hand, is challenging regardless of pressure.
Challenges in single component adsorption measurement
Single component gas adsorption measurements are common, partly due to the popularity of BET (Brunauer–Emmett–Teller) analysis of N2 adsorption data at 77 K to provide a comparative measure of the surface area of powders and porous materials, in particular, in catalysis, separation, and purification applications.Reference Rouquerol, Rouquerol and Sing92,Reference Lowell, Shields, Thomas and Thommes95 This approach, and the use of N2, Ar, and CO2 adsorption for the determination of pore volumes and pore size distributions, typically involves the measurement of adsorption at sub-ambient pressure using a manometric apparatus.Reference Lowell, Shields, Thomas and Thommes95 These measurements can still be subject to significant experimental error,Reference Sing, Everett, Haul, Moscou, Pierotti, Rouquérol and Siemieniewska19,Reference Badalyan, Pendleton and Wu112,Reference Pendleton and Badalyan113 but at elevated pressures, the errors increase notably due to a number of factors, including those related to the calculation of the adsorbed quantity, such as error propagation, and experimental problems, such as leaks in the apparatus and the presence of impurities in the gas phase at higher partial pressures.
Apart from the practical difficulties of working at higher pressures, there are two main issues: the definition or determination of the volume of the solid and the description of the behavior of real gases. Both issues affect the dead volume and buoyancy effect corrections, which are equivalent.Reference Fuller, Poulis, Czanderna and Robens114 The magnitudes of both corrections depend on the density of the displaced gas and therefore increase with pressure. They also depend on the sample density and, for a given sample mass, increase with decreasing material skeletal density.
The measured quantity in an adsorption experiment is the excess adsorption.Reference Sircar115,Reference Sircar116 In the volumetric case, this is defined as the difference between the amount of gas present in the dead (unoccupied) volume of the apparatus in the event of adsorption and the amount of gas that would otherwise be present in its absence. The latter is typically determined using helium, under the assumptions that helium adsorption is negligible and the volume accessible to the helium is equal to the volume accessible to the adsorbate. Neither assumption is likely to be completely satisfied, and any associated error will contribute to the error in the calculated excess adsorption. Application of the buoyancy effect correction in the gravimetric case, without accounting for the adsorbed phase, also yields the excess adsorption.
At higher pressures, it is necessary to account for real gas behavior.Reference Zhou, Wu, Hartman and Yildirim117 The molar balance expressions used to calculate adsorption in the manometric method include the compressibility factor, Z, of the gas. Similarly, the gas density is also required for the buoyancy effect corrections. The determination of Z requires the use of an accurate equation of state, but also high accuracy measurement of both pressure, P, and temperature, T. The effect of errors in P, T, and Z depends on the gas species because of differences in their behavior. The problems are particularly acute for CO2Reference Busch and Gensterblum34,Reference van Hemert, Bruining, Rudolph, Wolf and Maas118 because of the strong dependence of Z on temperature and pressure near its critical point (7.38 MPa, 304 K), which is a region of practical interest. Any error in Z will again contribute to the error in the calculated excess adsorption.
A further consideration is the conversion of the excess adsorption, n ex, to the absolute adsorption, n abs, which is defined as the total amount of adsorbate in the adsorbed phase. This can be calculated using the following equation,
 $$n_{abs} {\rm{ = }}\,n_{{\rm{ex}}} \,{\rm{ + }}\,V_{\rm{a}} \rho _{\rm{g}} {\rm{,}}$$
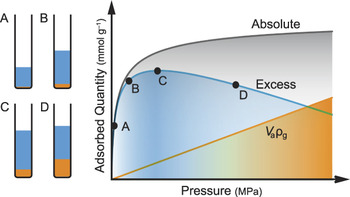
where V a is the volume of the adsorbed phase, and ρg is the bulk gas phase density. At low pressures, V aρg will be small and can be insignificant when there is a significant amount of adsorption. However, this is not the case at elevated pressures and supercritical temperatures, so careful attention must be paid to the conversion under these conditions. The difference between n ex and n abs is illustrated schematically in Figure 3. It can be seen that n ex reaches a peak at elevated pressures and then decreases as the V aρg term becomes more significant.Reference Sakurovs, Day, Weir and Duffy66–Reference Sakurovs, Day and Weir68,Reference Sircar115,Reference Gensterblum, van Hemert, Billemont, Busch, Charriére, Li, Krooss, de Weireld, Prinz and Wolf119 The difficulty is that V a is unknown.Reference Sircar115,Reference Sircar116
A schematic representation of the difference between the excess and absolute adsorption as a function of pressure at constant temperature. The pores on the left-hand side are shown filling up as a function of the total pressure. The blue and orange regions represent the magnitude of the excess adsorption and the V aρg term, respectively. At low total pressure (A), the majority of the absolute adsorption is due to the excess, but at high pressures (D), the V aρg term contributes significantly to the absolute value. The excess begins to decrease once the V aρg term reaches a sufficient magnitude. The pressure at which this occurs is usually above ambient, but its actual value is dependent on the measurement temperature and the adsorbate-adsorbent system. Note: V a, volume of the adsorbed gas; ρg, bulk gas phase density.

The crystallographic structures of zeolites and MOFs can be determined using x-ray or neutron diffraction. Both techniques give a good indication of the pore volume, V pore, which consists mainly of micropores. In this case, it seems reasonable to assume that V a = V pore, and this approach is used in the recent literature on hydrogen storage by MOFs.Reference Furukawa, Miller and Yaghi120,Reference Murray, Dincă and Long121 However, this is only an assumption, and it is possible that this approach may overestimate the absolute adsorption at lower pressures, in particular, and for larger pore materials, in general.
On the other hand, the structure of amorphous materials, such as activated carbons, polymers of intrinsic microporosity, and hyper-cross-linked polymers, as well as natural adsorbents, including coals and shales, cannot be determined crystallographically. These materials also possess a distribution of pore sizes, which cannot be determined precisely. The only methods currently available for pore volume and pore size distribution determination are based on gas adsorption, and these have their own limitations.Reference White, Smith, Jones, Goodman, Jikich, LaCount, DuBose, Ozdemir, Morsi and Schroeder32,Reference Hall, Brown, Fernandez and Calo122–Reference Lozano-Castelló, Cazorla-Amorós and Linares-Solano124 Therefore, the use of the assumption V a = V pore is more problematic for these materials, and the use of other approachesReference Murata, El-Merraoui and Kaneko125 may be more appropriate. The main alternative is to assume that the adsorbed phase has a constant density, but its exact nature, particularly at supercritical temperatures, is unknown.Reference Sakurovs, Day, Weir and Duffy66–Reference Sakurovs, Day and Weir68,Reference Sircar115,Reference Sircar116
This issue is likely to remain an active area of research, particularly as the absolute adsorption isotherm is also required for the comparison of experimental data with simulation results,Reference Talu and Myers126 which is an area of significant current interest.Reference Düren, Bae and Snurr127–Reference Xiang, Cao, Lan, Wang and Broom129 It is also crucial for the exploitation of shale gas and coal bed methane because, at higher pressures, although n abs may decrease as the resource is depleted, n ex may increase. Understanding the relationship between these two quantities is therefore important.
Challenges in multicomponent (competitive) adsorption measurement
The difficulty with multicomponent adsorption measurement is the determination of the concentration of each species in the adsorbed phase. Total uptakes from gas mixtures may be measured gravimetrically, but the composition of the adsorbed phase can only be inferred indirectly by assessing the amount of each species removed from the gas phase. This approach is limited by the sample size and the amount of adsorption exhibited by the material. Desorption of the adsorbed phase is then required to establish the amounts of each component present.Reference Fletcher, Benham and Thomas106 Similarly, volumetric techniques rely on the determination of the composition of a gas mixture in equilibrium with the solid, rather than the direct determination of the amount of each adsorbed component.
At elevated pressures, both volumetric and gravimetric measurements of multicomponent adsorption are affected by the same issues as single component adsorption, namely the definition and determination of the volume of the solid and the description of real gas behavior. For process design, the excess quantities may be used,Reference Talu3,Reference Sircar6,Reference Sircar7,Reference Sircar115,Reference Sircar116 so for some applications the excess to absolute conversion is not necessarily required. However, multicomponent volumetric measurements have additional issues. According to Talu,Reference Talu3,Reference Talu107 closed systems have significant advantages in terms of accuracy. The open system methods require accurate measurement of both the flow and gas composition at the outlet, which is difficult to achieve. Closed system measurements provide higher accuracy because they rely on the measurement of equilibrium pressures rather than flow, but it is important to ensure that the gas composition throughout the system is under equilibrium. Accuracy considerations require the use of relatively large sample sizes, which are not always available for newly synthesized materials, and there is also no way of controlling the equilibrium pressure of each component.Reference Sircar7,Reference Rynders, Rao and Sircar108
In addition, multicomponent measurements are laborious. The time required can be appreciated by considering that one measurement yields a single data point, in terms of pressure, temperature, and composition (of either the bulk gas or adsorbed phases), yet equilibrium may take several hours or days, depending on the species, the adsorbent and, to a certain extent, the measurement method, because closed systems equilibrate more slowly than open systems.Reference Talu3
The above points constitute serious practical challenges to the efficient and accurate measurement of multicomponent gas adsorption and have undoubtedly contributed to the shortage of comprehensive multicomponent adsorption data in the literature.Reference Sircar6 The number of materials being considered for adsorption applications and the laborious nature of multicomponent measurements means that the amount of multicomponent data available is likely to remain small compared with the number of possible adsorbate-adsorbent combinations. Models for the prediction of the adsorption of binary or higher mixtures from single component data, such as the ideal adsorbed solution theory,Reference Ruthven1,Reference Yang2 offer an alternative for the determination of multicomponent adsorption equilibria, but these models still require experimental datasets for their validation. The measurement of breakthrough data offers an attractive alternative, as this technique is more rapid than the equilibrium methods. However, more work is required in order to correlate multicomponent breakthrough data with detailed single component equilibrium and kinetic measurements.Reference Bell, Angus, Todd and Thomas130
Future outlook
The dramatic increase in the development of new classes of porous materials, such as MOFs and MOPs, will provide the impetus for the development of new gas storage, separation, and purification processes. These new materials possess unique properties based on a wide range of possible pore structures, and their tunable surface chemistry and structural flexibility. Framework flexibility in the new materialsReference Férey13,Reference Fletcher, Thomas and Rosseinsky36,Reference Thomas45,Reference Zhao, Xiao, Fletcher, Thomas, Bradshaw and Rosseinsky51,Reference Stylianou, Rabone, Chong, Heck, Armstrong, Wiper, Jelfs, Zlatogorsky, Bacsa, McLennan, Ireland, Khimyak, Thomas, Bradshaw and Rosseinsky131 should provide improved functionality for solving separation problems.Reference Li, Sculley and Zhou49,Reference Li, Kuppler and Zhou50
The potential applications of porous materials in high pressure supercritical hydrogenReference Suh, Park, Prasad and Lim25,Reference Zhao, Xiao, Fletcher and Thomas38,Reference Thomas45,Reference Broom46,Reference Zhao, Xiao, Fletcher, Thomas, Bradshaw and Rosseinsky51,Reference Tedds, Walton, Broom and Book52,Reference Yuan, Lu, Zhao and Zhou59–Reference Furukawa, Ko, Go, Aratani, Choi, Choi, Yazaydin, Snurr, O’Keeffe, Kim and Yaghi61,Reference Furukawa, Miller and Yaghi120,Reference Murray, Dincă and Long121 and methaneReference Konstas, Osl, Yang, Batten, Burke, Hill and Hill47,Reference Makal, Li, Lu and Zhou48,Reference Lozano-Castelló, Alcañiz-Monge, de la Casa-Lillo, Cazorla-Amorós and Linares-Solano54–Reference Yuan, Lu, Zhao and Zhou59,Reference Furukawa, Ko, Go, Aratani, Choi, Choi, Yazaydin, Snurr, O’Keeffe, Kim and Yaghi61–Reference Ma, Sun, Simmons, Collier, Yuan and Zhou65 storage for transport applications will continue to be a major driving force. However, the use of these materials for gas separation and purification, liquid phase separations,Reference Li, Sculley and Zhou49,Reference Cychosz, Ahmad and Matzger132 and catalysisReference Férey13,Reference Song, Zhang, Sun, Xu, Li, Zhang, Si, Jiao, Li, Liu, Liu, Zhou, Sun, Du, Cao and Gabelica27,Reference Ding and Wang30,Reference Procopio, Linares, Montoro, Colombo, Maspero, Barea and Navarro133 is also likely develop alongside gas storage. Carbon capture and storageReference Choi, Drese and Jones80–Reference Liu, Thallapally, McGrail, Brown and Liu84 is likely to feature prominently, but other potential gas and vapor phase applications include the energy efficient separation of H2/D2,Reference Chen, Zhao, Putkham, Hong, Lobkovsky, Hurtado, Fletcher and Thomas89,Reference Zhao, Villar-Rodil, Fletcher and Thomas99,Reference Cai, Xing and Zhao134 xylenes/ethylbenzene,Reference Li, Sculley and Zhou49 xyleneReference Stylianou, Rabone, Chong, Heck, Armstrong, Wiper, Jelfs, Zlatogorsky, Bacsa, McLennan, Ireland, Khimyak, Thomas, Bradshaw and Rosseinsky131 and alkane (e.g., hexane) isomers,Reference Li, Sculley and Zhou49,Reference He, Zhou, Krishna and Chen58 acetylene/ethene,Reference He, Zhou, Krishna and Chen58,Reference Xiang, Zhang, Zhao, Hong, Zhao, Ding, Xie, Wu, Das, Gill, Thomas and Chen135,Reference Bloch, Queen, Krishna, Zadrozny, Brown and Long136 benzene/cyclohexane,Reference Procopio, Linares, Montoro, Colombo, Maspero, Barea and Navarro133 and alkane/alkene mixtures, such as ethane/ethene,Reference Bloch, Queen, Krishna, Zadrozny, Brown and Long136 propane/propene,Reference Bloch, Queen, Krishna, Zadrozny, Brown and Long136 and isobutane/isobutene.Reference Li, Sculley and Zhou49,Reference He, Zhou, Krishna and Chen58 If the emerging materials prove to be practical for industrial use, significant performance improvements can be expected in a range of existing processes, including natural gas and biogas upgrading, H2 and C2H2 purification,Reference Li, Sculley and Zhou49 air separation,Reference Chagger, Ndaji, Sykes and Thomas20,Reference Li, Sculley and Zhou49,Reference O’koye, Benham and Thomas73–Reference Reid and Thomas75 He production from natural gas, and the purification and recovery of Xe and other noble gases.Reference Li, Sculley and Zhou49,Reference Li, Kuppler and Zhou50,Reference Häring72
Although many new nanoporous materials have been discovered, their use in industrial separation processes remains largely unexplored. Providing the economics and scale-up are feasible, this promises to be a fertile area for future collaborative research between materials scientists, chemists, and chemical engineers. Thorough adsorption characterization, as discussed in this article, will be crucial in this respect.
Geological storage of CO2 and the exploitation of natural gas adsorbed in geological formationsReference White, Smith, Jones, Goodman, Jikich, LaCount, DuBose, Ozdemir, Morsi and Schroeder32,Reference Sakurovs, Day, Weir and Duffy66–Reference Sakurovs, Day and Weir68 are also of critical importance in energy research. The primary challenge for adsorption studies in this area is the accurate determination of the adsorption characteristics of these materials, under practical conditions of temperature and pressure, in order to help assess reservoir capacity and available gas reserves. As the interest in unconventional gas resources continues,Reference Kuhn and Umbach71 an increased focus on understanding the gas adsorption behavior of materials found in geological formations is likely.
Conclusions
The discovery of new material classes in recent years has intensified the focus on adsorption applications, among which energy storage technologies for transport applications have been particularly prominent. The development of new nanoporous materials for gas storage requires accurate characterization of their adsorption properties under elevated pressure conditions. Storage in naturally occurring nanoporous materials such as shales and coals requires assessment of the suitability of geological formations for CO2 sequestration and the exploitation of coal bed methane and shale gas, which involves adsorption characterization under high pressure and temperature conditions. However, the measurement of gas adsorption is technically demanding at elevated pressures where the accuracy of the equation of state, propagation of errors, and adsorption of impurities become significant factors. The conversion of the experimentally determined excess to the absolute adsorbed quantity is also an issue.
Studies of adsorption of pure gases are suitable for storage applications, but gas separation and purification of mixtures requires multicomponent adsorption measurements, since competitive adsorption is an important factor. Improved methodology for routine multicomponent adsorption measurement is needed because current methods are laborious. Detailed comparisons between adsorption bed breakthrough measurements and isotherm adsorption and kinetic measurements are an alternative and should help improve our understanding of gas separation and purification processes. Further work in this area will undoubtedly aid the discovery and development of new nanoporous materials for targeted applications, as well as contributing to the investigation of the use of these materials in industrial processes.

Darren P. Broom is a product manager for Hiden Isochema Ltd. He received his PhD degree from the Institute for Materials Research at the University of Salford in 2003. He was a postdoctoral research fellow at the European Commission’s Institute for Energy in The Netherlands since 2004, working on the characterization of hydrogen storage materials, before returning to the UK and joining Hiden Isochema in 2007. Broom is a member of the American Chemical Society and author of Hydrogen Storage Materials, a monograph in the Springer book series Green Energy and Technology. Broom can be reached at Hiden Isochema Ltd., UK; tel. 44-1925-244678; and email dbroom@hidenisochema.com.

K. Mark Thomas is a professor of carbon science at Newcastle University in the UK. He received his BSc degree from Bristol University in 1968, PhD degree from the University of Kent in 1971, and completed postdoctoral studies at the University of Sussex before moving to British Gas, where he was the principal scientist. Thomas joined the Chemistry Department at Newcastle University in 1989 and moved to the School of Chemical Engineering and Advanced Materials in 2008, where he is currently head of the Wolfson Northern Carbon Reduction Laboratories. His current research interests are gas storage and separation using adsorption methods, and he has more than 150 publications. Thomas can be reached at Wolfson Northern Carbon Reduction Laboratories, School of Chemical Engineering and Advanced Materials, Newcastle University, UK; tel. 44-191-222-6839; and email mark.thomas@ncl.ac.uk.