Introduction
The olive tree (Olea europaea Linnaeus (Oleaceae)) is one of the oldest and most cultivated domestic fruit tree worldwide (Fabbri et al. Reference Fabbri, Lambaradi and Tokatli2009). Its cultivation is concentrated in Mediterranean climate regions located between 30° and 45° of latitude, both in northern and southern hemispheres (Benhayoun and Lazzeri Reference Benhayoun and Lazzeri2007). Globally, over 97% of the cultivated area, which is about 10.5 million ha, are located in the Mediterranean basin, 0.8% in the Americas, 1.5% in Asia, and 0.01% in Oceania (Chafaa Reference Chafaa2013).
In Algeria, olive-growing orchards cover over 310 664 ha in the east of the country, 153 845 ha in the centre, and 67 794 ha in the west. The irrigated area, concentrated mainly in the west of the country, does not exceed 13% (Chafaa Reference Chafaa2013). The average annual yield is estimated at 33 000 tonnes of oil, the equivalent of 8% of the annual national consumption of fats, while table olive production is around 68 450 tonnes (Institut Technique de l’Arboriculture Fruitière et de la Vigne 2010). Unfortunately, this strategic culture in Algeria and in the Mediterranean has not been supported by monitoring and surveillance studies regarding the evolution of these agroecosystems established in areas under severe climatic conditions undergoing unpredictable and frequent changes, which cause drastic modifications in the structure and organisation of biocenoses (Chafaa Reference Chafaa2013; Mekahlia et al. Reference Mekahlia, Beddiar and Chenchouni2013).
Despite olive rusticity and plasticity, which enable it to thrive and produce under difficult ecological conditions, Algerian olive growing is characterised by the advanced aging of trees or the lack of cultural care for the majority of plantations (Chafaa Reference Chafaa2013). Olive-growing plantations are prone to many diseases, including Verticillium diseases (Verticillium dahlia Klebahn (Fungi: Plectosphaerellaceae)) and tuberculosis (Pseudomonas savastanoi (Janse) Gardan et al. (Bacteria: Pseudomonadaceae)) (Schnathorst Reference Schnathorst, Mace, Bell and Beckman1981; Krid et al. Reference Krid, Rhouma, Queseda, Penyalver and Gargouri2009). The main pest species that develop on olive timber, foliage, flowers, and fruits and cause considerable damage to the tree and the production are Otiorhynchus cribricollis Gyllenhal (Coleoptera: Curculionidae), Prays oleae Bernard (Lepidoptera: Plutellidae) (Arambourg Reference Arambourg and Balachowsky1966; Chermiti Reference Chermiti1992), Euphyllura olivina (Costa) (Hemiptera: Psyllidae) (Daane et al. Reference Daane, Rice, Zalom, Barnett, Johnson, Sibbett and Ferguson2005), Bactrocera oleae (Rossi) (Diptera: Tephritidae), and Parlatoria oleae (Colvée) (Hemiptera: Diaspididae) (Spanedda and Pucci Reference Spanedda and Pucci2006; Chafaa et al. Reference Chafaa, Biche, Chenchouni, Sellami and Sibachir2013a).
Several studies have investigated the natural history and population dynamics of certain olive tree pests such as Parlatoria oleae (Holgado and Gasparini Reference Holgado and Gasparini2008; Chafaa et al. Reference Chafaa, Biche, Chenchouni, Sellami and Sibachir2013a, Reference Chafaa, Biche, Chenchouni, Sellami and Sibachir2013b), Bactrocera oleae (Petacchi and Minnocci Reference Petacchi and Minnocci1994), Euphyllura olivina (Amin et al. Reference Amin, Helmi, El-Wan and Youssef2013), and Prays oleae (Kumral et al. Reference Kumral, Kovanci and Akbudak2005). However, few studies have been carried out in Algeria and northern Africa on the biodiversity of insects subservient to olive groves, particularly under arid and semiarid conditions. Given the economic and social importance of the olive tree (Mekahlia et al. Reference Mekahlia, Beddiar and Chenchouni2013), its culture has been the object of research and experimentation to improve its productivity (Gaouar Reference Gaouar1996; Meddad-Hamza et al. Reference Meddad-Hamza, Hamza, Neffar, Beddiar, Gianinazzi and Chenchouni2017). Unfortunately, in Algeria, the emphasis on olive cultivation and the study of its pests is insignificant compared with other olive-growing countries (Chafaa Reference Chafaa2013).
The main objective of this study is assessing the diversity of insects subservient to the agrosystems of olive plantations grown in two bioclimatic zones (arid and semiarid) of northeastern Algeria. It is noteworthy mentioning that climate is the main driver that controls the distributional range of insects as well as the seasonal variation in their community composition (Chenchouni et al. Reference Chenchouni, Menasria, Neffar, Chafaa, Bradai and Chaibi2015; Chenchouni Reference Chenchouni2017). Indeed, several studies investigating agrosystems in the drylands of Algeria demonstrated that climate types and climatic parameters are the key determinants of population dynamics, breeding and migration phenology, adult flight, and ethological activities in insects (Chafaa et al. Reference Chafaa, Biche, Chenchouni, Sellami and Sibachir2013a, Reference Chafaa, Biche, Chenchouni, Sellami and Sibachir2013b; Idder-Ighili et al. Reference Idder-Ighili, Idder, Doumandji-Mitiche and Chenchouni2015). Therefore, we expect that biodiversity traits of insect communities differ beneath different climates of the agrosystems on which they depend. We assume that both species richness and biodiversity of insects increase when climate aridity decreases because physiological and behavioural activities of insects, and thus their reproduction and abundance, tend to be limited under severe environmental conditions. The question we raise here: is it the same for insects of olive groves grown under arid and semiarid climates? This question is expected to bring new insights that broaden our understanding on the composition of the entomofauna of olive agrosystems in arid northern Africa, which is considered a heavily understudied part of the world. Results of this survey are essential to sustainably manage horticultural agrosystems in drylands as they provide a comprehensive assessment of insect biodiversity and their similarity between climatic regions, which can be used to identify the structure of populations, including pests and predators. This information is of high value in planning biocontrol programmes and thus vital for maintaining balanced and well-functioning ecosystems.
Materials and methods
Study area
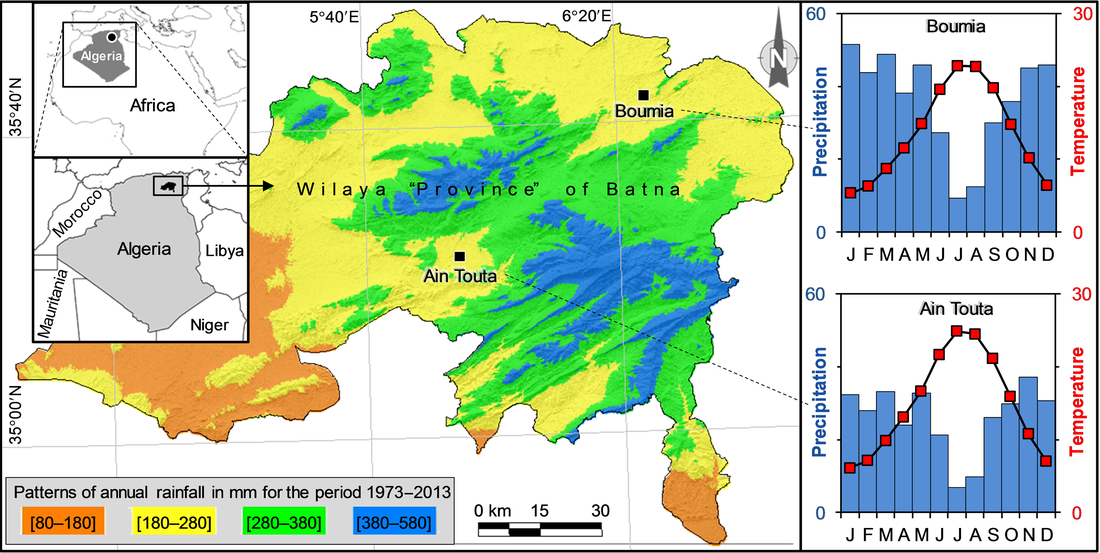
The study was carried out in Boumia Station and Ain Touta Station in the province of Batna (northeastern Algeria) – Boumia located in the northeast and Ain Touta in the south (Fig. 1). Boumia Station (35°42′40.6″N, 06°25′01.8″E, 833 m) is located within the semiarid bioclimatic zone with mild winter (minimum temperature 0.05 °C, maximum temperature 35.6 °C, and Emberger’s index Q 2 = 32). The study olive orchard extends over an area of 1 ha with a total of 200 olive trees distributed over four varieties, of which the Chemlal variety was the dominant. With a height of 2–3 m, the trees are extensively planted with 7 × 7 m spacing, and surrounded by a windbreak line composed of Mediterranean cypresses (Cupressus sempervirens Linnaeus (Cupressaceae)). The vegetation cover of weeds with the orchard is estimated at 50–60% (Supplementary Tables 1–2). Agricultural maintenance operations, namely tipping irrigation, regular pruning, soil fertilisation with farm manures, and mechanical weeding, were carried out every year. The orchard is grown organically.
Map of the annual precipitation of the Wilaya region of Batna (northeastern Algeria) with the geographical locations of the two study olive-growing stations (Boumia and Ain Touta). Right graphs represent climate diagrams of Gaussen and Bagnouls.
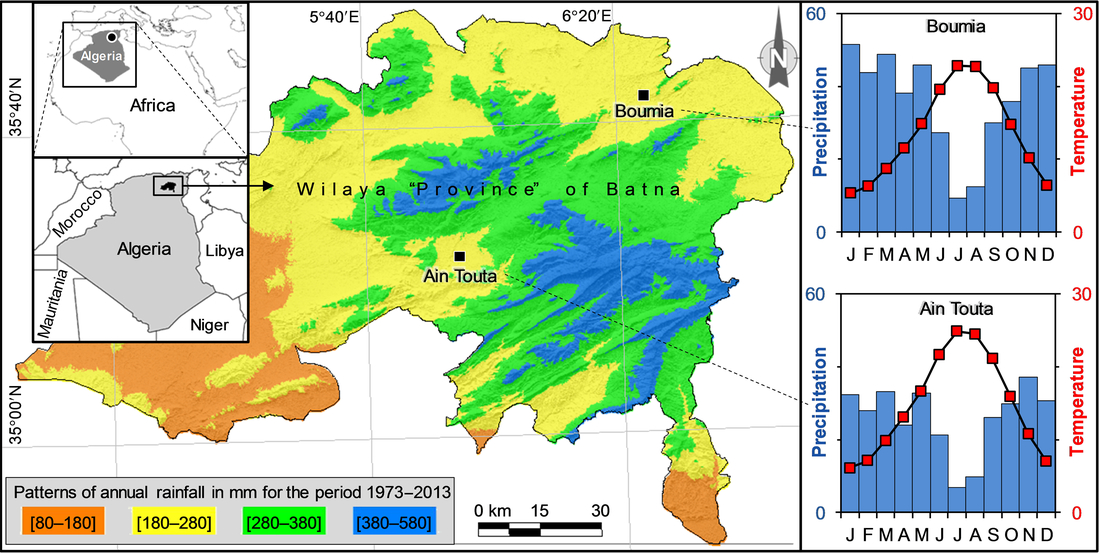
Ain Touta Station (35°24′46.3″N, 05°56′41.1″E, 909 m) is located under arid climate with cold winter (minimum temperature −0.4 °C, maximum temperature 36.1 °C, and the Emberger’s pluviothermic quotient Q 2 = 25). The study orchard (1 ha) comprised 81 trees with a height of 4–5 m and a planting density of 10 × 10 m, where Sigoise variety dominated Chemlal variety. It is surrounded by a windbreak line consisting of Cupressus sempervirens. The vegetation cover of weeds varies between 30% and 40% (Supplementary Tables 1–2). The farming mode of the orchard is traditional, that is, without any maintenance and phytosanitary treatments.
Long-term meteorological data indicate that both stations are climatologically quite similar considering Köppen’s classification that referred study stations with arid-steppe-cold climate and Budyko’s classification that classified these as desert climate, as Budyko’s radiation index of dryness was 3.482 and 4.940 in Boumia and Ain Touta, respectively. Moreover, De Martonne index equals 15 in Boumia and 12 in Ain Touta. Rainfall is irregular over the year and has large inter-annual variations; precipitations mostly occur in winter and fall, while for the rest of the year the potential evapotranspiration exceeds rainfall amount, which qualifies these areas as precipitation-limited regarding the climatic net primary production (Supplementary Tables 1–2).
Sampling methods and data collection
To identify the entomofauna of the two stations, four insect sampling methods were used during the period extending from January to May 2011, which included the spring season (March–May) when most insects were active. One sampling method used was the classical sight-hunting method used by Colas (Reference Colas1974) that consists in crisscrossing the two stations and randomly collecting, using entomological forceps, all insects that move on the ground, trees and weeds, or hide under stones and plant debris. Pitfall traps were also used to sample insects; a total of nine pots were placed on a homogeneous square plot (20 × 20 m) with a surface area of 400 m2 (Benkhelil Reference Benkhelil1992). These traps were buried at ground level and aligned on three rows with three traps per row set 5 m apart (Chenchouni et al. Reference Chenchouni, Menasria, Neffar, Chafaa, Bradai and Chaibi2015). Pots were filled with water at a third of their volume. A detergent, a powdered soap, was added to obtain a foamy liquid that dissolves the layer of lipids covering the body of caught insects and which prevent them from escaping. Insects were also sampled using yellow pan traps; a total of eight traps were installed, four fixed on tree foliage and four placed on the ground always spaced by 5 m (Benkhelil Reference Benkhelil1992). Finally, the beat sheet method was used to sample insects, by beating one branch on the four cardinal directions of the tree from top to bottom. Insects were dislodged onto the sheet, then collected and preserved. The tree-beating technique was carried out at 10 AM (Wade et al. Reference Wade, Scholz, Lloyd, Cleary, Franzmann and Zalucki2006).
Insects were sampled every two weeks in every station and with each sampling technique. In the laboratory, the collected insects were sorted, counted, and finally identified using specialised identification keys (Portevin Reference Portevin1924; Chopard Reference Chopard1943; Stary Reference Stary1979; Bouchery and Jacky Reference Bouchery and Jacky1982; Carter and Hargreves Reference Carter and Hargreves1988; Delvare and Aberlenc Reference Delvare and Aberlenc1989; Remaudiere and Seco Fernandez Reference Remaudiere and Seco Fernandez1990; Dierl and Ring Reference Dierl and Ring1992; Auber Reference Auber1999; Berland Reference Berland1999; Leclant Reference Leclant1999; Leraut Reference Leraut2007; McGavin Reference McGavin2007). The voucher specimens were deposited at the Department of Ecology and Environment (University of Batna 2, Fesdis, Batna, Algeria).
Data analysis: diversity parameters
Insect diversity in each climate region of olive orchards was evaluated by calculating: (i) the relative frequency (RF) of each insect order (RF = percentage of the number of individuals of a species on the total number N in each station); (ii) species richness (S), which represents the total number of species identified; (iii) the N/S ratio; (iv) Shannon diversity index (H): H = −Σ((n i /N) × log2(n i/N)), with ni represents the abundance of species i and N is the total number of individuals of a given sample; (v) evenness (E) with E = H/H max, where H max = log2 S (Magurran Reference Magurran2004); (vi) Simpson reciprocal index, SRI = (1/D), with D = Σ(ni (ni −1)/N(N−1)); and (vii) the SRI/S ratio, which varies between 0 and 1. Some diversity parameters (N, S, RF) were expressed at the level of taxonomic orders to facilitate comparisons with previous studies (Chenchouni Reference Chenchouni2014, Reference Chenchouni2017).
Data analysis: species accumulation curves
Using the EstimateS programme (Colwell Reference Colwell2013), the estimation of insect species richness (S est) was evaluated by applying the following estimators: Chao 2 (S Chao 2), Jackknife of the first order (S Jack 1), bootstrap, and S est (analytical). Along with rarefaction curves, the curves representing the number of singletons (species with only one individual), doubletons (species with only two individuals), unique species (species that occur in only one sample), and duplicates (species that occur in only two samples) were obtained. At each accumulation point of samples, the estimates of eight previous parameters were averaged based on 100 randomisations runs.
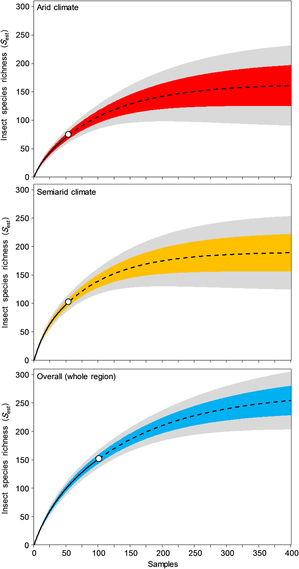
Using the data of species richness observed in each climate and for the whole region, extrapolation curves were plotted on the basis of a set of appropriate statistical sampling models. These interpolation curves estimate the cumulative-specific richness as a function of the sampling effort provided, which facilitates the comparison of different datasets collected using different sampling efforts and also to check whether the sampling effort provided to obtain these data is sufficient or not (Colwell Reference Colwell2013).
Data analysis: similarity analysis of insect communities
The similarity of species richness between the two climate regions was calculated using EstimateS (Colwell Reference Colwell2013). Comparisons of insect diversity were performed by computing classic indices of similarity, including qualitative (Jaccard and Sørensen) and quantitative indices (Morisita–Horn and Bray–Curtis) on the basis of raw data (observed abundances of insect species). In addition, similarity was determined using Chao’s abundance-based Jaccard and Sørensen indices. These indices lessen significantly the negative bias of classic similarity indices, especially in case of undersampling bias of rich communities (Chao et al. Reference Chao, Chazdon, Colwell and Shen2005; Colwell Reference Colwell2013).
Statistical analysis
The normality of the abundance data was verified with the Shapiro–Wilk test, then a nonparametric Kruskal–Wallis test (χ2 ) was applied to test the variation in species abundances between the two climates of olive orchards. Using sample-based data, the variation of insect diversity parameters between climates was tested using generalised linear models with different distribution errors and link functions (family = Poisson and link = log for N and S; family = Gaussian and link = identity for N/S ratio, H′, H max, SRI; family = quasibinomial and link = logit for E and SRI/S ratio). The relationships between insect diversity parameters were verified using Pearson correlation tests for each climate and for the whole region. Correlation matrices were plotted using the corrplot package in R (R Core Team 2016). The Mantel permutation test was applied to examine the similarity of correlation patterns between correlation matrices of arid and semiarid climates. All statistical analyses were carried out in R version 3.3.0 (R Core Team 2016).
Results
Taxonomic list and abundances of insect species
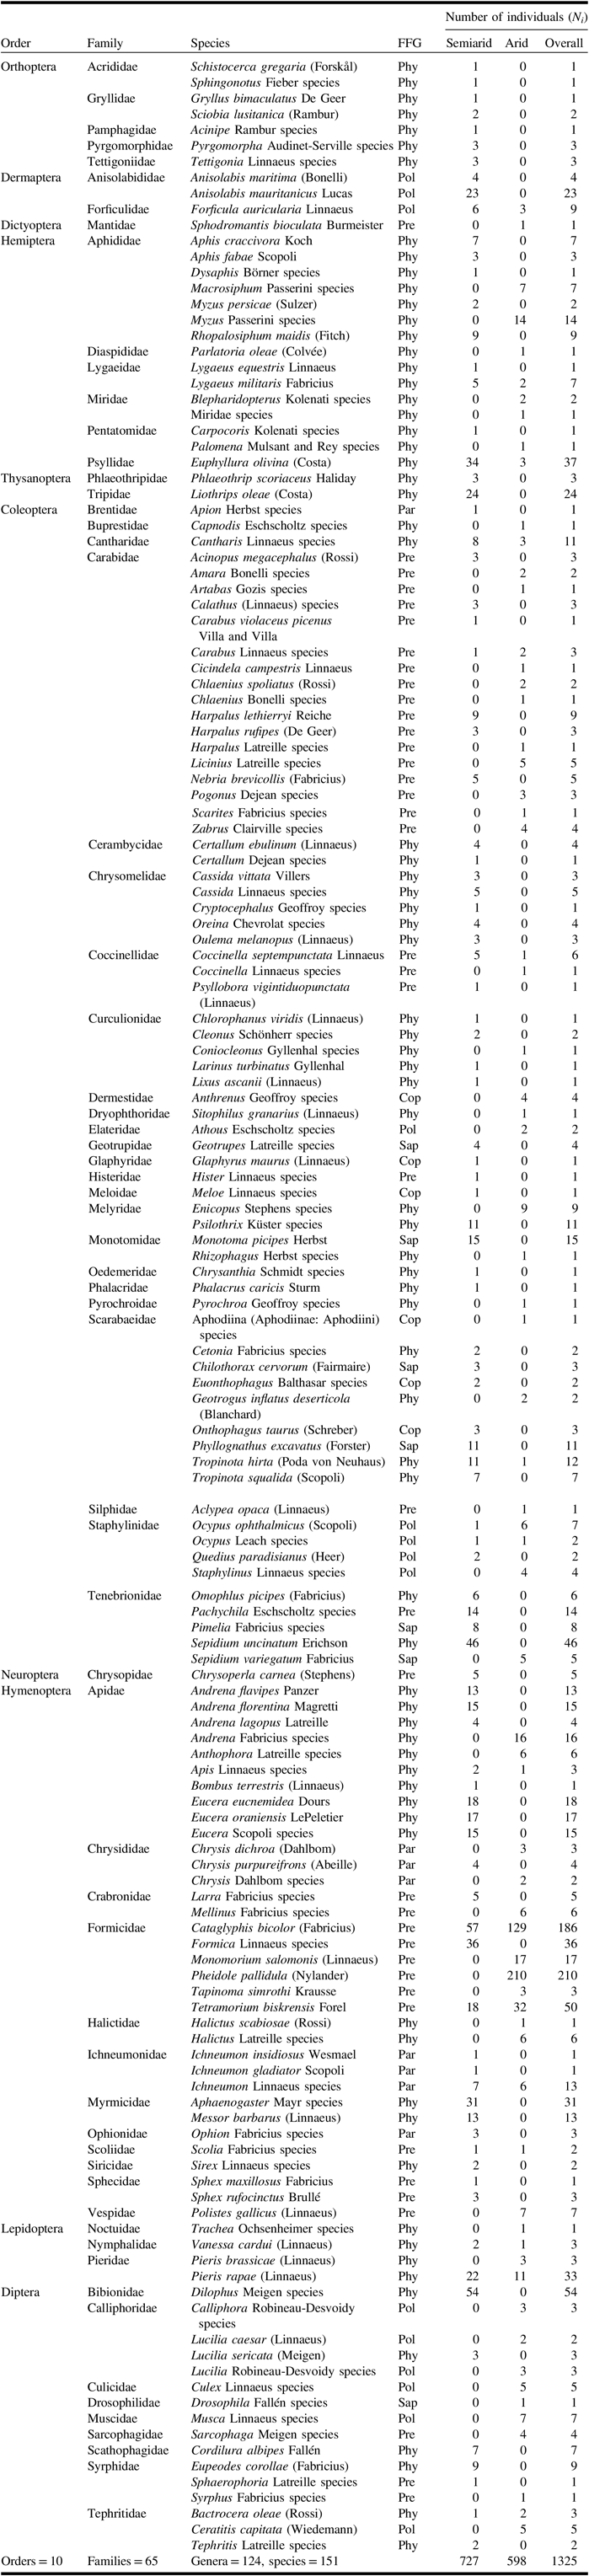
The analysis of the taxonomic composition of the species identified in the study area revealed the presence of 151 species from 1326 individuals in 10 orders, 65 families, and 124 genera. In the semiarid olive grove (Boumia Station), the 98 species belong to nine orders, whereas in the arid olive grove (Ain Touta Station), insects included 70 species in seven orders (Table 1). The Kruskal–Wallis test showed a highly significant relationship between insect abundances of the two climates (χ2 = 12.13, P < 0.001).
Systematic list, functional feeding group, and the number of individuals of insects recorded in olive groves located at semiarid (Boumia) and arid (Ain Touta) climates in the region of Batna, northeastern Algeria.

FFG, functional feeding group; Cop, coprophagous species; Par, parasitic species; Phy, phytophagous species; Pol, polyphagous species; Pre, predatory species; Sap, saprophagous species.
Relative frequency
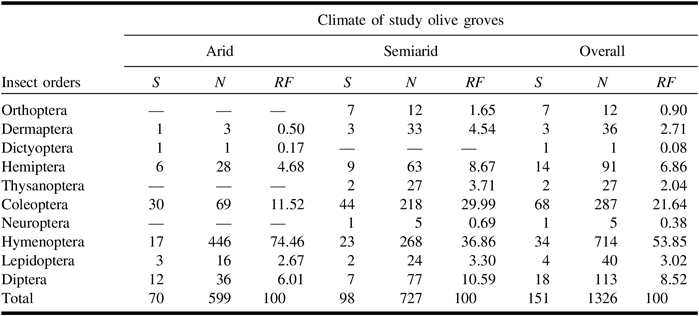
Insect orders with high capture frequency were Hymenoptera (36.9%), Coleoptera (30%), and Diptera (10.7%) in the semiarid climate; and Hymenoptera (74.5%), Coleoptera (11.5%), and Diptera (6.3%) in the arid olive grove. The abundance of other orders was < 5% in both climates of olive groves (Table 2). Overall, there was no difference in the frequency of abundance, as shown by the non-significant variation in abundances between climates (Kruskal–Wallis test, P > 0.05).
Summarisation of species richness (S), number of individuals (N), and relative frequency (RF in %) for insect orders recorded in olive groves located at semiarid and arid climates in northeastern Algeria.

Variation of insect diversity parameters
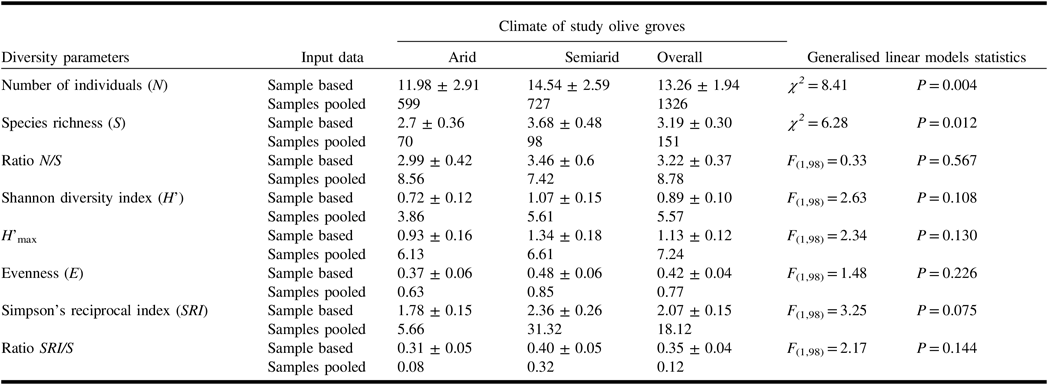
Overall, the diversity parameters recorded in the olive grove grown under the semiarid climate were higher than that in the arid climate. The number of insect species caught under semiarid climate was higher (98 species with an average of 3.68 ± 0.48 species per sample) than arid climate (70 species with an average of 2.7 ± 0.36 per sample). The generalised linear models revealed that species richness varied significantly between the two climatic zones (χ2 = 6.28, P = 0.012). Similarly, the number of individuals caught per sample was significantly different (χ2 = 8.41, P = 0.004) between climates (Table 3). The values of Shannon diversity index and evenness were greater in olive groves of semiarid climate (H′ = 5.61, E = 0.85) compared with arid climate (H′ = 3.86, E = 0.63). However, the average number of individuals per species (ratio N/S) was higher in arid climate (8.56) compared with semiarid climate (7.42). In addition, the values of Simpson reciprocal index (SRI) and SRI/S were lower in arid climate compared with semiarid climate. The generalised linear models indicated that the rest of diversity parameters have no significant variation (P > 0.05) between climatic zones.
Variation of diversity indices of insect communities sampled in olive orchards located in arid and semiarid lands of northeastern Algeria.

Poisson (type-II likelihood ratio test χ2 ) and Gaussian and quasibinomial generalised linear models (type-II F-test) tested the variation between climates using sample-based data of each biodiversity parameter.
Relationships between diversity parameters
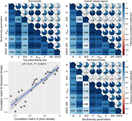
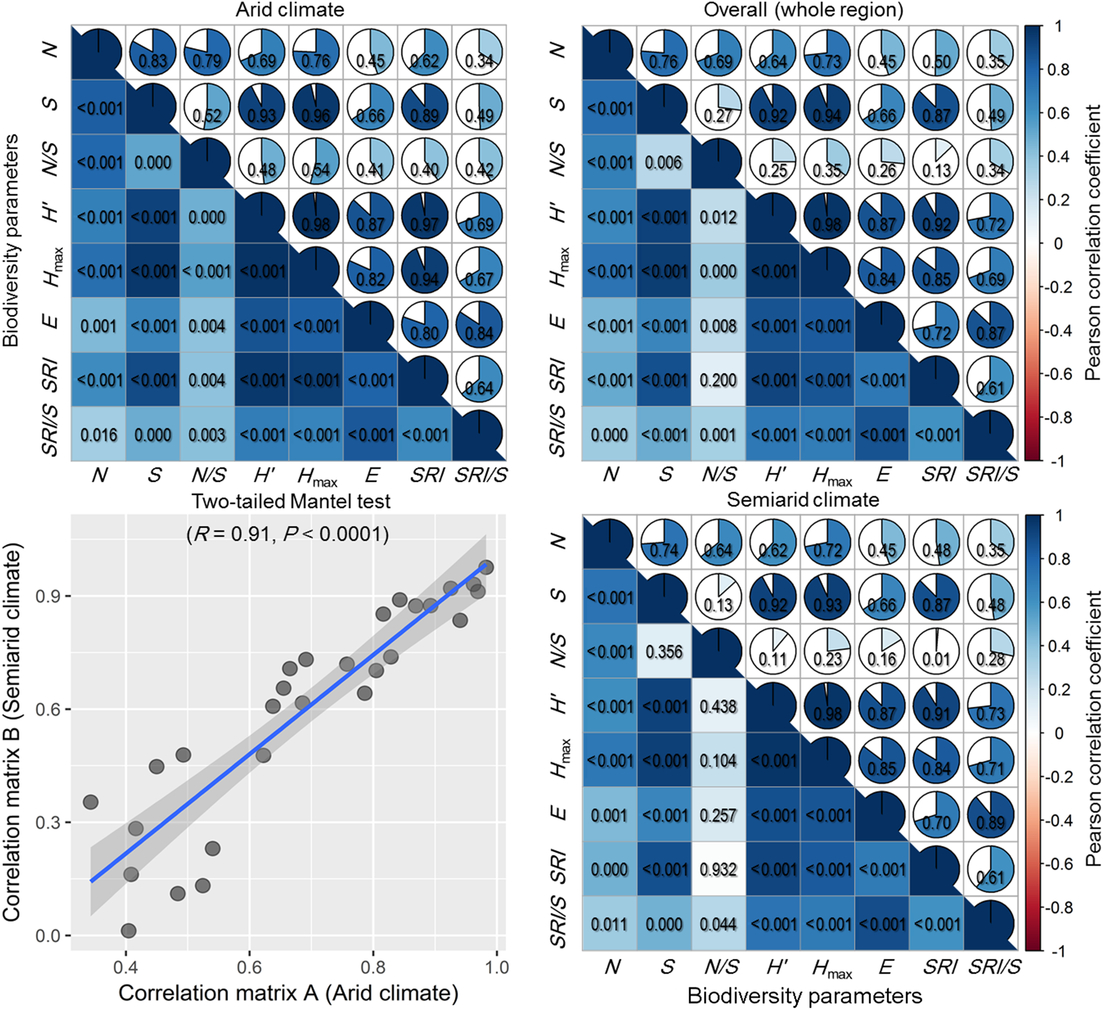
All insect diversity parameters were positively correlated regardless of orchard climate. These correlations were all significant (P < 0.05) in the arid climate orchard and the whole area, except in the latter case for the correlation between SRI and N/S. This last parameter was not significantly correlated in semiarid climate with N and SRI/S, while the rest of the correlations were significant (Fig. 2). Despite this slight difference in correlated parameters between the two climates, the Mantel permutation test showed that the patterns of correlation matrices of the two climates were very similar (r = 0.91, P < 0.0001).
Correlation matrices displaying correlations between diversity parameters of insects subservient to olive groves located under arid climate (top-left matrix), semiarid climate (bottom-right matrix), and the whole region in northeastern Algeria (top-right matrix). Relationship between arid and semiarid correlation matrices is tested using a two-tailed Mantel test (bottom-left plot). Pearson correlation tests are given as correlation coefficients (shown by colour and intensity of shading in squares and pie charts and values above diagonal) and P-values (under diagonal). See the data analysis section for the abbreviations of diversity parameters.
Functional diversity
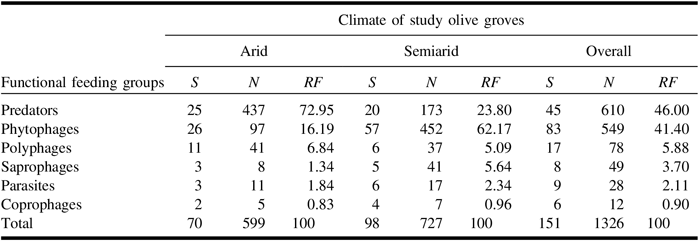
In the semiarid climate of olive groves, phytophagous then predatory insects were the most captured with 452 and 173 individuals, respectively. Whereas in the arid climate, predators were the most captured with 437 individuals, then came phytophagous insects with 97 individuals (Table 3). In terms of the number of species, phytophagous insects were the most abundant with a total of 83 species, including 57 species for the semiarid climate and 26 species for the arid climate. As for predators, species richness was 20 species in olive grove with semiarid climate and 25 species in arid climate. The other functional groups have low numbers and richness (Table 4).
Species richness (S), number of individuals (N), and relative frequency (RF in %) for the functional feeding groups of insects captured in olive groves located at semiarid and arid climates in northeastern Algeria.

Insect species estimations
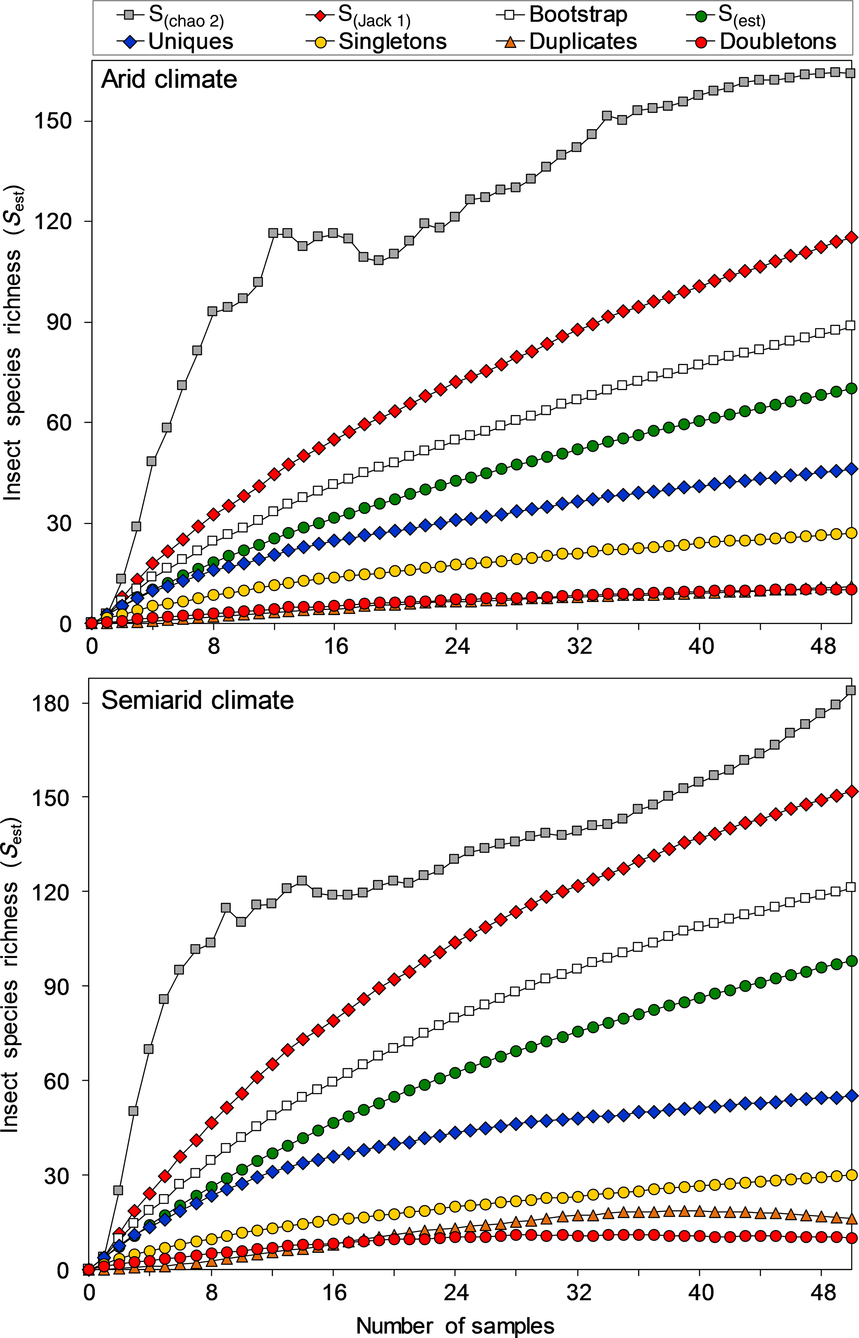
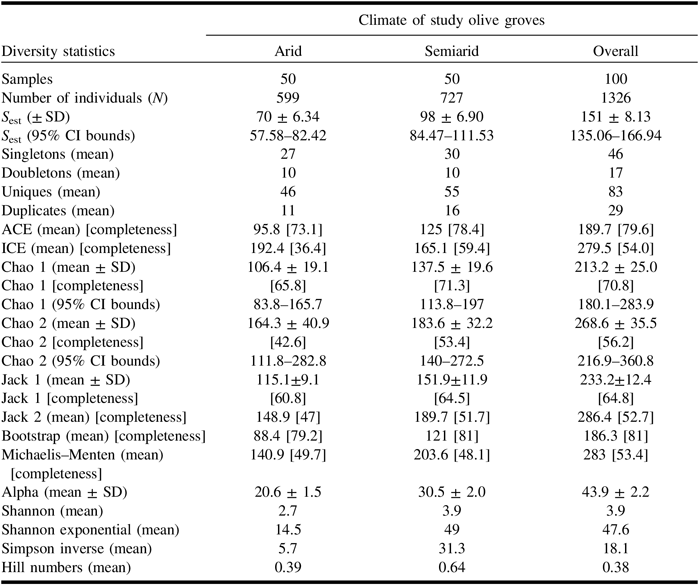
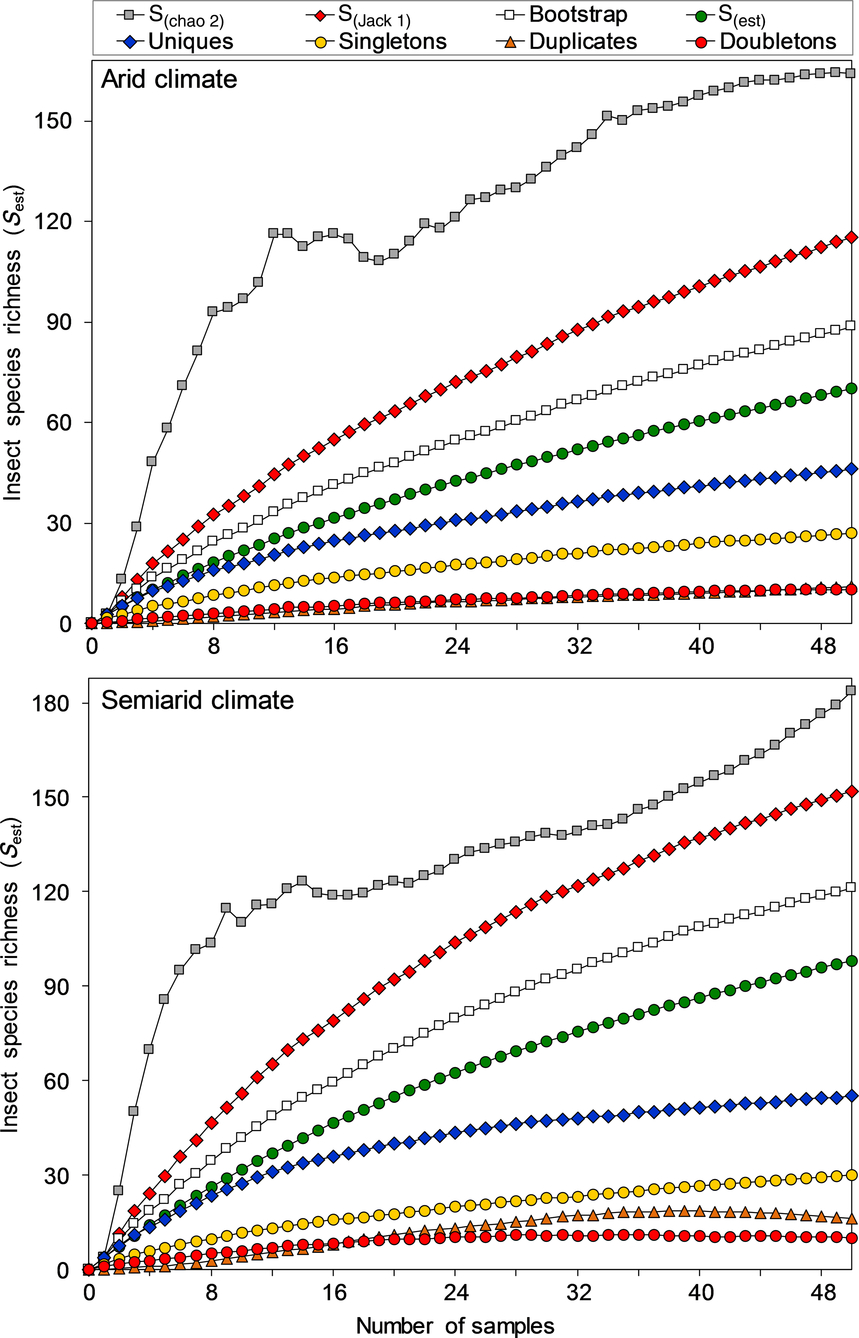
Rarefaction curves indicated a significant increase in the number of species estimated with different species richness estimators applied. Regardless of climate type, the curves of all species richness estimators had not reached a plateau, but they tended to stabilise with a slight leaning. This is due to the continuous appearance, with high number of surveys, of rare and scarce insects as indicated by the curves of uniques, duplicates, singletons, and doubletons (Fig. 3). Although rarefaction values were higher in olive groves planted in semiarid climate compared with arid climate, the completeness rate of species richness obtained with all the estimators was higher in arid olive groves. The shapes of species accumulation curves estimated using non-parametric incidence estimators Chao 2, first-order jackknife (jack 1), and bootstrap were quite similar between the two climates. Chao 2 estimator showed the highest values of species richness estimated with 164.3 ± 40.9 species in arid climate, 183.6 ± 32.2 species in arid climate, and 268.6 ± 35.5 species for the whole, which correspond to a completeness level of 42.6%, 55%, and 53.4%, respectively. The number of insect species estimated by the jack 1 estimator was 115.1 ± 9.1 in arid climate and 151.9 ± 11.9 in semiarid climate, with an inventory completeness of 60.8% and 64.5%, respectively. The bootstrap estimator particularly revealed a higher lower richness compared to the two previous estimators, where the estimated richness complemented the observed richness with 79.2% in arid climate and 81% in both semiarid climate and for the whole region (Fig. 3, Table 5).
Sample-based rarefaction curves obtained from four asymptotic species richness estimators (Chao 2 “S (Chao 2),” first-order jackknife “S (Jack 1),” boostrap, and analytical “S (est)”) applied for the diversity of insects subservient to olive groves grown at semiarid and arid climates in northeastern Algeria.
Total estimates of species richness and diversity indices of insect communities subservient to olive groves grown under semiarid and arid climates in northeastern Algeria.

Species richness estimators and diversity statistics are given, when applicable, as mean, standard deviation (SD), lower and upper bounds of 95% confidence intervals (CI) based on 100 randomisation runs. Values expressed in brackets are inventory completeness of observed richness as a percentage of total expected richness according to the corresponding estimator. ACE, abundance coverage-based estimator; ICE, incidence coverage-based estimator. See Colwell (Reference Colwell2013) for a full explanation of diversity indices and statistics.
Insect species richness extrapolation
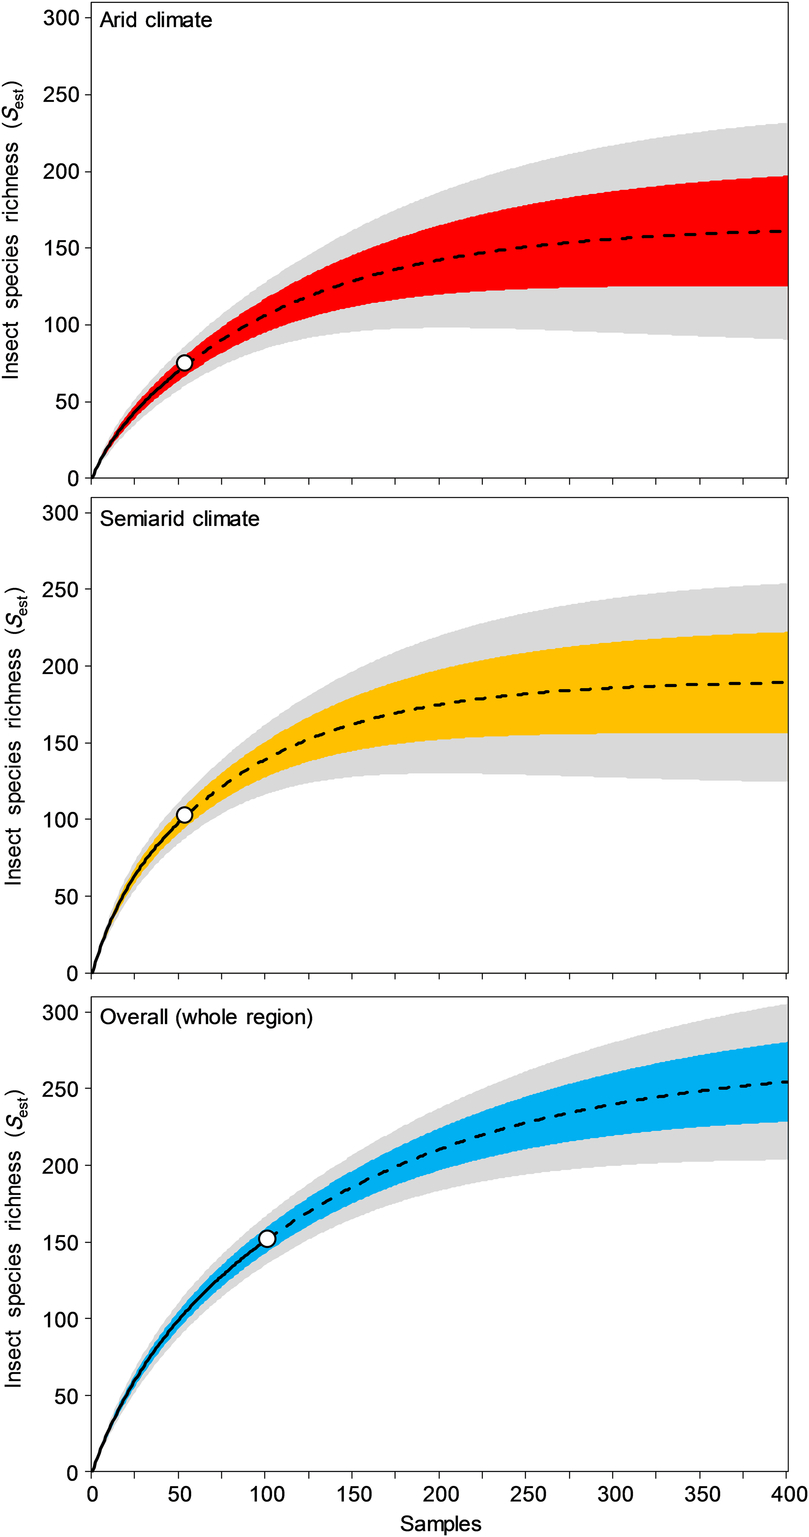
The estimated species richness of insects, S (est), continued to increase as the number of samples increased for all rarefaction curves of climatic regions (arid and semiarid climates and overall). When we increase the number of samples to 400 (four times the reference sample size), the equivalent of four years of insect sampling during the period of maximum activity, S (est) is expected to increase by 130.1%, reaching 161.1 ± 36.1 species for a total of 4792 individuals in olive groves grown under arid climate. Also, S (est) is predicted to reach up 189.2 ± 33 species (an increase of 93.1%) representing a total of 5816 individuals for olive groves planted in semiarid climate. For all groves of the region, insect species richness is expected to reach 254.3 ± 26, the equivalent of an increase of 68.4%, for a total of 5304 individuals (Fig. 4).
Sample-based rarefaction (solid line) and extrapolation (dashed line) curves of species richness estimated for insect communities of olive groves grown under arid and semiarid climates in northeastern Algeria. White solid circles indicate reference samples. Light grey-shaded areas represent lower and upper bounds of 95% confidence intervals for S (est). Colour-shaded areas indicate ± standard deviations.
Similarity analysis
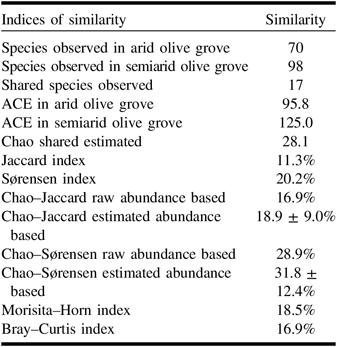
With 17 shared species between the two bioclimatic regions, the calculation of qualitative coefficients of similarity revealed low similarities with 11.3% and 20.2% for the Jaccard and Sørensen indices, respectively. According to abundance-based similarity indices of observed richness, the resemblance between orchards was 16.9% according to Bray–Curtis and Chao–Jaccard indices, 18.5% following Morisita–Horn coefficient, and 28.9% based on Chao–Sørensen index. The similarity calculated based on estimated species richness in the two orchards was 18.9 ± 9% according to Chao–Jaccard index and reached up to 31.8 ± 12.4% according to Chao–Sørensen index (Table 6). All these low similarity values may be related to differences in climatic conditions and understorey vegetation between orchards.
Qualitative and quantitative similarity estimates between insect communities of olive groves grown in arid and semiarid climates of northeastern Algeria.

ACE, abundance coverage-based estimator.
Discussion
The census of insects we established in the two climates of olive groves encompasses a substantial species richness of insects distributed over 10 orders, 65 families, and 124 genera. Olive groves grown under semiarid climate are more diverse with 98 species compared with arid climate (70 species). In terms of abundances, the orders of Coleoptera and Hymenoptera largely dominated the other orders in the two climates, while Dermaptera, Diptera, Hemiptera, Lepidoptera, and Orthoptera are widely present with individuals caught varying from one station to another. These particular diversity and abundance patterns of insect orders may be explained as the beetles represent the most important order in the animal kingdom with over 400 000 species described to date, which represent about 40% of global insects (Chatenet Reference Chatenet1990; Orgeas and Ponel Reference Orgeas and Ponel2001; Chenchouni et al. Reference Chenchouni, Menasria, Neffar, Chafaa, Bradai and Chaibi2015). It is also important to note the outstanding diversity of beetle forms and ecological niches (Auber Reference Auber1945; Floate et al. Reference Floate, Doane and Gillott1990; Auber Reference Auber1999; Kromp Reference Kromp1999). Due to the ease of their trapping, sampling, and conservation (Perrier Reference Perrier1927; Barney and Pass Reference Barney and Pass1986), as well the diverse functional and ecological roles (Chenchouni et al. Reference Chenchouni, Menasria, Neffar, Chafaa, Bradai and Chaibi2015), it is not surprising that beetles attracted a lot of scientific interest.
The analysis of relative frequencies of different orders and insect species showed that Hymenoptera (53.85%) then Coleoptera (21.64%) represent the most abundant orders in both arid and semiarid olive groves. Hymenoptera are important in terms of abundance in the arid area as they find ideal ecological conditions to thrive. Hymenoptera (sawflies, wasps, ants, bees) includes phytophages, pollinators, and a large share of entomophages playing a central role in maintaining natural balances. Entomophages comprise mostly parasitoids (53% of the species of Hymenoptera described) but also predators; therefore, their importance for biological control is unquestionable. Moreover, Coleoptera and Hymenoptera pollinate most plants and thus play a role in the productivity and stability of ecosystems and agrosystems (Price et al. Reference Price, Denno, Eubanks, Finke and Kaplan2011). Coleoptera constitute a food resource for various secondary consumers in the food webs (Chenchouni Reference Chenchouni2014, Reference Chenchouni2017); also certain species are considered good indicators of the biodiversity and health of both agricultural and natural ecosystems (Kromp Reference Kromp1999; Orgeas and Ponel Reference Orgeas and Ponel2001; Sánchez-Fernández et al. Reference Sánchez-Fernández, Abellán, Mellado, Velasco and Millán2006; Chenchouni Reference Chenchouni2007). This is specifically true because of their high sensitivity to changes in their habitats; thus they constitute a model of choice to evaluate the species richness of disturbed environments (Haddad et al. Reference Haddad, Crutsinger, Gross, Haarstad, Knops and Tilman2009).
The differences in species richness and composition between the two climates of olive groves can be explained by the effects of local climate factors, which affect plant composition and vegetation cover especially at the understorey where herbaceous plants abundantly develop in semiarid climate compared with arid climate. The presence of the herbaceous layer attracts more phytophagous and pollinating insects mainly during the spring (Chenchouni et al. Reference Chenchouni, Menasria, Neffar, Chafaa, Bradai and Chaibi2015). These anthophilous species in general and honey bees (Apis mellifera Linnaeus (Hymenoptera: Apidae)) in particular increase fruit or seed yields of several plant species through the pollination of flowers during their foraging activities (Fohouo et al. Reference Fohouo, Djonwangwé, Messi and Brückner2007).
The computed Shannon diversity index indicated that the semiarid olive groves are home to more abundant and diverse insect communities compared with orchards grown under arid climate. While evenness values varied between 0.63 in arid climate and 0.85 in semiarid climate, this indicates a certain balance between insect populations, mainly those sampled in semiarid groves.
Patterns of species diversity in functional trophic groups revealed that phytophagous insects occupy the first place in terms of the number of species and number of individuals in olive groves planted under semiarid climate (S = 57 species, N = 452 individuals), whereas arid groves recoded S = 26 species and N = 97 individuals; these are followed by predators (S = 20 species, N = 173 individuals and S = 25 species, N = 437 individuals, respectively) and then polyphagous insects (S = 6 species, N = 37 individuals and S = 11 species, N = 41 individuals, respectively). According to Novotny et al. (Reference Novotny, Miller, Baje, Balagawi, Basset and Cizek2010) and Forister et al. (Reference Forister, Dyer, Singer, Stireman and Lill2012), there is no absolute trophic specialisation of species in nature; thus, the distribution of functional feeding group diversity parameters takes into account the type of diet of adult states. The dominance of phytophagous insects in the groves studied in semiarid climate can be explained by the high specific diversity of herbaceous plants of olive grove understorey that offer abundant food resources to this category where ecological conditions are relatively more favourable compared with arid climate. Besides, plant diversity is a key factor that influences the variation of population dynamics and insect diversity (Chenchouni et al. Reference Chenchouni, Menasria, Neffar, Chafaa, Bradai and Chaibi2015). Moreover, climatic factors determine the trends of population dynamics and number of generations of many pest insects of agricultural importance in drylands (Chafaa et al. Reference Chafaa, Biche, Chenchouni, Sellami and Sibachir2013b; Idder-Ighili et al. Reference Idder-Ighili, Idder, Doumandji-Mitiche and Chenchouni2015). Thus, under severe ecological conditions as in an arid climate, low plant diversity (Bradai et al. Reference Bradai, Bouallala, Bouziane, Zaoui, Neffar and Chenchouni2015) decreases arthropod diversity and shifts the trophic structure (Haddad et al. Reference Haddad, Crutsinger, Gross, Haarstad, Knops and Tilman2009).
In the entire region, predators are the second most diverse group after phytophagous insects, but these dominate in semiarid environment. Predators have an important role in the agrosystems by limiting the numbers of certain populations of insect pests. The abundance of predatory species may be explained, on the one hand, by a high plant diversity that increases the diversity of prey and, on the other hand, the agricultural practice and management of the two olive groves. In fact, the two stations are not subject to any phytosanitary treatment. According to Bommarco et al. (Reference Bommarco, Kleijn and Potts2013), the massive use of synthetic pesticides has major negative effects at different ecological levels in the agroecosystem. Among these impacts are the disappearance of many animal species with key functional roles and the serious disturbance of food webs. The abundance and diversity of predators in olive orchards grown in semiarid climate also testifies the abundance of their prey, but the reduction of phytophagous insects under the same climatic conditions can be explained by a desynchronisation between phytophagous populations, on the one hand, which are early and coincide with late winter season, and, on the other hand, adult emergence of predatory populations that depend on phytophagous species and whose abundances reach the maximum a little later, during the period from early to mid-spring.
Conclusion
The taxonomic inventory of the entomofauna that we have established shows that the olive groves cultivated in two northern African climates have a fairly large species richness. High diversity is noted in the distribution of insect species according to the climate of olive groves. The most important functional feeding groups in this study are phytophages and predators. Among the phytophagous insects we have recorded, and which are considered serious pests in the cultivation of olive, are Bactrocera oleae, Parlatoria oleae, Euphyllura olivina, and Liothrips oleae. It is obvious that climatic factors, especially temperature and precipitation, and their seasonal changes play a very important role in the distribution, activity, and behaviour of insect populations subservient to olive orchards. These findings represent a basic tool for guiding prevention and control programmes against the main pests of olive tree.
Supplementary material
To view supplementary material for this article, please visit https://doi.org/10.4039/tce.2019.35.
Author contributions
S.C. conceived the study, conducted the field work, and collected data. H.C. and S.C. analysed the data. S.C. and H.C. wrote the manuscript. All authors (S.C., F.M., and H.C.) contributed critically to the drafts and gave final approval for publication.
Competing interests
The authors declare that they have no competing interests.
Availability of data and materials
The datasets used and/or analysed during the current study are available from the corresponding author on reasonable request.
Author ORCIDs
Smail Chafaa, 0000-0002-9861-0768.
Fateh Mimeche, 0000-0002-9135-6760.
Haroun Chenchouni, 0000-0001-9077-2706.