INTRODUCTION
For many years there has been considerable interest in improving the utilization of non-protein nitrogen (NPN) in ruminant diets. Two approaches have been taken: optimizing urea utilization (Burroughs et al. Reference Burroughs, Nelson and Mertens1975; Satter & Roffler Reference Satter and Roffler1975) and the search for NPN products with improved nitrogen (N) utilization (Broome Reference Broome, Swan and Lewis1968; Rohlf Reference Rohlf1974). For the latter, one approach has been the use of urea condensation products such as biuret, triuret and cyanuric acid as NPN sources (Clark et al. Reference Clark, Barratt and Kellerman1965); however, in China the only products of urea authorized to be applied as a dietary NPN source for ruminants are biuret, iso-butyl diurea, urea phosphate, hydroxymethyl urea, ammonium sulphate, ammonium bicarbonate, diammonium phosphate and ammonium dihydrogen phosphate. Another N condensation product that has received much attention is melamine, due to the notorious epidemic of melamine poisoning stemming from tainted infant formula in China in 2008 (Chen Reference Chen and Chen2007; USFDA 2008). Newton & Utley (Reference Newton and Utley1978) noted that, in an in vitro rumen ammonia release trial, inoculation of cottonseed meal, melamine, urea or a melamine-free ration with rumen fluids from cows that had been fed the rations containing either cottonseed meal or melamine resulted in slow hydrolysation of melamine. After the discovery of melamine contamination in pet food, a detection method involving liquid chromatography–mass spectrometry became widely available that identifies both cyanuric acid and melamine reliably (Turnipseed et al. Reference Turnipseed, Casey, Nochetto and Heller2008). The Central People's Government of the People's Republic of China (CPGPRC 2008, 2009) set the maximum level for infant formula powder, milk products and animal feeds at 1, 2·5 and 2·5 mg/kg, respectively. Although melamine and related chemicals have known toxic effects to humans and animals (Brown et al. Reference Brown, Jeong, Poppenga, Puschner, Miller, Ellis, Kang, Sum, Cistola and Brown2007; Ingelfinger Reference Ingelfinger2008; Shen et al. Reference Shen, Wang, Wei, Bu, Sun and Zhou2010), the amount leading to adverse effects may depend on the exposure dosage. In addition, differences in the forage:concentrate ratio in feed may mask the actual adverse effects of melamine on ruminal fermentation, which is known to be an important microbial digestion function in ruminants. Documented research results pertaining to melamine in rumen fermentation are still limited. Under the controlled conditions of an in vitro experiment, the objective of the current study was to determine the adverse effects of dietary melamine at different doses on in vitro rumen microbial growth, methane (CH4) production and fermentation of diets consisting of a mixture of Chinese wild rye hay and maize meal.
MATERIALS AND METHODS
Feedstuffs and melamine
Chinese wild rye (Leymus chinensis), grown in Baicheng, Jinlin province of China, was harvested at the late-bloom stage and chopped into 2–5 mm lengths. The grass was oven-dried and ground in a Wiley mill to pass through a 1 mm screen. Maize (Zea mays) grains were ground in the same way. The hay and maize meal were mixed in the ratios of 0·2 : 0·8 and 0·8 : 0·2 (wt/wt) to give a low-forage diet (LF) and a high-forage diet (HF), respectively. The melamine (1,3,5-triazine-2,4,6-triamine; C3H6N6; mw=126·13) powder was obtained from Sinopharm Chemical Reagent Co., Ltd. (Beijing, China); the white powder was easily soluble in water. Melamine content was above 995 g/kg, with a melting point of >300 °C and solubility in water of >320 g/l.
Experimental design
A completely randomized block design was applied to four runs of in vitro batch cultures with the two diets (LF v. HF) and seven melamine dose rates (0 (control), 2, 6, 18, 54, 162 and 486 mg/kg of the diets). Within each diet, four replicate fermentations were arranged per run for each melamine dosage treatment, in which two replicates were conducted in an automated gas production recording system (AGRS) as described by Zhang & Yang (Reference Zhang and Yang2011) to continuously record gas production (GP), and the other two were carried out in a manually operated incubation system to collect all fermentation gases for later analysis of CO2, CH4 and hydrogen (H2). Three fermentations without the substrate and melamine dose were included in each run as blanks and, if necessary, to correct for variation between the runs caused by differences in rumen fluid inoculum from different periods. After 72 h, the incubation was stopped: all culture fluids were sampled and pH, ammonia N, microbial N yield and volatile fatty acid (VFA) concentrations determined.
Rumen fluid collection
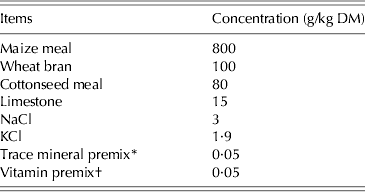
Three Simmental×Luxi crossbred beef bulls, weighing 348±20 kg and fitted with cannulas (Type 2C: Bar Diamond Inc., Parma, Idaho, USA), served as donor animals for rumen fluid collection. The animals were housed in an enclosed barn in individual tie stalls (1·5×2·5 m) and had free access to water. A 10-kg total mixed ration was fed twice daily at 07·00 and 19·00 h and consisted of 600 g Chinese wild rye hay/kg and 400 g concentrate/kg (Table 1). The ration was formulated to meet the nutrient requirements (China Standard NY/T 815 2004) of beef cattle weighing 350 kg with a 0·5 kg daily body weight gain and contained 140 g crude protein (CP)/kg, 75 g calcium/kg and 34 g phosphorus/kg as fed. The rumen fluid, collected from each animal 1 h before the morning feeding, was filtered through four layers of cheesecloth. The filtered rumen fluids from the three animals were mixed in equal proportions to obtain a representative rumen fluid sample from the cows fed the same diet, held in an atmosphere of carbon dioxide (CO2) in a water-bath at 39 °C and used later for in vitro batch culture. All animal care, surgical procedures and rumen fluid collection were approved by the Institutional Animal Care and Use Committee at China Agricultural University.
Composition of concentrate fed to beef bulls served as donors of rumen fluid
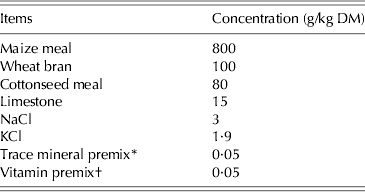
* Contained Cu 30·0 g/kg, Fe 50·0 g/kg, Zn 5·4 g/kg, Mn 180·0 g/kg, Se 1·5 g/kg, I 2·8 g/kg, and Co 5·0 g/kg.
† Contained vitamin A 50·0 kIU/kg, vitamin D 4·8 kIU/kg and vitamin E 2·0 kIU/kg.
In vitro batch cultures and sampling
Five hundred mg of each diet was weighed into a total of 224 glass bottles (two diets×seven melamine doses×four fermentations×four runs) with butyl rubber stoppers and Hungate's screw caps, and the whole batch culture was completed in four runs. Prior to each run of the batch culture, a buffer solution (pH 6·8) was freshly prepared as described by Menke & Steingass (Reference Menke and Steingass1988), and a high-melamine working solution was prepared by dissolving 243 mg of the melamine powder into 1·0 litre of the buffer solution. The melamine solution was then diluted 3, 9, 27, 81 and 243 times with the same buffer solution, resulting in 81, 27, 9, 3, 1 mg/l melamine working solutions.
In each run, 56 bottles (two diets×seven melamine doses × four fermentations) from among the 224 bottles containing 25 ml of filtered rumen fluids collected from the cows and 49 ml of the freshly prepared buffer solution were taken and either 1 ml of the melamine working solution or 1 ml of the freshly prepared buffer solution was added, resulting in the tested dose treatments of 0 (control), 2, 6, 18, 54, 162 and 486 mg melamine/kg diet under a stream of nitrogen gas (N2). From these 56 bottles, two per treatment were purged with anaerobic N2 for 5 s, sealed with butyl rubber stoppers and Hungate screw caps and individually connected with medical plastic infusion pipes to AGRS gas inlets. Meanwhile, another two bottles per treatment were purged with anaerobic N2 for 5 s, sealed with butyl rubber stoppers and Hungate screw caps and individually connected to three pre-emptied air bags to collect whole fermentation gases. All bottles were incubated at 39 °C for 72 h.
After each 72 h of incubation, the cumulative GP volumes v. incubation time were exported into a Microsoft Excel datasheet from AGRS and three 1·0 ml gas samples in the manually operated incubation system were taken by syringes from the air bags for immediate analysis. The entire biomass cultures (75 ml) in all bottles were individually moved to 100 ml falcon tubes and centrifuged at 3500 g for 15 min at 4 °C. The pH in the supernatants was measured immediately. An aliquot of supernatant (5 ml) was transferred to a polypropylene tube and frozen at −20 °C for microbial N analysis. A second aliquot of supernatant (5 ml) was transferred to polypropylene tube containing 0·5 ml of 50 g/l H3PO4 and frozen at −20 °C for ammonia N analysis. A third aliquot (1 ml) was transferred to a polypropylene microtube containing 0·3 ml of 250 g/l orthophosphoric acid solution. The mixture was cooled at 4 °C for 2 h, centrifuged at 15 000 g for 10 min at 4 °C and the supernatant frozen at −20 °C for VFA analysis.
Analytical procedures
Representative samples of hay and maize meal, oven-dried at 65 °C for 48 h, were analysed following AOAC (1999) for dry matter (DM, ID 930·5), CP (ID 984·13), and organic matter (OM) by ashing at 550 °C for 6 h in a muffle furnace. Both neutral detergent fibre (NDF) and acid detergent fibre (ADF) were analysed following the methods of Van Soest et al. (Reference Van Soest, Robertson and Lewis1991) and corrected for residual ash content. The pH of the supernatants was determined immediately after removal using a pH meter (Model pHs-29A, Jingke Leici Co. Ltd, Shanghai, China). Ammonia N concentration in the supernatants was measured at 660 nm following a spectrophotometric method described by Verdouw et al. (Reference Verdouw, Van Echteld and Dekkers1978). Concentrations of the microbial N were determined based on purines using the method of Zinn & Owen (Reference Zinn and Owen1986) modified by Makkar & Becker (Reference Makkar and Becker1999). Microbial N was estimated from the ratio of purines to N of isolated bacteria. Yeast RNA was used as a standard. The concentrations of acetate, propionate, butyrate, valerate, iso-butyrate and iso-valerate in the supernatants were measured by a flame ionization detector in a gas chromatograph (GC522, Wufeng Instruments, Shanghai, China) using a 15 m semi-capillary glass column (φ 0·53 mm) packed with chromosorb 101, with N2 as carrier gas at a column temperature of 120 °C. The temperature of the injector oven, column oven and detector were 250, 120 and 250 °C, respectively. Before analysis, caproic acid was added to each sample as an internal standard. Following the method of Zhang & Yang (Reference Zhang and Yang2011), the concentrations of CH4, CO2 and H2 were measured in a 1 ml gas sample by gas chromatography using a 2 m stainless steel column (2·0 mm inner diameter) packed with TDX-1. The temperature of the injector oven, column oven and detector were 120, 80 and 200 °C, respectively. Pure N2 was used as carrier gas, and peaks were identified by comparison with a standard of known composition.
Biometric analyses
The cumulative gas production (GPt, ml/g DM) at time (t) for each fermentation bottle was fitted to an exponential model (Eqn (1)) by iterative regression analysis (France et al. Reference France, Dijkstra, Dhanoa, López and Bannink2000) using the nonlinear procedure of SAS (1999):
 $${\rm GP}_{\rm t} = A'[1 - {e}^{ - c'(t - Lag)} ] $$
where ‘e’ is the base of a natural logarithm; the parameter A represents the asymptotic GP generated at a constant fractional rate (c) per unit time; t is the gas recording time, and Lag represents a lag time phase before GP commenced.
Following the method of García-Martínez et al. (Reference García-Martínez, Ranilla, Tejido and Carro2005), the average GP rate was defined as the average gas production rate (AGPR, ml/h) between the start of the incubation and the time at which the cumulative GP was half of its asymptotic value, and was calculated as:
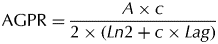 $${\rm AGPR} = \displaystyle{{A \times c} \over {2 \times (Ln2 + c \times Lag)}}$$
The sum of the analysed CH4, CO2 and H2 was calculated as the total gas produced in molar proportion (mol/100 mol), which excluded N2, residual O2 and water vapour in the head space gas of each bottle. Finally, molar proportions of CH4, CO2 and H2 in total GP were calculated prior to statistical analysis. Iso-butyrate and iso-valerate were summed as branched-chain volatile fatty acids (BCVFA). The ratio of non-glucogenic to glucogenic acids (NGR) was calculated according to Ørskov (Reference Ørskov and Bourne1975) as:
 $${\rm NGR} = \displaystyle{{{\rm Acetate} + 2 \times {\rm Butyrate} + {\rm Valerate}} \over {{\rm Propionate} + {\rm Valerate}}}$$
where acetate, propionate, butyrate and valerate were expressed in molar proportions.
Data were analysed as a randomized complete block design with two feed blocks (LF and HF) and seven dose rates of melamine (0, 2, 6, 8, 54, 162 and 486 g/kg of the feeds) in each feed block. The model was applied was:
 $$Y_{ijk} = \mu + R_i + F_j + M_k + \varepsilon _{ijk} $$
where Y ij is the dependent variable under examination, μ is the overall mean, R i is the experimental run effect (i=4), F i is the block effect of the feeds (j=2), M k is the melamine dosage effect (k=1), and ε ijk is the error term. All statistical analyses were performed using the general linear model procedure of SAS (1999) with a multiple comparison test (Tukey/Kramer). The orthogonal contrasts were used to assess the feed block effect (LF v. HF), and orthogonal polynomial contrasts were performed to determine linear and quadratic effects within the melamine dosage treatments. Least square mean and standard error (s.e.m.) were calculated with the least square mean statement of the general linear model procedure. Significance was declared at P<0·05.
RESULTS
Chemical composition of the diets incubated
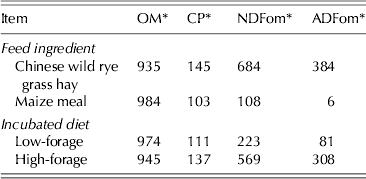
The nutrient contents of CP, NDF and ADF were numerically greater in Chinese wild rye hay than maize meal (Table 2). As expected, both NDF and ADF were greater in the HF diet compared with the LF diet, whereas the CP content was similar between HF and LF.
Chemical compositions (g/kg DM) of feed ingredients and diets incubated in vitro
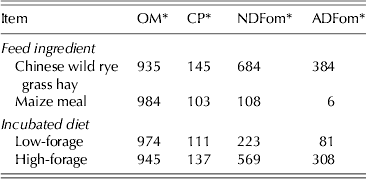
* OM, organic matter; CP, crude protein (N×6·25); NDFom, neutral detergent fibre corrected for residual ash; ADFom, acid detergent fibre corrected for residual ash.
Consistency of runs
The blanks, obtained in four incubation runs, showed very similar results with regard to GP, pH, NH4-N, microbial N and total VFA at 72 h (Table 3), thus no correction factors were applied to correct for differences between runs.
Cumulative gas production and fermentation characteristics of blanks under different runs of 72 h in vitro batch cultures*

* Diluted buffered rumen fluids (75 ml) were incubated for 72 h without substrate, and the number of observations used in the statistical analysis for each experimental run was n=3.
† GP72, cumulative gas production at 72 h; Total VFA, volatile fatter acids including acetate, propionate, butyrate, valerate, iso-butyrate and iso-valerate.
‡ NS, not significant (P>0·05).
Gas production kinetics and gas composition
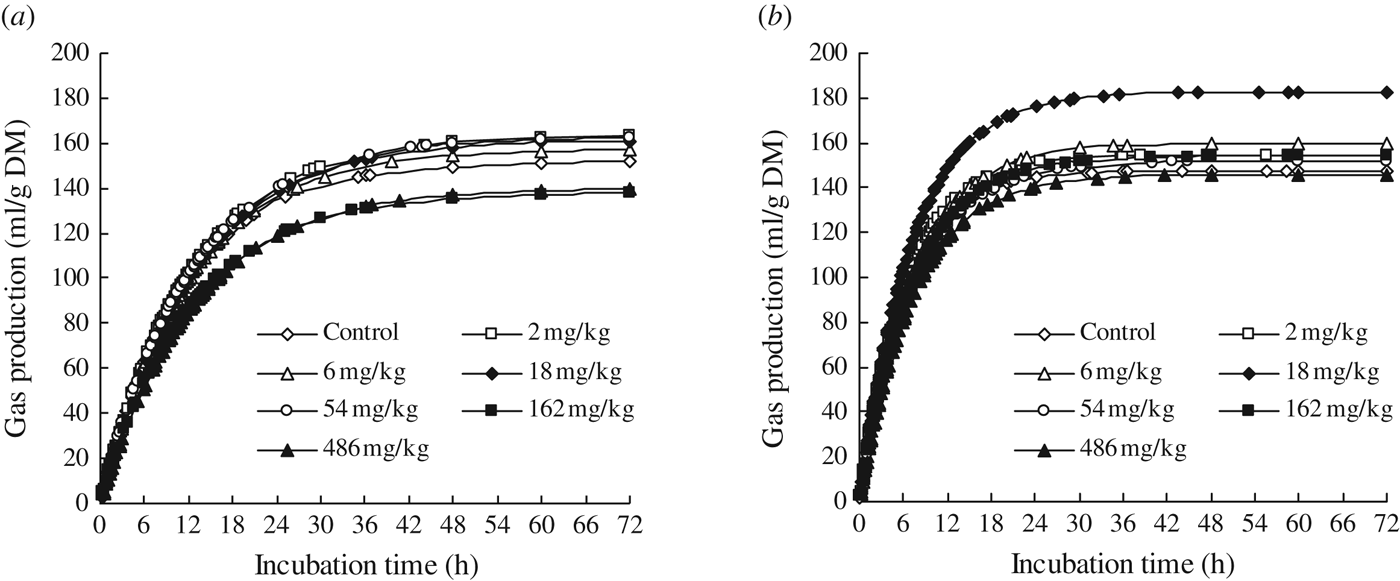
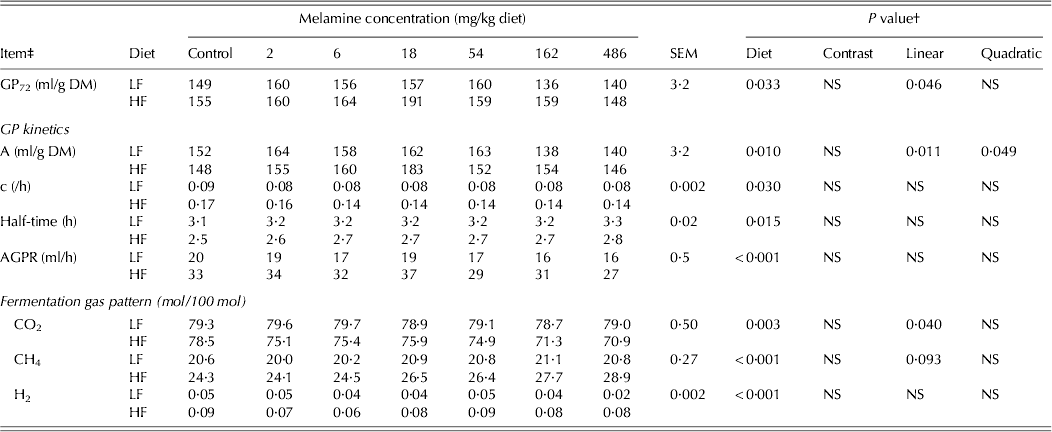
Values of GP at 72 h (P=0·033), parameter A (P=0·011), fractional GP rate (c) (P=0·030) and AGPR (P<0·001) were greater in HF than in LF (Table 4 and Fig. 1), but the half-time values were lower in HF than in LF (P=0·015). Both GP at 72 h (P=0·046) and A (P=0·011) deceased linearly in response to the increase of melamine dosage. The parameters c, half-time and AGPR did not differ between melamine addition and the control.
Cumulative gas production profiles of in vitro ruminal fermentation of diets with (a) low and (b) high forage contents in response to different melamine addition expressed in mg/kg of diets.

Influence of the addition of melamine on gas production (GP) kinetics and fermentation gas pattern of diets with a low (LF) and high (HF) forage content incubated in batch cultures of mixed rumen micro-organisms*
* Diluted buffered rumen fluids (75 ml) were incubated for 72 h with 500-mg ground diet, and the number of observations used in the statistical analysis for each melamine dose per diet was n=4.
† Contrast, contrast effect between the zero control and melamine addition; Linear, linear effect of melamine addition; Quadratic, quadratic effect of melamine addition; NS, not significant (P>0·10).
‡ GP72, cumulative gas production at 72 h; A, the asymptotic gas production; c, the fractional rate for the gas production of ‘A’; Lag, the initial delay time in the onset of gas production; AGPR, the average gas production rate.
Molar CO2 proportion was greater in LF than in HF (P=0·003), and it decreased linearly in response to melamine addition (P=0·04). The proportions of molar CH4 (P<0·001) and H2 (P<0·001) were lower in LF than in HF. Melamine did not affect molar H2 proportion, and a tendency for the proportion of molar CH4 to increase was observed in HF (P=0·093).
In vitro fermentation characteristics
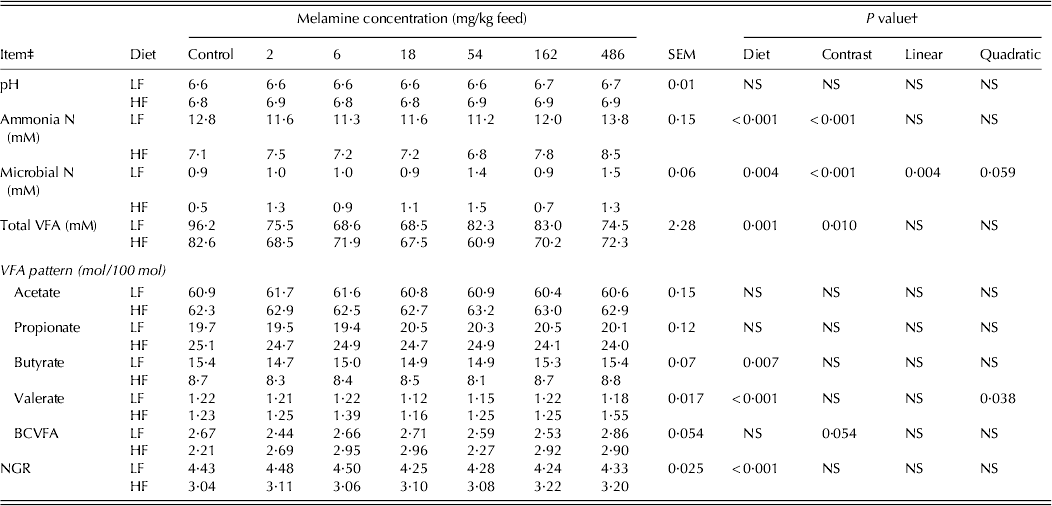
As shown in Table 5, pH did not differ between the two diets, and it was not affected by melamine addition. Ammonia N concentration was greater in LF than HF (P<0·001) and was not affected by melamine addition. Microbial N did not differ between the two diets and it was increased linearly by melamine addition (P=0·004). Total VFA concentration (Table 3) was greater in LF than HF (P=0·001). Compared with the control, the melamine addition decreased the concentrations of total VFA (P<0·010). With regard to VFA patterns, molar proportions of acetate and propionate did not differ between the two diets and were not affected by melamine. Molar butyrate proportion was greater in LF than HF (P=0·007), but it was not affected by melamine. Molar valerate proportion was lower in LF than HF (P<0·001) and a quadratic effect was observed (P=0·038). Molar BCVFA proportion did not differ between two diets, and a tendency for it to increase was observed in melamine treatments compared with the control (P=0·054). The NGR value was greater in LF than HF (P<0·001) and it was not affected by melamine addition.
Influence of melamine on production of volatile fatty acids and their pattern during in vitro ruminal fermentation of diets with a low (LF) and high (HF) forage content incubated in batch cultures of mixed rumen micro-organisms*
* Diluted buffered rumen fluids (75 ml) were incubated for 72 h with 500-mg ground diet, and the number of observations used in the statistical analysis for each melamine dose per diet was n=4.
† Contrast, contrast effect between the zero control and melamine treatment; Linear, linear effect of melamine addition; Quadratic, quadratic effect of melamine addition; NS, not significant (P>0·10).
‡ VFA, volatile fatty acids; BCVFA, branched-chain VFA including iso-butyrate and iso-valerate; NGR, ratio of non-glucogenic to glucogenic acids.
DISCUSSION
Influence of diet and melamine on gas production kinetics and methane production
In vivo digestibility of animal feeds was estimated by measuring in vitro GP of feed samples incubated in ruminal fluid buffered with HCO3−/CO2 (Menke et al. Reference Menke, Raab, Salewski, Steingass, Fritz and Schneider1979). This method was also applied to measure the degradation rates of feedstuffs by following GP over time (Van der Meer et al. Reference Van der Meer, Wever and Bediye1988; Krishnamoorthy et al. Reference Krishnamoorthy, Soller, Steingass and Menke1991; Merry et al. Reference Merry, Theodorou, Raurich, Dhanoa, Pahlow and Honig1991). In the present study, differences between HF and LF diets were observed in GP kinetics, suggesting that the extent and rate of the feed degradation depended mainly on the nature of the incubated substrate. Compared with the control, addition of melamine did not alter GP kinetics, suggesting that melamine addition had no beneficial effect on the extent and rate of feed degradation.
Since CO2 is an end product of fumarate fermentation to propionate via the succinate–propionate pathway (Demeyer & Henderickx Reference Demeyer and Henderickx1967), it has been widely believed that H2 and CO2 are the principal precursors used by rumen methanogens to produce CH4 (Hungate et al. Reference Hungate, Smith, Bauchop, Yu and Rabinowitz1970), and CH4 production by rumen micro-organisms may depend largely on the nature of the fermented substrate (García-Martínez et al. Reference García-Martínez, Ranilla, Tejido and Carro2005). In the present study, significant differences in molar proportions of CO2, CH4 and H2 were observed between HF and LF diets, but no difference occurred in the melamine addition group compared with the control. Although increased melamine addition did not affect the proportions of molar H2, the addition of melamine linearly decreased the proportion of molar CO2, especially in the HF diet group, and a tendency for molar CH4 proportion to decline was observed in the HF diet. These results implied that melamine would stimulate the growth of methanogens in the rumen to reduce CO2 and generate CH4, especially in HF diets.
Influence of diet and melamine on N metabolism
Protein degradation by rumen microbes results in the formation of ammonia in rumen fluid, and peptides and amino acids are intermediates in this process (Reynal et al. Reference Reynal, Ipharraguerre, Liñeiro, Brito, Broderick and Clark2007). The concentrations of ammonia N and peptide N in rumen fluid depend on the source and amount of degradable protein in the rumen (Reynal et al. Reference Reynal, Ipharraguerre, Liñeiro, Brito, Broderick and Clark2007). Ammonia is the preferred N source for fibre-digesting bacteria (Hungate Reference Hungate1966; Bryant Reference Bryant1973) and is required for protein synthesis by microbes that ferment starch, sugar and secondary fermenters (Cotta & Russell Reference Cotta and Russell1982). In the present study, the concentrations of ammonia N and microbial N in culture fluids were greater in LF than HF diets, indicating that rumen microbes degraded dietary N into ammonia N more easily from maize meal than from Chinese wild rye hay. Ammonia N would stimulate microbial growth, resulting in a higher microbial N yield in LF- than HF diet. Ammonia N and microbial N were, to some extent, increased by the addition of melamine compared with the controls, and microbial N was increased linearly and quadratically by increasing amounts of melamine. This suggests that the presence of melamine N would to some extent stimulate the growth of rumen microbes under a relatively low dietary N supply of both HF and LF diets.
Alteration of peptide N as well as ammonia N in rumen fluid could affect rumen fermentation characteristics and microbial protein synthesis (Broderick & Wallace Reference Broderick and Wallace1988; Jones et al. Reference Jones, Hoover and Miller Webster1998). Peptide N could stimulate microbial growth, and a basal ammonia N concentration in rumen fluid was necessary to prevent depression in rumen fermentation and fibre digestibility (Jones et al. Reference Jones, Hoover and Miller Webster1998). Previous work has reported enhanced growth and efficiency of rumen microbes (Russell & Sniffen Reference Russell and Sniffen1984) or improvement in the digestion of DM, OM and fibre (Griswold et al. Reference Griswold, Apgar, Bouton and Firkins2003) with increases of peptide N in rumen fluid. The effect of melamine N on the growth of mixed rumen micro-organisms has not been reported in the literature. The microbial N results obtained in the present study indicate that melamine N would be beneficial to the growth of rumen microbes, resulting in comparatively high yields of microbial N in the melamine addition group compared with the control in the fermentation of both low-N diets.
In a digestion and N balance trial with rumen-fistulated cows, Newton & Utley (Reference Newton and Utley1978) believed that melamine included in the diet at a very high level of 9 g/kg might not be hydrolysed in the rumen at a rate sufficient to promote maximum ruminal protein synthesis and incompletely hydrolysed fractions might be absorbed and voided in the urine. According to different recommendations for ammonia N concentration in rumen fluid for maximal in vitro microbial growth (Satter & Slyter Reference Satter and Slyter1974) or in situ DM and CP degradation (Wallace Reference Wallace1979) and for in vivo rumen fermentation (Song & Kennelly Reference Song and Kennelly1989), the increased and/or decreased N amounts of ammonia and microbial protein were limited in the present study, which would not satisfy the need for maximum growth of microbes in rumen fermentation.
Influence of diet and melamine on volatile fatty acids production and its pattern
In ruminants, micro-organisms in the rumen have been found to ferment a wide range of endogenous and exogenous substrates to produce VFA and fermentation gases (e.g. CH4, CO2 and H2). The production of VFA and gas could also reflect indirectly microbial growth performance and the potential of the microorganism to degrade the substrate. In the present study, fermentation of the LF diet exhibited a higher total VFA production than that of HF diet, but total VFA production was lower in the melamine addition treatment than the control. In the literature, VFA production in the rumen accounted for over two-thirds of energy intake to the host ruminant animal (Bergman Reference Bergman1973), and the balance between supply of glucogenic relative to non-glucogenic fatty acids influenced the efficiency of VFA utilization for productive purposes (Ørskov Reference Ørskov and Bourne1975). In the VFA pattern of the present study, melamine did not affect molar proportions of acetate, propionate, or butyrate as main fermentation end-product VFAs.
Griswold et al. (Reference Griswold, Hoover, Miller and Thayne1996) stated that branched-chain VFAs would be utilized along with ammonia N to synthesize amino acids and form microbial protein. Using different forms of N (e.g. peptides, amino acids and urea) in continuous culture, Griswold et al. (Reference Griswold, Hoover, Miller and Thayne1996) found that the greatest amounts of iso-butyrate were produced by using peptide N form, and peptide addition in continuous culture increased branched-chain VFA production that consequently could increase fibre digestion. Iso-butyrate, valerate and iso-valerate were fermentation products from valine, proline and leucine, respectively (Nagaraja et al. Reference Nagaraja, Newbold, Van Nevel, Demeyer, Hobson and Stewart1997). In the HF group of the present study, melamine increased the molar proportions of branched-chain VFAs with an augmented mean increase of 22·1%, which was probably due to the positive effects of melamine on protein degradation.
Finally, melamine slightly decreased NGR in LF feed by an average of 1·6% and increased NGR in HF feed by an average of 2·4%. Hristov et al. (Reference Hristov, Etter, Ropp and Grandeen2004) found no effect of different rumen degradable protein levels on concentrations of total VFA, acetate, butyrate and propionate in rumen fluid, and only found an increase in the amount of iso-butyrate with high rumen degradable protein level. Although limited work has been done on the increase of propionate by addition of degradable protein in the diets of dairy cows (Reynal & Broderick Reference Reynal and Broderick2005), most of the studies have shown increases of acetate, butyrate and branched-chain VFA by adding different amounts and sources of rumen degradable protein (Griswold et al. Reference Griswold, Hoover, Miller and Thayne1996, Reference Griswold, Apgar, Bouton and Firkins2003; Yang Reference Yang2002).
In summary, melamine had a large adverse effect on fermentation by decreasing fermentation gas and VFA production and by increasing CH4 production. The greatest reduction was found for the HF feed in comparison to the LF feed, indicating that rumen fermentation in vitro depended mainly on the nature of the incubated substrate. This could be further inhibited by the increasing melamine addition.
The authors appreciate the financial support of The Ministry of Science and Technology of the People's Republic of China (Project no. 2011BAD26B0304) and the special funds (Project no. Nycytx-38) for National Beef Industrial Technology System established by the Ministry of Agriculture of the People's Republic of China.