Implications
Genetic variation and its maintenance are of utmost relevance to selection and conservation; therefore, one of the first steps is to estimate the current state and predicted changes in variation. Genealogical information would yield comprehensive parameters to assess the actual levels of diversity, and therefore should be preferred to assess the state of variation, although molecular genetic markers, and in the future even whole genome sequences of individuals, are also useful in describing variation.
Importance of genetic diversity
Animal genetic resources must be preserved because of their contribution to the human livelihood, now or in the future, or because of their cultural value as a historical witness. There are many scientific, political and social issues involved. Perhaps the most important ones are how to make local breeds more self-sustaining through conservation actions and how to set up priorities in conservation (Boettcher et al., Reference Boettcher, Tixier-Boichard, Toro, Simianer, Eding, Gandini, Joost, Garcia, Colli and Ajmone-Marsan2010; Hiemstra et al., Reference Hiemstra, Haas, Maki-Tanila and Gandini2010). In both issues, the assessment and the management of genetic diversity are key aspects. In the this paper, we will deal with the methods for analysing genetic diversity and in a companion paper (Fernández et al., Reference Fernández, Meuwissen, Toro and Mäki-Tanila2011) with their utilization and management.
Farm animal populations as well as companion animals are exhibiting considerable amounts of genetic variation in exterior, production and fitness traits. The existence of large amount of genetic variation is the basis for the survival and development of animal populations. The variation should appear as considerable allelic diversity and heterozygosity over the genome. Genetic variation allows evolvability of production animals. It also leaves room for adaptation to varying environments via natural selection. In general, the response to artificial selection on a trait is directly proportional to the amount of genetic variation in the trait. Because the genetic diversity is of utmost relevance, one of the first steps in planning a development scheme – either for conservation or selection purpose – in a breed is to estimate the current state of diversity in the population, and more importantly the predicted changes in the variation given the current size and use of parents. It is important at very early stages to understand and analyse to which direction the variation is moving, given that the current size and use of parents will prevail. The outcome of such an analysis could then be used to decide whether some actions are needed to safeguard the maintenance of variation. In worst cases, the analysis may reveal that the actual basis of genetic variation in the population is very narrow, either because of a small census size or a recent bottleneck or highly unbalanced use of elite individuals in intensive selection. Immediate actions should be taken to stop any undesirable development and to initiate actions to prevent further decay of variation. The design of the programme is very similar whether we have a conservation or selection programme. Overall, the management of genetic variation would need planning for an appropriate design and operational tools. Without planned management in a genetically narrow population, there will be immediate consequences such as increased homozygosity, leading to undesirable consequences, the most noticeable being the emergence of Mendelian recessive defects or polygenic inbreeding depression. In the long term, poor management results in reduced potential for genetic change and the danger of accumulation of deleterious mutations. For example, in case of a new infectious disease, we may envisage a risk that a population with less diversity may be severely affected if it lacks resistant variants.
Measures of genetic variation
Genetic variation or diversity could be described and observed as a spectrum of alleles and genotypes. In some cases, such as for coat colouring in animals, this results in distinct (discrete) phenotypes. In general, the allelic variation is manifested as visible continuous (quantitative) variation. The most important form of genetic diversity is the quantitative variation for reproductive fitness or production traits because it determines the ability to evolve or to be genetically improved. In an infinitely large population with no selection, the allelic variation stays constant. When the population size is restricted or the number of individuals allowed to breed is fairly small, the allele frequencies change, which results in increased homozygosity and/or losses of alleles. Genetic drift is the change in the frequency of a gene variant (allele) in a population because of random sampling. In a finite population, these effects are accumulating because of sampling of gametes. The changes can be expressed in terms of inbreeding or coancestry. The first is related to the observed homozygosity (upon which inbreeding depression depends) and the second is related to the expected homozygosity (homozygosity under the Hardy–Weinberg equilibrium), which in turn is connected to the variance of gene frequencies, and therefore also connected to the genetic drift. As we will show later, these parameters could be deduced from pedigree (genealogical) information.
From a descriptive point of view, genetic information can refer to DNA sequences, individual genes, chromosomes or quantitative genetic variation. Modern molecular genetic tools are making it possible to have a very detailed picture of the populations. Microsatellites have been the markers of choice to study genetic variation in the recent years. On the basis of sites in which the same short sequence is repeated several times, they present a high mutation rate and codominant nature, making them appropriate for the study of both within-breed and between-breed genetic diversity (see Groeneveld et al., Reference Groeneveld, Lenstra, Eding, Toro, Scherf, Pilling, Negrini, Finlay, Jianlin, Groeneveld and Weigend2010). Nevertheless, it seems that the single nucleotide polymorphisms (SNPs) are becoming now the markers of choice. SNPs are point mutations in the genome sequence, predominantly biallelic and highly abundant throughout the genome. They have the potential to detect both neutral and functional genetic variation because, although most of them are located in non-coding regions, some correspond to mutations inducing changes in expressed genes. It is now possible, with modern DNA chip technology, to analyse up to tens or even hundreds of thousands of such marker loci. The information from several (linked) sites can be put together and used to follow the combinations of alleles from different loci or haplotypes and the frequencies of such haplotypes in the processes of recombination, selection and drift. Now, it is also feasible to obtain complete sequence information on chosen areas of the genome, and in the future the whole genome sequences of all the studied individuals are likely to become available.
At the molecular level, genetic diversity is usually measured by the frequencies of genotypes and alleles, by the proportion of polymorphic loci, by the observed and expected heterozygosity or by the allelic diversity. In the context of structured populations, molecular measures of differentiation are based on the partition of genetic diversity in between-subpopulation and within-subpopulation components, on genetic distances calculated from allele frequencies among populations (Laval et al., Reference Laval, San Cristobal and Chevalet2002; Toro et al., Reference Toro, Fernández and Caballero2009) as well as on the popular Wright's (Reference Wright1969) fixation index.
It is possible to have a detailed analysis of the allelic distribution at the chosen loci. The allele frequencies (qi) could be used to compute the gene diversity or expected heterozygosity under random mating or Hardy–Weinberg equilibrium. The expression for calculating such a parameter is 2ΣΣqiqj = 1−Σqi 2. This is also an indicator for the additive genetic variation of the population for quantitative traits. The observed heterozygosity (sum of the proportion of heterozygotes at all loci/total number of loci sampled) may be different from the expected one with the deviations being caused by drift or non-random mating factors.
Allelic diversity (allelic richness), or the average number of alleles at sampled loci, would predict the long-term selection potential. This measure is more affected by bottlenecks than gene diversity, and consequently, can be used to find out the recent history of the population. It must be observed that allelic diversity is purely a descriptive parameter as maximizing allelic diversity in a genetic management scheme does not make sense, i.e. marker alleles do not have themselves a value for conservation (in contrast to generally unknown quantitative trait locus (QTL) alleles). On the other hand, maximizing gene diversity would also maximize allelic diversity, because the maximum value for the former occurs for intermediate frequencies (Fernández et al., Reference Fernández, Toro and Caballero2004). As a large sample would usually contain more alleles, the measure is biased by the sample size and some corrections (e.g. rarefaction methods) should be implemented. From classical theory, it can be proven that when the population is divided into (inbred) sublines, a high allelic richness could be maintained.
When sequences of DNA are available, the variation can be estimated by the proportion of analysed nucleotide sites that differ in the population. A second measure is the nucleotide diversity, the proportion of nucleotide differences between pairs of sequences weighting these differences by the frequencies of the sequences. For example, in human populations, two randomly chosen individuals differ at about one SNP per kilobase, whereas for chicken it is 4 to 5.5 (International Chicken Map Consortium, 2004) and for sheep and cattle the figure is 2 to 2.5 (1.4 for Angus and Holstein and 3.4 for Brahman; Villa-Angulo et al., Reference Villa-Angulo, Matukumalli, Gill, Choi, Van Tassell and Grefenstette2009). Similar measures to those for nucleotide diversity can be calculated for the amount of amino acid variation in coded proteins.
We can measure genetic similarity between individuals genotyped for markers. The molecular coancestry (fM) is the probability that two alleles at random, one from each individual are identical (identical by state, IBS). It is also called molecular kinship or Malecot similarity. The correspondence between fM and the measures of diversity calculated through the allelic and genotypic frequencies establishes that the expected heterozygosity is equal to 1 – average molecular coancestry, and the observed heterozygosity equals 1 – average molecular inbreeding.
We can also obtain diversity measures from pedigree information. When two relatives are mated, in the offspring the two alleles in one locus could be copies of the same ancestral allele. Coefficient of inbreeding of an individual (F) is the probability that the two alleles at a locus are identical by descent (IBD). The inbreeding coefficient of an individual would deviate from 0 only if the parents are related. When two individuals are related, it is expected that they share IBD alleles. The probability for alleles from two different individuals being identical because of inheritance is measured by the coancestry coefficient (f). Therefore, the inbreeding coefficient is equal to the coancestry coefficient of the parents.
There is a parallelism between these parameters and the ones calculated for the molecular genetic diversity. The gene diversity (or expected heterozygosity by descent) over many loci (with different virtual alleles of the base population) of any cohort (say, age group) is 1−f. Similarly, 1−F is the observed heterozygosity of many loci with ‘virtual’ alleles that are all different in the base population. Which will be the observed heterozygosity for the ‘real’ genes? The ‘real’ heterozygosity will be the proportion 1−F of the heterozygosity of the founder population. In practice, the founder population is the population when pedigree recording started, and consequently populations with many generations of recorded pedigrees tend to have high coefficients of inbreeding and populations whose pedigree recording started recently tend to have low coefficients of inbreeding. Therefore, this parameter cannot be compared among populations but the rate of change of this parameter should be used instead, as we have shown below.
With the new molecular genetic methods, it is possible to have a very detailed picture of variation at the DNA levels without any noise. Some people may ask why to bother about inbreeding as inferred from pedigree? It is because we do not know the relevant loci and/or the important alleles, and neither do we know how the allele effects within and between loci may deviate from additivity. There are many alleles and their frequencies vary. Therefore, to have comprehensive predictions for different cases, we have to rely on pedigree measures that are expectations for the whole genome.
Effective population size or rate of inbreeding preferred
It has been popular to compute inbreeding coefficients for individuals and their averages for the whole population. Inbreeding is unavoidable and its measures are not necessarily comparable between populations, as the value depends on how far back in the pedigree the distal frame of the analysed window is. The elevated inbreeding levels may, therefore, only reflect the detailed depth of the pedigree recording.
When we measure the probability of an individual carrying at a locus two copies of an allele possessed by an ancestor somewhere in the past, we thereby choose a base generation for the assessment. The estimated inbreeding coefficient depends, of course, on the rate of accumulating similarity by descent and on the considered generation span. In contrast, the rate of inbreeding (ΔF) does not depend on the depth of the pedigree but on the relative increase in inbreeding from one generation to the next. It will stay constant over generations if the same number of parents is used to produce offspring with the same reproduction regime. Consequently, ΔF can be used in comparing populations with different amount of genealogical records. Therefore, the rate of developing inbreeding, or in parallel the rate of loss of variation, is more important as a criterion for designing the management of genetic variation.
The effective size of a population (Wright, Reference Wright1931, Reference Wright1938) is defined as the size of an idealized population (no mutation, no selection, no overlapping generations and random mating including self-fertilization), which would give rise to the same rate of inbreeding (ΔF), or the same rate of change in the variance of gene frequencies (ΔV(q)) observed in the population under consideration:

which correspond to the so-called inbreeding and variance effective sizes, respectively (see Kimura and Crow, Reference Kimura and Crow1963; Caballero, Reference Caballero1994). The right-hand-side equality arises because the variance of gene frequencies is related to the average coancestry by (Cockerham, Reference Cockerham1969)

Thus, the inbreeding effective size measures the rate of increase in inbreeding and the variance effective size measures the rate of increase in coancestry. In a random mating population, average inbreeding and coancestry coefficients will increase with generations such that ft = Ft + 1. When there are attempts to prevent mating between relatives (non-random mating), there may be a longer delay between f and F. The degree of non-random mating is measured by the correlation of genes within individuals relative to the correlation of genes taken at random from the population (α). It can be incorporated into the relationship between F and f by the expression (1−F) = (1−α)(1−f) (Wright, Reference Wright1969). A negative value of α indicates that matings between relatives have been avoided. In a regular breeding system, α soon reaches an asymptotic value and the rates of increase in F and f will eventually converge to the same value so that NeI = NeV. Only if the population is permanently divided into sublines or when the population is decreasing or increasing in size, the two effective sizes will differ. Otherwise, they will be the same after a few generations. As it is shown in the companion paper (Fernández et al., Reference Fernández, Meuwissen, Toro and Mäki-Tanila2011), some management strategies (e.g. circular mating) can induce intrinsic sublining, leading to positive α. Notwithstanding, in general it is not necessary to make distinction between the two versions of effective population size.
An intuitive measure of the rate of inbreeding can be formulated in terms of how the ancestral contributions (c) are distributed and accumulating over generations. Wray and Thompson (Reference Wray and Thompson1990) first used the concept of long-term contributions, which is a simple summary of what can be seen in the pedigree: the genetic contribution of an individual from an ancestor generation to a generation of descendants is the proportion of pathways that trace back from the descendants to that particular ancestor. They showed, later confirmed by Woolliams and Bijma (Reference Woolliams and Bijma2000), that there is a close relationship between long-term contributions and the rate of inbreeding: ΔF per generation can be calculated as  of the sum of the squares of the long-term contributions for all individuals born in the generation
 . This implies that the rate of inbreeding is minimized if there were a very large number of contributors and if all would have an equal (small) contribution to the gene pool. The increase of inbreeding is related to an elevated average kinship in the population; consequently, the management of genetic variation in a conservation or breeding scheme should be directed to control the average relationship among parent candidates and to plan mating also in terms of minimizing the coancestry.
Another problem is that too high rates of inbreeding are detrimental for a breed because they may send the population into a mutational meltdown, i.e. harmful mutations accumulate reducing the fitness of the breed and further reducing its effective size, which further increases the probability of accumulating such mutations.
We must realize that inbreeding cannot be completely avoided in closed populations, because the number of familiar relationships increases every generation. What rate of inbreeding is acceptable in a sense that the population will not show substantial detrimental effects of the inbreeding? Because inbreeding – the probability that two alleles are IBD – is a chance process, sometimes a low probability proves fatal and in other instances much higher probabilities seem still acceptable.
Acceptable levels for ΔF or Ne
There are a number of approaches in the literature to assess the ‘acceptable rate of inbreeding’. In the evolutionary literature, the avoidance of the mutational meltdown has been investigated, and it was found that Ne needed to exceed 500 (Lynch, Reference Lynch1996), which implies ΔF = 0.001. For a number of reasons, this figure seems too high for livestock populations: (i) the time perspective taken was very long (500 generations or more); (ii) there may be active selection in livestock population against the accumulation of deleterious mutations with recording on fitness traits or genome screening for Mendelian recessive defects; (iii) the mutation rate (0.5 per genome per generation) assumed in these studies seemed too high (García-Dorado et al., Reference García-Dorado, Monedero and López-Fanjul1998); and (iv) long-term selection experiments using much lower Ne have not found any indications that populations of this size were at risk. The different approaches taken in livestock populations to assess the ‘acceptable rate of inbreeding’ seem to agree on an effective size of 50 to 100 animals (ΔF = 0.01 to 0.001).
New variation v. losses in small populations
Selection is constantly removing some genetic variants and thereby reducing the total genetic variation. But in small populations, or in selection programmes where a small number of parents are used to produce the next generation, genetic variation is mainly lost because of sampling or genetic drift. In each generation, a proportion 1/(2Ne) of the existing variation is lost, irrespective of their selective value.
In a closed population (without any genetic exchange with other populations), the only source of new variation is due to spontaneous mutations, symbolized with VM per generation. In a steady state, when losses are compensated with the new diversity, the genetic variation is 2NeVM (provided that Ne and VM stay constant over generations). Estimates of VM up to 0.5% of the non-genetic variance have been obtained in mice (Keightley, Reference Keightley1998). Consequently for a heritability of 0.33 (0.50), a population of Ne = 50 (100) is required to maintain the balance (i.e. not losing genetic diversity). In comparison for simpler organisms, a common estimate on Drosophila is that VM is of the order of 0.1% of the non-genetic variance (e.g. Falconer and Mackay, Reference Falconer and Mackay1996). In a steady state for a heritability (h 2) of 0.33, a population of size Ne = 250 is needed, and for a heritability of 0.50 up to Ne = 500 is required.
Probability of losing or fixing alleles: neutral alleles
Although we usually consider the variation for economically important traits, we should probably take a wider perspective and we should try to maintain currently neutral variation for future breeding objectives. Moreover, we may have a rare allele (at some loci) that we want to maintain in our population. The effective number of founder genomes or number of genome equivalents (Nge; see a more detailed explanation later on) that are preserved in the population is Nge = 1/(2f), where f is the average coancestry in the population (which is approximately equal to the average inbreeding). The effective number of conserved founder alleles is ne = 2Nge, being the effective number of alleles defined as the reciprocal of the sum of squares of allelic frequencies (Crow and Kimura, Reference Crow and Kimura1970). If only two alleles are preserved, the probability that the rare allele is lost is 1−q, where q is the frequency of that allele. As we are effectively conserving ne alleles, the probability that the rare allele is lost is (1−q)ne ≈ exp(−qne) = exp(−q/f). As an example, if we assume an initial frequency of q = 0.2 and we do not want the probability of loss of the allele to exceed 10% over a period of 10 generations (50 years in cattle), we need f = 0.09 or ΔF = 0.009 per generation, which implies Ne = 56.
Probability of losing or fixing alleles: beneficial alleles
In the same way, Hill (Reference Hill2000) has reviewed the probabilities of fixation for beneficial alleles for quantitative traits. With small Ne, the proportion of the variance lost per generation  would affect even alleles with a large effect. We would like to know what is the probability of this kind of alleles to be fixed (as desired) rather than getting lost from the population. An allele with effect a/σ (a is the difference between the homozygotes in a biallelic locus) in phenotypic standard deviation (σ) has under artificial selection (intensity i) a selective value s = iar/hσ, where r is the accuracy of selection. Kimura (Reference Kimura1957) derived the fixation probability for a non-neutral allele with a frequency q to be [1−exp(−2Nesq)]/[1−exp(−2Nes)], which Robertson (Reference Robertson1960) extended for alleles at a QTL. For a/σ (or s) > 1/Ne, the probability is approximately 1−exp(−2Nesq). As a criterion for not losing the allele from the population, we use a high fixation probability of >90%. For example, for an allele with q = 0.2 (and i = 1.5 and r/h = 1.3), we have to maintain

Considering the total genetic variation and assuming loci with equal effects each with a contribution q(1−q)(a/σ)2 to the heritability, several hundred loci are needed to arrive at h 2 = 25% to 30%.
The useful alleles are rarely removed from the population. The risk of getting lost is only for alleles that are initially at a very low frequency or in a population that is very small. When a mutant appears in a population of census size N, it has a frequency of  and the fixation probability is approximately Nes/N. The fixation probability depends on the ratio of effective to actual size. In each generation, there are two Nμ mutants (proportional to the actual size). The rate of fixation is, therefore, 2Nμ × Nes/N = 2Neμs (proportional to N e).
In a steady state, the variation maintained is 2NeVM for genes with very small effect on fitness (Hill and Keightley, Reference Hill and Keightley1988). The steady-state variation is not affected by intensity of selection as favourable alleles are soon fixed, and therefore contribute to variation only for few generations. Therefore, for the genes that are segregating in the population, there is a diminishing return relationship between long-term response (or variation maintained) and population size, whereas for new mutations there is a monotonic increasing relationship.
If there are alleles with an increasing effect under artificial selection that have a pleiotropic negative effect on fitness, the steady-state variation may exceed 2NeVM. The selection response would, however, be smaller than predicted because of the antagonistic relationship between the trait value and fitness (Hill and Mbaga, Reference Hill and Mbaga1998).
Probability of losing or fixing alleles: harmful alleles
As stated previously, in a small population, drift can overcome the effect of selection and harmful mutations are likely to linger around as their fixation probability is roughly (1 + Nes)/2N for −1/Ne < s < 0 and zero for more deleterious ones (Hill, Reference Hill2000). If there are many loci segregating in the population and some become fixed, this will lower the overall fitness. Therefore, large populations are needed for elimination of harmful mutations. Otherwise alternatively in animal production, we would need better management to compensate impaired fitness or health control to act against undesired changes.
Coping with inbreeding depression
Meuwissen and Woolliams (Reference Meuwissen and Woolliams1994) balanced the depression in fitness because of inbreeding against the genetic variation for natural selection, which improves fitness. Depending on the fitness parameters assumed, the critical Ne varied between 50 and 100 animals.
Old v. new inbreeding
Hinrichs et al. (Reference Hinrichs, Meuwissen, Odegard, Holt, Vangen and Woolliams2007) investigated the inbreeding depression effects of ‘old’ and ‘new’ inbreeding in a long-term selection experiment for litter size in mice. They found that ‘old’ inbreeding did not have detrimental effects, if it was defined as older than 20 generations. Thus, in order to avoid substantial inbreeding depression, the inbreeding should remain low for 20 generations, say lower than 10%. This implies an acceptable rate of inbreeding of 0.5% (=1/200) per generation, and thus an Ne of 100.
Variation of selection response
Nicholas (Reference Nicholas1980) argued that the coefficient of variation of the selection response over 10 years of selection needed to be <10%; otherwise, a breeding operation would become too risky business. The expected response over 10 generations is E(ΔG) = irt, where i is intensity of selection, r is accuracy of selection and t is the number of generations within 10 years (genetic variance is arbitrarily set to 1 here). The variance of response is approximately V(ΔG) = 2ΔFt. Setting CV(ΔG) = 0.1 implies 2ΔFt = (0.1irt)2. Assuming t = 2 (generation interval of 5 years for cattle), r 2 = h 2 (where h 2 is the heritability, which is an underestimate of r 2 depending on the selection index used) and i = 2, which is quite high (to compensate for the underestimate of r 2) give ΔF = 0.04h 2. Hence, if the breeding goal has a heritability of 0.25, this leads to ΔF = 0.01 and Ne = 50.
Long-term selection experiments
Many long-term selection experiments, which were conducted with rates of inbreeding of ∼0.5% (Ne = 100) showed mostly continuous linear selection response, and no signs of reduced genetic variation.
In conclusion, although there does not seem to be a ‘school-book’ derivation or experiment showing that Ne needs to be 50 to 100, most of the approaches point to the same direction, namely that rates of inbreeding of 0.5% to 1% are acceptable for livestock populations (see a compilation of estimates in Frankham et al., Reference Frankham, Ballou and Briscoe2002).
Estimation of effective population size: genealogical analysis
The concept of effective size has usually an asymptotic meaning in a regular system, and it is more frequently used for predictive purposes rather than for analysing realised genealogies. However, we can still use the concept to understand the relationship with other pedigree tools explained below. In the context of genealogical analysis, we can consider the increase in average inbreeding (coancestry) between the founder generation and a given generation t

Or it can be calculated generation by generation

For a population where there are no changes over generations in management and no other factors than drift modifying the variation, the rate of inbreeding would stay the same.
A common unit of time when considering livestock populations is the year, as it constitutes the length of the production or economic cycle. However, the populations are renewed at each generation interval, and for common livestock species this may be much longer. Data over time will often appear in units of years, and consequently when estimating ΔF, the parameter will then appear as scaled per year, say ΔF(y). The rate of inbreeding per generation reflects better the expected loss of diversity incurred in replacing a generation (because drift occurs when creating gametes for obtaining offspring; Woolliams and Toro, Reference Woolliams and Toro2007).
Calculation of inbreeding and coancestry coefficients: genealogical analysis
It is clear that, in order to estimate effective population size, the first requirement is to have a method to calculate the inbreeding coefficient of an individual FX and the pairwise coancestry of two individuals. Both parameters are closely related because FX = fZY with Z and Y being the father and the mother of X. Historically, the first method developed to calculate inbreeding and coancestry coefficients was proposed by Wright (Reference Wright1922) on the basis of path coefficients. It is interesting in the sense that it is based in the calculus of the nodal ancestors (those where identity by descent comes from) that could correspond to historically important individuals (Colleau and Sargolzaei, Reference Colleau and Sargolzaei2008). The second method is the tabular method, aimed to calculate the complete coancestry matrix of all individuals (N × N matrix, if N is the number of individuals). It was developed by Emik and Terrill (Reference Emik and Terrill1949) and Cruden (Reference Cruden1949), but it was ignored and gained in popularity only with the generalization of the BLUP methodology in the 1970s (the famous additive relationship matrix is just twice the coancestry matrix).The method has the advantage of simplicity and could be implemented over millions of individuals (Meuwissen and Luo, Reference Meuwissen and Luo1992; Sargolzaei et al., Reference Sargolzaei, Iwaisaki and Colleau2005), it could cope with uncertain parentage (Pérez-Enciso and Fernando, Reference Pérez-Enciso and Fernando1992) and with sex chromosome inheritance (Grossman and Eisen, Reference Grossman and Eisen1989) and it could be extended to include molecular markers in what it is called the genealogical coancestry matrix conditional on marker information (Fernando and Grossman, Reference Fernando and Grossman1989), although in the last case computation could be prohibited for big pedigrees with missing information on markers.
The third method is the contribution method. Although it is probably also an old idea, in its modern formulation it arises from the decomposition of the A matrix (e.g. Thompson, Reference Thompson1977). In simple terms (Caballero and Toro, Reference Caballero and Toro2000), the average pairwise coancestry of a given group of N individuals is

where M is the number of individuals of the total pedigree, No is the number of founders, ci is the classical concept of genetic contributions defined by James and McBride (Reference James and McBride1958) as the proportion of all distinct genealogical pathways that travel from a given ancestor to a group of descendents and FS (FD) is the inbreeding coefficient of an individual's sire (dam). The effective number of founders (Nef) was defined by Lacy (Reference Lacy1989) and Rochambeau et al. (Reference Rochambeau, de La Fuente, Rouvier and Ouhayoun1989) as the number of equally contributing founders that would be expected to produce the same genetic diversity as in the population under study. In our notation,

where the summation is for the contributions of founders in generation 0 to descendants in t. In terms of coancestries, in a more or less regular pedigree Nef reaches an asymptotic value and becomes constant after a short number of generations. The effective number of non-founders will be
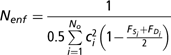
and the following relationship holds:
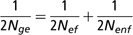
As pointed out previously, Nge is usually called the number of genome equivalents (or number of founder genomes) and equals to 1/(2f). This decomposition of terms clearly shows that the effective number of founders’ criterium ignores what happened to the non-founder ancestors, which is expressed by the effective number of non-founders.
The contribution method allows calculation of the contribution of founders and non-founders in an exact way. Boichard et al. (Reference Boichard, Maignel and Verrier1997) proposed an approximate method to calculate it, on the basis of computing the marginal contribution of an ancestor, i.e. the contribution not yet explained by other ancestors. The method has become quite popular. Obviously, there is no need for such a complex procedure because, as previously shown, contributions from all founder and non-founder individuals corrected to avoid redundancies can be calculated in an exact way. Recently, Colleau and Sargolzaei (Reference Colleau and Sargolzaei2008) have shown that Caballero and Toro (Reference Caballero and Toro2000) ancestor contributions and nodal contributions are related by a simple transformation and García-Cortés et al. (Reference García-Cortés, Martínez-Ávila and Toro2010) actually clarifies the alternative decompositions.
The fourth method, called gene dropping, was proposed by MacCluer et al. (Reference MacCluer, VandeBerg, Read and Ryder1986) as a method to analyse genealogies by simulation. In this method, two distinct alleles (founder genes) are assigned to each founder, i.e. there are 2N different alleles at generation 0, and the genotypes of all descendents along the actual pedigree are generated through Monte–Carlo simulation following Mendelian segregation rules. The entire process is repeated many times (more than 10 000 times) and the results are summarized over replicates. Now we can construct the coancestry matrix just applying Malécot definition and averaging over replicates. However, it is also instructive that the average pairwise coancestry of a cohort is
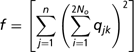
where qjk is the frequency for replicate j of founder gene k in a given cohort. Furthermore, finally, the gene dropping method allows calculating other parameters that cannot be calculated by the coancestry matrix, such as the expected number of survival alleles from each founder or the genome uniqueness.
Estimation of effective population size from genealogical analysis
When pedigree information is available, the coancestry matrix contains all the relevant information. The question now is how to summarize this information. The usual way is to group the animals by cohorts and to calculate the average inbreeding and the average pairwise coancestry for each cohort. A natural way of establishing cohorts is by the year of birth or by sex and year of birth. If the increase has been more or less linear, we can calculate the rate of increase in inbreeding or coancestry just regressing the average inbreeding coefficients of the cohorts on year. If the increases are not linear, perhaps it is better to calculate the increase in each generation using the formula presented above for the consecutive generations and average the values across generations. Another natural way is to establish the cohorts by the generation number and then carry out the appropriate regression.
With discrete generations, there are no difficulties but with overlapping generations we should have a method to calculate both generation and generation intervals. Woolliams and Mäntysaari (Reference Woolliams and Mäntysaari1995) proposed to consider the sum of contribution of all ancestors (founders and non-founders) to the last cohort as the number of discrete generation equivalents and an estimate of the generation interval would be the total number of years divided by the number of generations.
Other methods have been derived to consider practical situations where the generations are overlapping. Gutiérrez et al. (Reference Gutiérrez, Altarriba, Diaz, Quintanilla, Cañon and Piedrafita2003) considered the increment in inbreeding between two generations computing the regression coefficient of average inbreeding of animals on birth year and multiplied this by generation interval. Then, Ne = 1/2b. They went on to use the same regression approach for generations, instead of years approximating
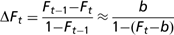
where b is now the regression coefficient of inbreeding increment on approximated equivalent complete generation. The equivalent complete generations (Maignel et al., Reference Maignel, Boichard and Verrier1996; Boichard et al., Reference Boichard, Maignel and Verrier1997) are obtained from the pedigree of an individual as the sum of the term  for all known ancestors, where n is the number of generations from the individual up to the ancestor. The parameter obtained is commonly used to describe the completeness or depth of pedigree information.
The inbreeding at generation t is predicted to be Ft = 1−(1−ΔF)t from which we can deduce for a genealogical analysis of an idealized population to compute a regression coefficient of log(1−F) on generation number. In most cases, the generations are overlapping, and therefore the computing should be performed on the birth year actually dividing the regression coefficient by the generation interval. Gutiérrez et al. (Reference Gutiérrez, Cervantes, Molina, Valera and Goyache2008) have exploited the same prediction equation for Ft, further assuming that all individuals of the hypothetical population have the same pedigree structure and the same increment of inbreeding. Then, an individual increase in inbreeding ΔFi can be expressed as  t being the equivalent complete generations calculated across the pedigree for individual i. The individual ΔF's are averaged and the mean effective population size is obtained.
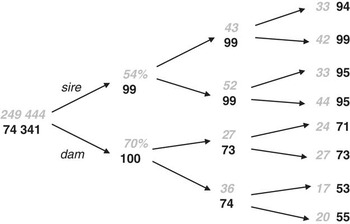
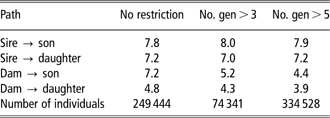
The methodology is shown with data from the Western Finncattle. The breed was established over hundred years ago while there was general interest in breed formation. At the same time, the Eastern and Northern Finncattle were established. The breeds were merged in mid-1940s and re-established in the 1980s. During the last 50 years or so, the Finncattle breeds have been replaced by the high-yielding Ayrshire and Holstein cattle. At the moment, there are some 3000 Western Finncattle cows. The pedigree file was received from FABA Service and it contains over 160 000 individuals with varying amount of information but with at least with one known parent. We realized that the value of parameters would depend on the amount of information. There are animals with varying amount pedigree information, some having information on more and some on less number of generations (Figure 1, Table 1). When considering the level of equivalent complete generations being >3, estimates of Ne per generation varied from 50 to 1300 with a harmonic mean of 171, and the regression method gave values 89 and 109. The results were computed with ENDOG software (Gutiérrez and Goyache, Reference Gutiérrez and Goyache2005).
Western Finncattle – the proportion of known parentage in the pedigree. The values are given for all the (249 444) individuals (grey, italics) and when the data are restricted (74 341), so that the number of equivalent complete generations is ⩾3. For each path, the proportion of known sires is always the top figure.

In Western Finncattle, the generation intervals (in years) computed for different paths and number of animals when all pedigree and birth year data are used and when the data are restricted according to the number of equivalent complete generations
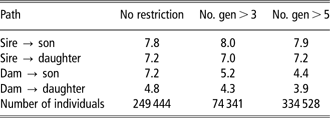
No. gen = number of equivalent complete generations.
An approach to compensate for missing ancestors is to calculate an uncertain parentage-matrix (Pérez-Enciso and Fernando, Reference Pérez-Enciso and Fernando1992) that assigns breeding animals of defined cohorts with defined probabilities to be the parents of animals with missing ancestry.
Estimation of Ne with no genealogical information
The calculation of the effective population size (Ne) for a local breed should be ideally based on the genealogical information of the animals belonging to the breed, as previously explained. Genealogical approaches are only useful if the detailed pedigree data are available, as is the case for intensively managed breeds of livestock and companions animals. But in many cases, the pedigree is entirely missing or there may be only incomplete genealogies. This fact is especially important in wild or many extensively managed populations without any control on the paternity (and sometimes even on maternity). Even in more controlled situations, the recording of the pedigree information has not been a common practice. In these situations, we have to rely on demographic data to estimate Ne or use information from molecular markers to replace/complement the genealogical data. Obviously, when we want to make predictions about the outcome of a conservation programme not yet implemented, we should rely on just a demographic description of the scheme.
Estimation of Ne with no genealogical information: demographic data
A first approach to the problem could be the use of the number of breeding individuals (males and females) available in the population. If we assume that the only deviation from the conditions of an ideal population is the finite size and the unequal number of sires and dams (i.e. sex ratio different from one), classical population genetics theory shows us that the effective population size is approximately,
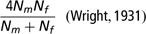
where Nm and Nf are the number of breeding males and females, respectively.
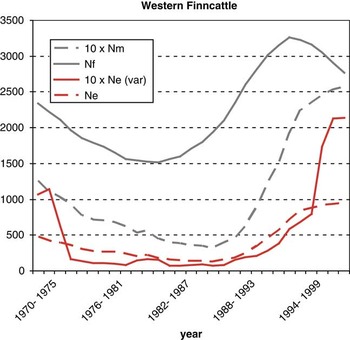
Fluctuations in the population size, already pointed as an important factor in the determination of the long-term Ne, must also be taken into account by collecting information on the number of parents along the time. This information can be also used to study the trends of the population size and to determine whether the population is declining, and thus in risk of extinction. Figure 2 shows that when the estimate of Ne is based only on parent numbers, highly biased values are obtained compared with the ones based on pedigree information.
Western Finncattle – the changes in the number of female (Nf) and male (Nm) parents according to their birth year and the respective effective population size (Ne) on the basis of different sire and dam numbers (numbers computed in a 6-year window over a 30-year period) and of the variable family size (Ne (var )).

One of the assumptions underlying the above calculations is that offspring contribution is at random, following a Poisson distribution, a condition that rarely holds. Therefore, the differential contribution of each parent should be accounted for. In populations with an equal number of males and females, the estimation of Ne follows the expression:
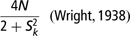
where S 2k is the variance of the number of descendants each parent leaves to the population or the variance of the family size, which is sometimes available from the management operations of a livestock species.
In the more realistic scenario of different number of males and females, the four ways of transmission between generations should be accounted for (i.e. male to male, male to female, female to male and female to female) and the formula becomes more complex (Hill, Reference Hill1979),
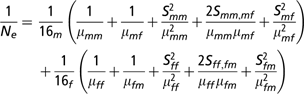
where μmm, μmf, μff and μfm are the average number of males produced by each male breeder, the average number of females from each male breeder, the average number of females from each female breeder and the average number of males from each female breeder, respectively. The terms S 2mm, Smm,mf, S 2mf, S 2ff, Sff,fm and S 2fm are the corresponding variances and covariances. Even if the variation in family size is taken into account, the estimates are overestimating the effective size as the use of family lineages across generations is ignored (Figure 2).
In selected populations, effective population size is further reduced because superior parents contribute more offspring to the next generation than average parents. Prediction of the effective size of selected populations is further complicated, because a part of the effect of selection persists in the subsequent generations. A notable feature is that the magnitude of this effect will be greater as the selection intensity increases or the heritability increases (with individual selection) or decreases (with family or BLUP selection). The problem was first addressed by Robertson (Reference Robertson1961) and has been recently reviewed by Nomura (Reference Nomura2005).
There are few estimates of effective population size of local breeds. Recently, Villanueva et al. (Reference Villanueva, Sawalha, Roughsedge, Rius-Vilarrasa and Woolliams2010) have made an attempt to gather this information from 31 sheep and 20 cattle breeds from the United Kingdom. For breeds with pedigrees available, Ne was estimated from rates of change in inbreeding. For breeds with no pedigree information, Ne was estimated from predictive equations.
Estimation of Ne with no genealogical information: use of molecular information
The problems inherent to the management procedures of the livestock populations may lead to failures in the pedigree recording, making us work with incomplete genealogies or even without genealogies. The impressive development of molecular genetics provides us with a large amount and variety of molecular markers that are increasingly being used to estimate effective population size (Ne), especially in natural populations (Wang, Reference Wang2005; Luikart et al., Reference Luikart, Ryman, Tallmon, Schwartz and Allendorf2010).
A first approach to the estimation of the Ne from molecular information can be derived from the consequences/effects of the genetic drift. One of them is the reduction of the heterozygosity in the population expressed by
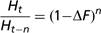
where Ht is the heterozygosity in a particular generation t (Falconer and Mackay, Reference Falconer and Mackay1996). If we have measures of heterozygosity from two different moments in time (separated by n generations), ΔF can be obtained from the above formulae, and thus Ne can be estimated. The methodology requires the knowledge of the generation interval length and assumes that no other force but drift modifies the proportion of heterozygotes in the population. One of the first examples of the application of the previous formula was carried out by Sbordoni et al. (Reference Sbordoni, De Matheis, Cobolli-Sbordoni, La Rosa and Mottlcaccia1986). They analysed a stock of prawn Panaeus japonius that has been maintained with a census of more than 600 individuals over seven generations. Over this period, the heterozygosity decreased from 0.11 to 0.03, which implies that effective population was about three individuals.
The other well-known consequence of genetic drift is the change of the allelic frequencies. Therefore, Ne can be estimated from the change in the frequency of the alleles at a neutral marker between two time points. The idea is calculating the standardized variance of change in allele frequency according to Pollak (Reference Pollak1983)
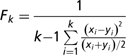
with k being the number of segregating alleles and xi and yi the allelic frequencies in the two considered moments. For multiple loci, F is calculated as the average of single locus estimates. Then, Ne is inversely related to this variance through the expression:

where t is the number of generations elapsed and S o and Sn are the sample sizes of the first and second moments, respectively (Waples, Reference Waples1989). As pointed out for the previous method, this strategy also assumes that no selection, migration or mutation is affecting the frequencies of the alleles and that the number of generations between samples is known.
More recently, maximum likelihood techniques have been implemented to estimate Ne from allelic frequencies change across time (Williamson and Slatkin, Reference Williamson and Slatkin1999; Wang, Reference Wang2001). Briefly, the idea is to calculate, through transition matrices, the probabilities of the different alleles’ configurations and to estimate Ne with maximum likelihood. This approach has been claimed to be more robust against bias produced by rare alleles, and it allows for the use of samples at more than two different time points (Wang, Reference Wang2001).
Linkage disequilibrium (LD), i.e. the non-random association between alleles at different loci in gametes, can be another consequence of drift alone, and thus be used to estimate Ne (Hill, Reference Hill1981; Waples and Do, Reference Waples and Do2008). Recently, Hayes et al. (Reference Hayes, Visscher, McPartlan and Goddard2003), de Roos et al. (Reference De Roos, Hayes, Spelman and Goddard2008) and Macleod et al. (Reference Macleod, Meuwissen, Hayes and Goddard2009) developed a method to use the LD information from multiple densely spaced markers on a chromosome segment for inferring Ne at different time points of the past. They proposed a novel multilocus measure of LD, the chromosome segment homozygosity (CSH), which is defined as the probability that two homologous chromosome segments drawn at random from the population are from a common ancestor without intervening recombination. The expectation of CSH in a population with a constant Ne is approximately 1/(4Netc + 1) for small values of c (the recombination fraction or the length of the chromosome segment in Morgans), where Net is the effective population size at t = 1/2c generations ago in the past (Hayes et al., Reference Hayes, Visscher, McPartlan and Goddard2003). Therefore, CSHs for chromosome segments of different lengths can be used to estimate Ne's for different generations of the past. In the cattle populations studied, LD decayed rapidly with increasing genomic distance, but remained present for great distances. They concluded that the effective size of the ancient cattle population was between 10 000 and 100 000 after the divergence of Bos taurus and Bos indicus ∼100 000 generations ago. After domestication ∼10 000 generations ago, the effective population size decreased to a few thousand, whereas breed formation and artificial breeding techniques have decreased the effective population sizes to ∼100 over the last 50 generations.
Molecular markers and genealogical analysis
Marker information can be used to complete or recover the genealogy. Depending on the degree of knowledge of the pedigree, markers can be used in two different ways.
Paternity analysis
Sometimes, because of the uncontrolled mating of individuals, it is only possible to attach each newborn to its mother, but the identity of the father is unknown, or at least doubtful. However, in-free range populations also, the precise determination of maternity may be difficult. We can use molecular markers to ascertain the parents of a particular individual, and thus complete a partial pedigree. On the basis of demographical information (e.g. date of birth), the number of putative parents can be reduced and we can test only the candidate animals.
The simplest approach to paternity inference involves parent identification through the exclusion of the remaining candidates (Ardren and Jones, Reference Jones and Ardren2003). In summary, the true parent(s) is (are) identified by excluding the remaining candidates on the basis of the detection of Mendelian incompatibilities within the offspring–mother–father trios at the used loci. Obviously, the potential of exclusion will be dependent on the number of candidates, the number of loci and the power of exclusion. The higher the number of candidate parents is, the larger the number of loci needed for excluding false parents would be. However, the strict exclusion principle is valid when no genotyping errors or null alleles exist at the markers used, which is not a realistic assumption. Paradoxically, the increase in the number of markers, necessary to gain allocation potential, unavoidably leads to a higher number of false exclusions. The introduction of certain flexibility in the system, permitting a predetermined number of incompatibilities, leads to lower power of detection.
An alternative approach corresponds to the maximum likelihood methods (Marshall et al., Reference Marshall, Slate, Kruuk and Pemberton1998). This methodology does not intend to exclude false parents, but to allocate the most probable one taking into account the genetic frequencies of a reference population, in addition to the genotypes of candidate parents and offspring. In this manner, the uncertainty associated to several compatible parents is overcome. On the other hand, the existence of genotyping errors will not preclude the identification of the true parent, which can still be the most probable solution. The likelihood, or probability, of each candidate parent (or couple) will be estimated as the probability of being the origin of the alleles shared per locus with the tested offspring. Usually, results are expressed as the ratio between the obtained likelihood and that of an individual taken at random from the reference population. This ratio is usually called paternity index. The random individual is created from the allele frequencies of the reference population assuming Hardy–Weinberg equilibrium. The software CERVUS is the most popular one applying this methodology, available for free at http://www.fieldgenetics.com/pages/home.jsp.
Until now, microsatellites have been the markers of choice for paternity analysis. They may be soon replaced by SNP panels in most domestic species (see for example Van Eenennaam et al., Reference Van Eenennaam, Weaber, Drake, Penedo, Quaas, Garrick and Pollak2007).
Coancestry estimation
When we are dealing with a group of individuals belonging to the same generation or individuals that cannot be separated into known generations, we would like to estimate the degree of genetic relationship between them, usually expressed as the coancestry coefficient. This may be required when starting a conservation programme where we would like to establish the relationships between the individuals without previous known pedigree history (founders). From this point onwards, the genealogy can be recorded and pedigree estimations performed in the usual way, but by accounting for the inferred coancestries between founders. The basic idea is to determine how much of the molecular similarity between and within individuals (IBS) is due to the IBD (Blouin, Reference Blouin2003; Weir et al., Reference Weir, Anderson and Hepler2006).
There are two groups of relationship estimators from the molecular information (Butler et al., Reference Butler, Field, Herbinger and Smith2004; Fernández and Toro, Reference Fernández and Toro2006). One of them includes methods directed at estimating coancestry for only a pair of individuals at a time, usually relying on the knowledge of the allele frequencies of the reference population. Pairwise estimators include similarity indices, developed for example to compare DNA fingerprints, and also the molecular coancestry (the application of Malecot definition of genealogical coancestry to molecular identity; Toro et al., Reference Toro, Barragán, Óvilo, Rodrigáñez, Rodriguez and Silió2002). A further division of estimators within this group differentiates those called Method of Moments Estimators and those based on MLE. In this kind of approach, the consideration of each pair independently of the rest of individuals may lead to incongruous assignations and aberrant coancestry matrices. For example, molecular information could be consistent with individuals A and B being full-sibs, and similarly with individuals B and C. However, this does not guarantee that individuals A and C will be correctly classified as full-sibs (Thomas and Hill, Reference Thomas and Hill2000, Reference Thomas and Hill2002; Rodríguez-Ramilo et al., Reference Rodríguez-Ramilo, Toro, Martínez, Castro, Bouza and Fernández2007).
The other group of methods uses jointly the information of all individuals to determine the more probable population/familiar structure (Butler et al., Reference Butler, Field, Herbinger and Smith2004; Fernández and Toro, Reference Fernández and Toro2006). Under this approach, we obtain a global structure of relationships, and thus the explicit reconstruction of the genealogy (at least for one generation). Therefore, estimated coancestry matrices are fully congruent, and so are also relationships for large familiar groups. The negative side of these methods is that they require more complex and computationally demanding calculations. Consequently, the method has been usually limited to simple population structures such as full-sib families.
The assumptions used in the development of any of the coancestry estimators (e.g. knowing the real allelic frequencies in the population) may lead to some limitations, which should be taken into account when choosing the estimator. A major problem that cannot be denied is that inferences in any of the cited estimators are performed on molecular data that we assume correct. However, molecular information may contain errors. This fact affects more severely the pedigree reconstruction estimators, and its effect (as already pointed out when talking about paternity analysis) is greater, the larger the number of markers genotyped is.
There are also empirical results on the above issues. Toro et al. (Reference Toro, Barragán, Óvilo, Rodrigáñez, Rodriguez and Silió2002) compared the coancestry between 62 Iberian pigs, using a pedigree going back 20 generations, with molecular coancestries estimated from 49 microsatellites. The correlation was high (about 0.90), but the results were severely biased as the inference required information on the true allelic frequencies of markers in the base population. Such frequencies are usually unknown. Slate et al. (Reference Slate, David, Dodds, Veenvliet, Glass, Broad and McEwan2004) examined 590 of the Coopworth sheep with seven generations of known pedigree and genotyped 101 microsatellites. The correlation between inbreeding calculated from pedigree and homozygosity calculated from markers was remarkably low (0.17). The general message is that it should be preferable to use pedigree information whenever available, and to limit the use of markers to verify, correct or to complete pedigree information, unless very large numbers of markers are available. It must be observed, however, that in the next years the picture will probably be changed. There is a real possibility of implementing thousand of SNPs markers (with the shortcoming of ascertainment bias) or even the sequencing of the whole genome. This is a fact in domestic species and it will occur for many other species in the near future. Under a massive number of SNPs or even the whole sequencing, the true coancestry is no longer the genealogical coancestry but the molecular one because it allows tracing individual portions of the genome and thus allows to set up different similarities between members of, for example, a full-sib group that have the same estimated coancestry values on the basis of genealogy.
Assessment of between-population and within-population variance
Neutral variation
The general aim of genetic conservation is to maintain within-breed and across-breed diversity. Within breeds, the diversity is important for the genetic adaptation of a population to changes in the production and economic environment, and for avoiding inbreeding problems. Across-breed diversity is important for providing alternative gene pools if there are breeds running into genetic problems because of genetic drift or if, because of changes in the production system, traits would need improvement via introgression schemes. The total genetic diversity (GDT) can be split into a within-breed and between-breed genetic diversity component (Toro and Caballero, Reference Toro and Caballero2005):

In the context of prioritizing breeds, a weighted combination of the within-breed and between-breed components of gene diversity can be considered:

where λ is a weight given to the within-breed genetic diversity;  i.e. the within-population heterozygosity averaged across populations and loci; and GDB is the numerator of Wright's Fst, which is the degree to which the alleles have become fixed:
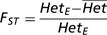
where  is the expected heterozygosity given the overall allele frequency
 Thus,
 Although different weights of λ have been proposed in the literature, consensus seems to move towards the ‘total genetic variance of a hypothetical trait’ (TGV) criterion (Bennewitz and Meuwissen, Reference Bennewitz and Meuwissen2005; Meuwissen, Reference Meuwissen2009), which uses λ = 0.5. This criterion maximizes the genetic variance across the populations and thus the response from across population selection. Bennewitz et al. (Reference Bennewitz, Simianer and Meuwissen2008) showed how the TGV could be partitioned into between- and within-population genetic variance, and that TGV = 2GDT with λ = 0.5.
Adaptive variation
Genetic diversity/genetic uniqueness is only one of the several reasons for genetic conservation. Additional reasons are (i) adaptation to a specific environment; (ii) possession of traits of current or future economic importance; and (iii) possession of unique traits that may be of scientific interest (Ruane, Reference Ruane1999). Instead of maintaining neutral genetic diversity, these reasons aim at maintaining genetic diversity for specific traits or adaptive genetic diversity. Mostly, the ‘specific traits’ will be quantitative traits, so we will address the conservation of quantitative variation here.
Quantitative genetic variation is the basis of productive and reproductive traits, and therefore monitoring quantitative genetic diversity may reveal variation more closely related to fitness or to the characteristics that made a breed profitable, yielding more interesting information (Lynch, Reference Lynch1996). The parameters reflecting the amount of genetic diversity for a polygenic trait within a population are the additive variance (Vw) or the heritability (h 2) as the proportion of the phenotypic variance for the trait explained by Vw. These parameters allow estimating the ability of the studied population to respond to selection on the target trait, and therefore may be useful tools in determining the probability of success of the selection scheme and the population. Next to the within-population genetic variance, the between-population genetic variance Vb is needed. Both Vw and Vb can be estimated from the model:

where yij is the phenotype of animal j in breed i (collected across several breeds); bi is a random breed effect with variance Vb; aij is the genetic effect of animal j within breed i with variance Vw and correlation matrix A, i.e. the relationship matrix of the animals; and eij are independent identical distributed environmental effects with variance Ve. The variance components Vb, Vw and Ve can be estimated by a variance component analyses using Restricted Maximum Likelihood (e.g. by the ASREML computer package).
In parallel to what occurs for molecular measures of neutral diversity, we can also define a measure of population differentiation on the basis of the quantitative trait, called QST (Spitze, Reference Spitze1993), defined as QST = Vb/(Vb + 2Vw). This measure can be used to establish the relationship between subpopulations (breeds), and eventually can guide us in prioritizing or merging of the breeds. An important question, for example, is the proportion of total genetic variation corresponding to variation between breeds. For a particular trait, Vb gives an indication of how much progress in a trait may be obtained by selection among breeds, and its utilization has ultimately led to breed substitution with many breeds considered unprofitable, and consequently at risk of extinction. However, if crises were to occur that required livestock production to adapt quickly to new challenges, then conserving breeds with diversity of characteristics (although with a low performance for the selected trait) is a rational and an important strategic response. The square root of the total genetic variance (TGV = Vw + Vb) for the traits is proportional to the response to selection across the breeds. Woolliams and Toro (Reference Woolliams and Toro2007) reviewed the few experiments of multibreed comparisons and concluded that the range of values for Vb/(Vb + Vw) remains poorly documented but provide justification for the broad statement that breed variation accounts for approximately half of the total genetic variation for most traits.
The estimates obtained using molecular markers are usually intended to be indirect ways to measure variation for all genomic positions, and consequently for polygenic traits also. The relationship between the degree of divergence in neutral markers and the degree of divergence for quantitative traits can be addressed comparing FST and QST indices. For genes that are neutral for fitness, with additive action between and within loci for some trait, heterozygosity and additive variance behave in parallel. Accordingly, it is expected that FST = QST. For traits under divergent selection pressure between populations, QST is expected to be greater than FST, whereas QST < FST would indicate that selection acts on the trait towards the same optimal phenotype. This kind of comparisons may be used to detect local adaptations of breeds that are worthy to be kept, even if their global genetic diversity is low and the risk of extinction is high. The above predictions are based exclusively on additive gene action for the quantitative trait and Hardy–Weinberg equilibrium. Non-additive genetic components and uncontrolled maternal and common environmental effects can potentially modify the expectations. The very large variance in both QST and FST are suggesting that we should be cautious in attributing small differences between QST and FST to selection. (López-Fanjul et al., Reference López-Fanjul, Fernández and Toro2003; Santure and Wang, Reference Santure and Wang2009).
Neutral v. adaptive or deleterious variation
In population genetics, neutral variants are those whose selection coefficients are smaller than 1/(2Ne). This means that, in small endangered populations, genetic variants are more likely to be effectively neutral because of the reduced population size. Strictly neutral variation would be of prime interest in order to carry out genetic analysis of population structure or history. It allows for the identification of ancestral populations still holding alleles that are of economic value and have been lost by chance during domestication. Neutral variants have also been used as a surrogate of non-neutral variation, either deleterious or adaptive. Although neutral and non-neutral diversity are expected to be correlated because of the disequilibrium generated by random drift or hitchhiking effects, their comparison could be also misleading because adaptive variants might differ in mutation rates and in selective regimes (Hedrick, Reference Hedrick2001). As a large number of highly polymorphic markers are now available, the statistical power to detect differentiation between groups is very high. The problem is to know whether such differentiation reflects meaningful differences. In parallel, there could be no significant differences on the basis of molecular markers but some important loci might be highly differentiated because selective forces are strong enough at such loci to overcome the effects of low effective size, gene flow or short divergence time. Adaptive variation can provide new criteria and measurements to back-up conservation or breeding decisions. Differences between populations that are functional rather than neutral can be required, either for individual loci or genome regions. One way of approaching the problem is to use the existing markers associated with known functional genes to characterize the populations, as it is planned in some recent biodiversity projects. The second way of finding adaptive variation is to identify regions that have been subject to selection, so-called signatures of selection in the genome. Unlike demographic processes, which affect the entire genome, selection affects specific loci seen as reduced level of variability and increased linkage disequilibrium and as increased genetic differentiation between populations. This approach is particularly promising when we are able to compare the wild ancestor, local ‘unimproved’ breeds and highly selected lines as, for example, is the case in the pig. A matter of the utmost importance is how to distinguish the selection signature from demographic (neutral) processes. To do that, it is important to analyse several genomic regions and characterize the expected variability under plausible models using coalescence-based techniques (Hein et al., Reference Hein, Schierup and Wiuf2005). When a locus shows extraordinary levels of differentiation between populations, measured for example by FST in comparison with other loci, this may be interpreted as evidence for selection of an allele in one of the populations. A classical test of neutrality (Lewontin and Krakauer, Reference Lewontin and Krakauer1973) exploits this fact. The idea behind this is to compare the observed distribution of FST values or other population parameters from markers with that expected under the neutral hypothesis for different demographic scenario, to identify the loci that significantly deviate from neutrality. Putative adaptive markers could be removed from the computation of neutral differentiation and used as indicators of adaptive differentiation. It seems likely that the characterization of diversity in future works will include an increasingly high use of adaptive variation, through the analysis of specific genes, quantitative traits or outlier markers, in combination with neutral variation. Adaptive variation can provide new criteria and measurements to back-up conservation decisions. In the context of natural populations, Bonin et al. (Reference Bonin, Nicole, Pampanon, Miaud and Taberlet2007) have developed a Population Adaptive Index (PAI) to give priority to populations for conservation. The PAI is calculated as the percentage of adaptive loci (loci detected as outliers with respect to the neutral prediction) with allelic frequencies significantly different from those in the other populations.
Conclusions
Although there are many scientific and social issues involved in the conservation of animal genetic resources, there is a consensus that the maintenance of genetic variation is of paramount importance. However, the starting point for correct management of genetic diversity should be the assessment of the genetic diversity in the populations. There are several measures of genetic variation on the basis of pedigree recording, molecular markers or demographic information. Up to now, the most interesting ones are the rate of inbreeding and coancestry (or effective population sizes) on the basis of genealogical information. Across-breed diversity is also important and there are tools to analyse it. However, in the near future, under a massive number of SNPs genotyped, molecular inbreeding and coancestry will be the relevant parameters. On the other hand, these new technologies will allow to take into account the adaptive variation across breeds.
Acknowledgements
This work was carried out in the action EURECA 012 AGRI GEN RES 870/2004 and received financial support from the European Commission, Directorate-General for Agriculture and Rural Development, under Council Regulation (EC) no. 870/2004. The EURECA project is coordinated by Sipke-Joost Hiemstra at Centre of Genetic Resources (The Netherlands). The authors received valuable comments from J.J. Colleau and J. Windig on an earlier version of the text.