Milk yield greatly depends on mammary lactose synthesis due to its osmolality property that induces uptake of water in the Golgi apparatus of the mammary epithelial cells. Therefore, the rate of lactose synthesis in the epithelial cells of the mammary gland serves as a major factor influencing milk volume. The supply of glucose for lactose synthesis increases dramatically in the mammary gland of lactating animals. It has been estimated that mammary tissue extracts 60–85% of glucose from blood (Annison & Linzell, Reference Annison and Linzell1964). Since glucose is the main precursor for lactose synthesis, the uptake of glucose by the mammary gland can play a major role in regulating the final milk volume. Therefore, modulating the glucose uptake by the mammary gland ultimately should improve dairy productivity and efficiency of milk production.
Among the three Peroxisome Proliferator-Activated Receptor (PPAR) isotypes (Bionaz et al. Reference Bionaz, Chen, Khan and Loor2013), PPARβ/δ can affect glucose uptake. This was demonstrated in bovine aortic endothelial cells where activation of PPARβ/δ as a consequence of high-glucose decreased the amount of mRNA coding for the solute carrier family 2 member 1 (SLC2A1) also called GLUT1 (Riahi et al. Reference Riahi, Sin-Malia, Cohen, Alpert, Gruzman, Eckel, Staels, Guichardant and Sasson2010), which is among the most important glucose transporter in bovine mammary tissue (Bionaz & Loor, Reference Bionaz and Loor2011). The decreased mRNA of SLC2A1 was the result of an increase in expression of calreticulin via activation of PPARβ/δ (Riahi et al. Reference Riahi, Sin-Malia, Cohen, Alpert, Gruzman, Eckel, Staels, Guichardant and Sasson2010). Calreticulin is a protein that destabilises GLUT1 mRNA increasing its degradation (Totary-Jain et al. Reference Totary-Jain, Naveh-Many, Riahi, Kaiser, Eckel and Sasson2005). The expression of PPARβ/δ gene is very abundant and is significantly down-regulated from pregnancy to lactation in bovine mammary tissue concomitantly with an up-regulation of several genes related to glucose transport including SLC2A1 (Bionaz & Loor, Reference Bionaz and Loor2011; Bionaz et al. Reference Bionaz, Periasamy, Rodriguez-Zas, Everts, Lewin, Hurley and Loor2012). Even though immortalised bovine mammary cells are not ideal model to study the mammary biology due to difference in the relative expression of lactation-specific genes, including several glucose transporters (Hosseini et al. Reference Hosseini, Sharma, Loor and Bionaz2013), the expression of PPARD and calreticulin is very similar with mammary tissue (described in online Supplementary File).
Based on the above we hypothesised that PPARβ/δ plays a role in modulating glucose uptake in bovine mammary epithelial cells affecting synthesis of lactose (Supplementary Fig. S1). In order to test the hypothesis we used bovine mammary epithelial cells to assess: (1) the most effective dose to inhibit PPARβ/δ activity among two synthetic antagonists; (2) the effect of PPARβ/δ modulation on expression of glucose metabolism-related genes; (3) glucose uptake and lactose synthesis in media of cells cultured in plastic dishes or Matrigel.
Materials and methods
Cell culture, transfection, and treatments
Immortalised bovine mammary alveolar cells (MACT) and primary bovine mammary epithelial cells (PBMC) previously isolated from a Chinese laboratory (Hu et al. Reference Hu, Wang, Bu, Wei, Zhou, Li and Loor2009) were used for the experiments. See online Supplementary File for details of cell culture.
Experiment 1
Approx. 25 000 cells/well counted using Moxi(Z) (Orflo Technologies, Ketchum, ID) were plated in 96-well plate with high glucose DMEM media containing 10% FBS. Twenty-four hours later the cells were co-transfected with a plasmid containing luciferase driven by a PPAR Response Element and a plasmid constitutively expressing renilla as previously described (Osorio & Bionaz, Reference Osorio and Bionaz2017). After 24 h, the cells were placed into media with or without FBS.
Treatments without FBS
The cells were treated either with PPARβ/δ antagonists GSK-3787 (cat#2400, Biovision Incorporated) and PT-s58 (Cat#SML0410, Sigma-Aldrich, USA) in quadruplicates at 10, 100, 1000 and 10 000 nm solubilised in 200 proof ethanol, 1000 nm of the PPARβ/δ agonist GW501516 (Cat#420-032, Enzo Life Sciences, USA), or only media in high-glucose DMEM media without FBS. In order to ascertain the best dose with the highest inhibition of PPARβ/δ by both antagonists, 1000 nm of GW501516 was added to the DMEM without FBS for all treatments except for the only media treatment. The media containing only 1000 nm of GW501516 without FBS is the true control (CTR) for Experiment 1.
Treatments with 10% FBS
In cells treated with DMEM media with FBS, 100 µm of the PPARγ antagonist T0070907 (cat#89158-802, Enzo Life Technologies) and 1 µm of the PPARα antagonist GW6471 (cat#4618/10, Tocris Bioscience, USA) were added to avoid activation of the two PPAR isotypes by FBS to better detect the effect of PPARβ/δ in all treatments (except for ethanol control and FBS control). The media with 10% FBS containing PPARα and PPARγ antagonists only was used as a control (CTR).
In all treatments, 30 nm of cis-9-retinoic acid (Cat#GR101, Enzo Life Sciences) was added to maximise PPAR activation (Wang et al. Reference Wang, Chao, Wu, Tseng, Kuo and Tsou2010). Twenty-four hours post treatment cells were counted using a fluorescent nuclear staining and luciferase and renilla activity measured as described previously (Osorio & Bionaz, Reference Osorio and Bionaz2017).
Experiment 1 re-run using a digital dispenser
Based on the results from the gene expression analysis we re-run Experiment 1 in MACT cells with or without FBS as described above using the HP D300e Digital Dispenser (generously provided as demo for the experiment by Kenneth J. Ward, HP Inc.) with the following differences: for the experiment without FBS we did not treat all the cells with the PPARβ/δ agonist GW501516, instead, only four replicates without FBS were treated with 1000 nm of the PPARβ/δ agonist GW501516 and all treatments were diluted in DMSO and the amount of DMSO was normalised across all wells.
Experiment 2
Approximately 20000 MACT and PBMC cells were plated in 24-well plates (cat#662160, Greiner Bio-one GmbH, Firckenhausen, Germany). Before starting the experiment, cells were induced into lactation as previously described (Kadegowda et al. Reference Kadegowda, Bionaz, Piperova, Erdman and Loor2009).
Based on the results of Experiment 1, the cells were treated in quadruplicates with GW501516 at 1000 nm, GSK-3787 at 1000 nm and their combination (GW501516 + GSK-3787 at 1000 + 1000 nm), and ethanol as control. After 24 h treatment, the media was collected in 1·7 ml centrifuge tubes (cat# 22-281, Olympus, USA) and stored at −20 °C for <2 months before analysis. The number of cells was counted as described above. In order to have an additional independent way of determining the number of cells, 200 µl/well of 0·25% trypsin was used in the 4th replicate well of each treatment, cells were resuspended in 500 µl of media and counted using Moxi(Z). For the other replicates, cells were harvested using 500 µl of TRIzol® reagent (Life Technologies, Carlsbad, CA) and stored at − 80 °C until RNA extraction. Glucose in the media was measured using Glucose Colorimetric Assay Kit (cat#10009582-192, Cayman Chemical, USA) following the manufacturer's instructions in association with a SpectraMax Plus 384 UV/Vis cuvette/microplate reader (Molecular Devices, USA). Lactose was measured using the Lactose Colorimetric/Fluorometric Assay Kit (cat#K624-100, BioVision, USA) following manufacturer's instructions and quantification was performed using a Biotek Synergy 1 plate reader (generously provided by Dr Brett Tyler, Oregon State University). The final values of ng of glucose taken up by the cells were obtained as [(ng glucose in the original media per well – ng glucose in media after 24 h treatment per well)/number of cells per well], pg of lactose/cell [(pg lactose/well)/(number of cells/well)], and % of glucose used for lactose synthesis [(ng lactose/cell)/(ng glucose uptake/cell) × 100].
Experiment 3
Approximately 20000 cells were plated in 96-well BioCoat™ Matrigel® (cat#354607, Corning, USA) plates in quadruplicates using DMEM + 10% FBS for seven days, followed by an induction into lactation as described above prior treatment with PPARβ/δ modulators as for Experiment 2. Media were collected from each well for determination of glucose and lactose concentration as described above. The cells were then harvested using 0·25% trypsin (100 µl/well). Number of cells was counted using Moxi(Z).
Primers, RNA Extraction, cDNA synthesis and Real-Time PCR
Total RNA was extracted from the cells using TRIzol reagent as previously described (Bionaz & Loor, Reference Bionaz and Loor2007). Genomic DNA was removed with DNase using Zymo Mini Kit columns (Genesee Scientific, USA). The concentration of RNA was determined by the SpectraMax Plus 384 microplate reader. The 260/280 ratio was 1·98 ± 0·16. RNA quality was assessed via Agilent Bioanalyzer 2100 at the Center for Genome Research and Biocomputing, Oregon State University. The RIN was ≥ 8·8. Complementary DNA (cDNA) synthesis and qPCR were performed as previously described (Rosa et al. Reference Rosa, Osorio, Trevisi, Yanqui-Rivera, Estill and Bionaz2017) with a 1 : 10 dilution of cDNA prior qPCR. See online Supplementary Table S1 for list of primer-pairs used for the present experiment and for full name of the transcript measured. The primers not previously designed and validated were designed and validated as previously described (Bionaz & Loor, Reference Bionaz and Loor2007). The raw data of qPCR were analysed with LinRegPCR software (Ruijter et al. Reference Ruijter, Ramakers, Hoogaars, Karlen, Bakker, van den Hoff and Moorman2009). geNorm (Vandesompele et al. Reference Vandesompele, De Preter, Pattyn, Poppe, Van Roy, De Paepe and Speleman2002) was used to identify the best reference genes among 5 potential internal control genes (B2M, EIF3K, GAPDH, RPS15A, and UXT). The best normalisation was obtained by separating the geNorm analysis between the two cell types. In both cells a reliable normalisation factor was obtained using the geometrical mean of three transcripts. For MACT cells, the V-value was 0·084 using GAPDH, RPS15A, and UXT; for PBMC the best normalisation was obtained by using B2M, EIF3K, and UXT with a V-value of 0·069.
Statistical analysis
Prior to statistical analysis data were checked for outliers using PROC REG of SAS 9·4(SAS Institute, Inc., Cary, NC, USA). Data with a studentised t > 3·0 were removed. The GLM procedure was used to evaluate the treatment effect for all the parameters measured and the differences between cell types and type of well plates (i.e., plastic or Matrigel). Fixed effects in the model were treatments or cell type × type of well plate, whereas the random effects were replicates (n = 4 replicates/treatment). Significance was declared at P ≤ 0·05.
Results
Experiment 1
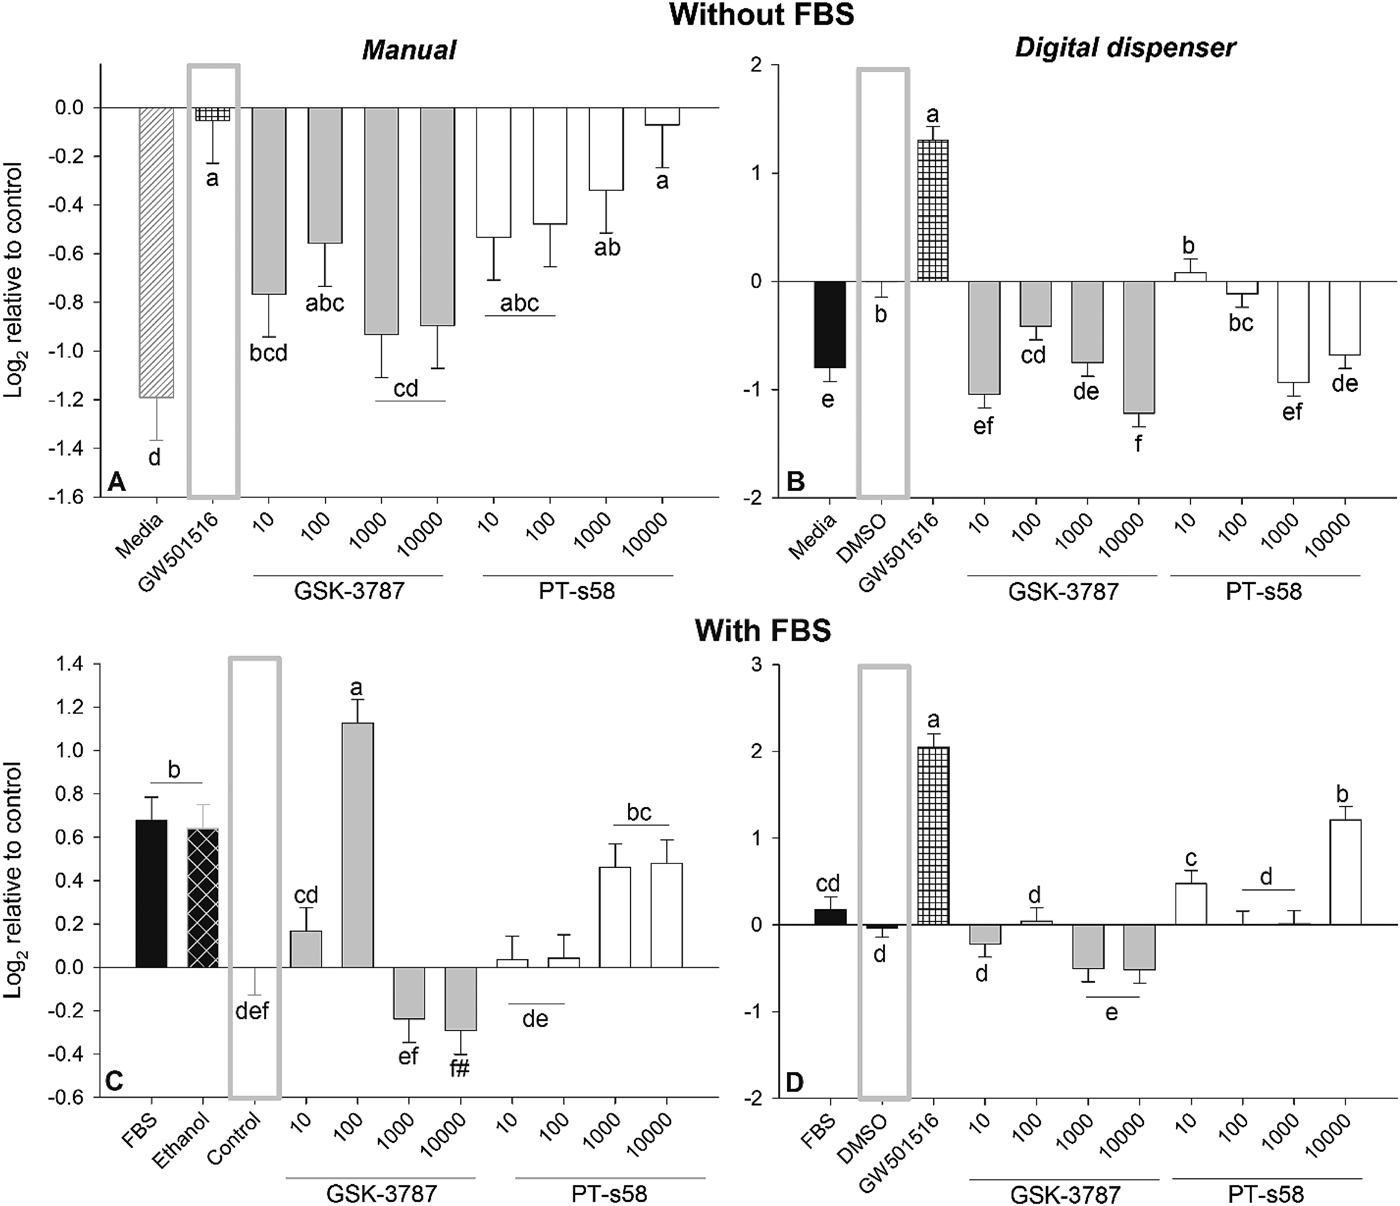
Significant activation of PPARβ/δ was obtained by GW501516, as expected, since it is a potent and specific PPARβ/δ agonist (Oliver et al. Reference Oliver, Shenk, Snaith, Russell, Plunket, Bodkin, Lewis, Winegar, Sznaidman, Lambert, Xu, Sternbach, Kliewer, Hansen and Willson2001) (Fig. 1).When a manual addition of modulators was performed and in the absence of FBS only GSK-3787 with doses of 10, 1000, and 10 000 nm significantly (P < 0·05) inhibited PPAR activation in the presence of the PPARβ/δ agonist (Fig. 1a). The inhibition of the PPAR activation by doses ≥ 1000 nm of GSK-3787 was >80%. In the presence of 10% FBS and the inhibitors of PPARα and PPARγ there was a numerical but non-significant inhibition of PPARβ/δ with 1000 and 10 000 nm of GSK-3787, respectively (Fig. 1c).
Determination of best dose to inhibit PPARβ/δ in bovine mammary cells. MACT cells transfected with luciferase and renilla plasmids in 96 well plates (see Materials and Methods) were cultivated in (A and B) high-glucose DMEM without FBS or (C and D) with 10% FBS plus PPARα and PPARγ inhibitors. Figure a and c depict the results of manual addition of treatments. Figure b and d depicts the results of addition of treatments using the HP D300e Digital Dispenser. In quadrant A the cells were treated with only media plus ethanol, 1000 nm of the PPARβ/δ agonist GW501516, or various concentration (in nm) of the PPARβ/δ antagonists GSK-3787 or PT-s58 in media containing 1000 nm of the PPARβ/δ agonist GW501516. In quadrant C, cells were treated with media containing 10% FBS. Treatments were only media (i.e., FBS), media + ethanol, media + ethanol + 100 µm of PPARγ inhibitor T0070907 + 1 µm of PPARα antagonist GW-6471 (i.e., Control), and the media Control + various doses (in nm) of the PPARβ/δ antagonists GSK-3787 or PT-s58 . In quadrant B, cells were treated with only media without FBS (i.e.., Media), media + DMSO, DMSO + media + 1000 nm of GW501516, and DMSO + media + various doses (in nm) of the PPARβ/δ antagonists GSK-3787 or PT-s58. In quadrant D, cells were treated as experiment in quadrant C but using DMSO instead of ethanol. The grey box denotes the true control for each experiment. All treatments were run in quadruplicates. Different letter denotes a significant difference with P ≤ 0·05 and # denotes a tendency to have a difference of P ≤ 0·10 compared to the control.

When similar treatments were performed using the digital dispenser, the inhibition of PPARβ/δ by ≥ 1000 nm of GSK-3787 and 10 and 10 000 nm of PT-s58 was detected (Fig. 1b). When FBS was present, the dose of GSK-3787 ≥ 1000 nm significantly (P < 0·05) inhibited PPARβ/δ while PT-s58 failed to significantly inhibit the same PPAR isotype (Fig. 1d).
Overall, the larger inhibition of PPARβ/δ was obtained by ≥ 1000 nm of GSK-3787, which was consistent and independent of the presence of FBS in all experiments. The observed effect was not due to changes in cell number because none of the treatments had a significant effect on cell numbers (online Supplementary Fig. S2). Based on all of above we decided to use the 1000 nm GSK-3787 for the subsequent experiments.
Experiment 2
Effect of PPARβ/δ modulation on the transcriptome
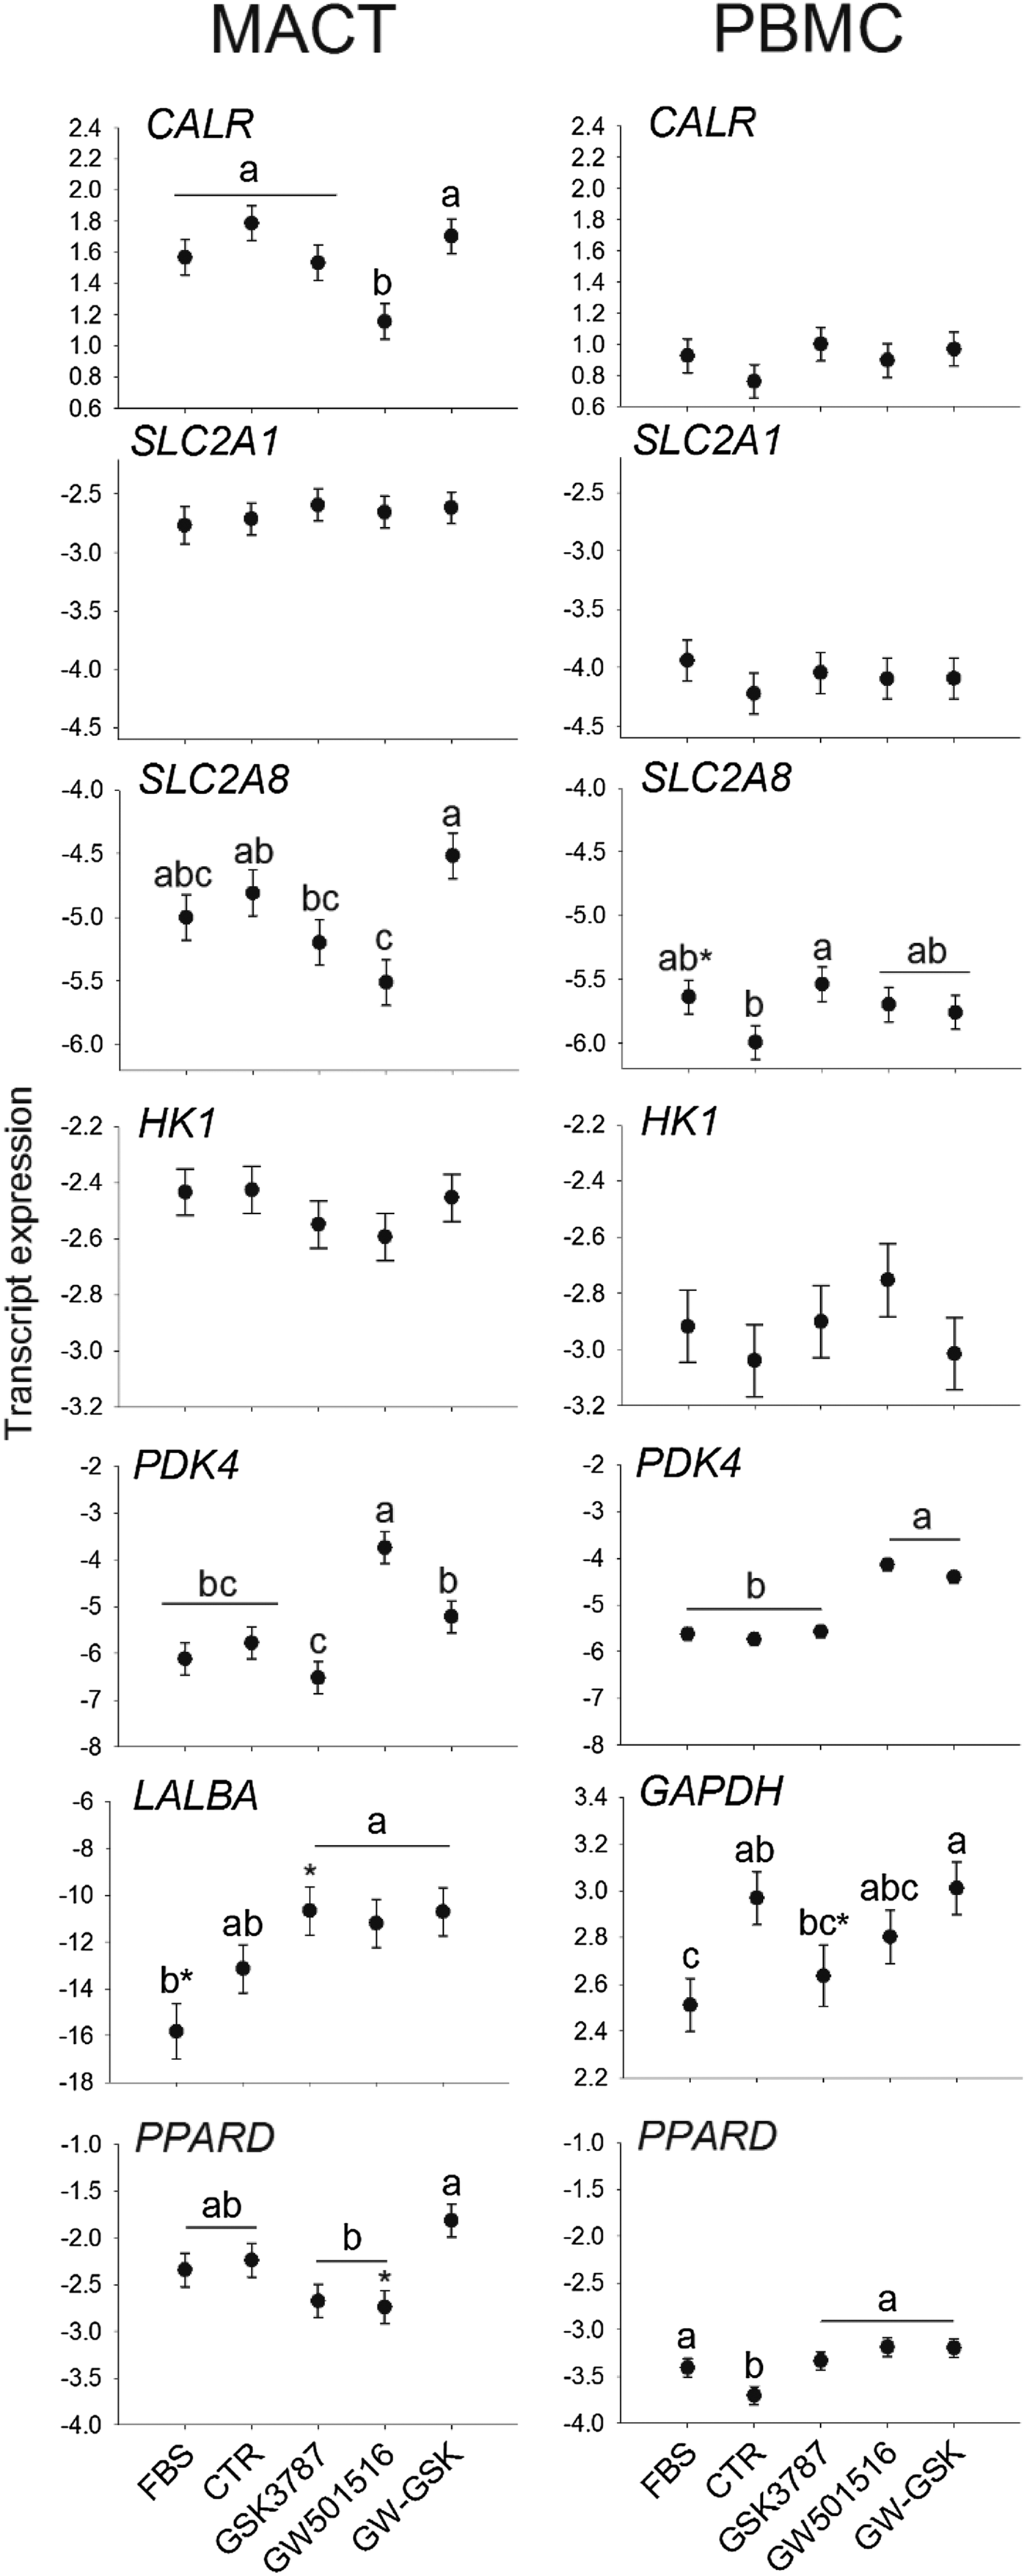
Figure 2 depicts the effect of the treatments on the transcript abundance of genes related to glucose metabolism. The use of the PPARβ/δ agonist significantly (P < 0·05) decreased the transcription of CALR compared to CTR, but only in MACT cells. The transcript abundance of GLUT8 (SLC2A8) was only significant (P < 0·05) down-regulated in comparison to CTR by the activation of PPARβ/δ in MACT cells while in PBMC the abundance of the same transcript was increased compared to CTR (P < 0·05) by inhibition of PPARβ/δ.
Effect of PPARβ/δ modulation on transcription of genes related to glucose metabolism and lactose synthesis in bovine mammary cells. The effect of treatments (X-axis) was assessed on the expression of various genes (Y-axis; see gene symbol in the graph). Cells were cultivated in a lactogenic media and treatments included only 10% fetal bovine serum (FBS), FBS + ethanol (i.e., true control, i.e., CTR), or 1000 nm of the PPARβ/δ antagonists GSK-3787, 1000 nm of the PPARβ/δ agonist GW501516, or a combination of the two. In MACT cells, the GAPDH was used as internal standard (thus, not present in the results) and LALBA was low expressed but detectable. In PBMC cells, GAPDH was used as target genes and LALBA was below the limit of detection. Letters denote difference with a P ≤ 0·05 and *denotes tendency P ≤ 0·10 compared to the control (i.e., CTR).

The transcript of LALBA was below the limit of detection in PBMC (i.e., Cq>32) but detectable in MACT; however, it was not significantly affected compared to CTR (P > 0·05) by the modulation of PPARβ/δ in MACT cells. For the PBMC we also used GAPDH as a target gene but this was not affected significantly by PPARβ/δ modulation.
Activation of PPARβ/δ by GW501516 in MACT and PBMC increased the transcript abundance of PDK4. The use of the PPARβ/δ inhibitor failed to significantly reduce the expression of PDK4, with only a numerical (non-significant) lower expression compared to CTR in MACT cells.
In MACT cells, PPARD expression was not significantly affected by the modulation of PPARβ/δ while in PBMC it was increased by the use of PPARβ/δ agonist, antagonist, and the combination of the two (Fig. 2). No other effects were detected.
Overall, data of the present work indicated that the dose of GSK-3787 inhibited the transactivation of PPARβ/δ (see Experiment 1) but failed to consistently affect the expression of the PPARβ/δ target gene PDK4 (Ordelheide et al. Reference Ordelheide, Heni, Thamer, Machicao, Fritsche, Stefan, Haring and Staiger2011).
Effect of PPARβ/δ modulation on glucose uptake and lactose yield
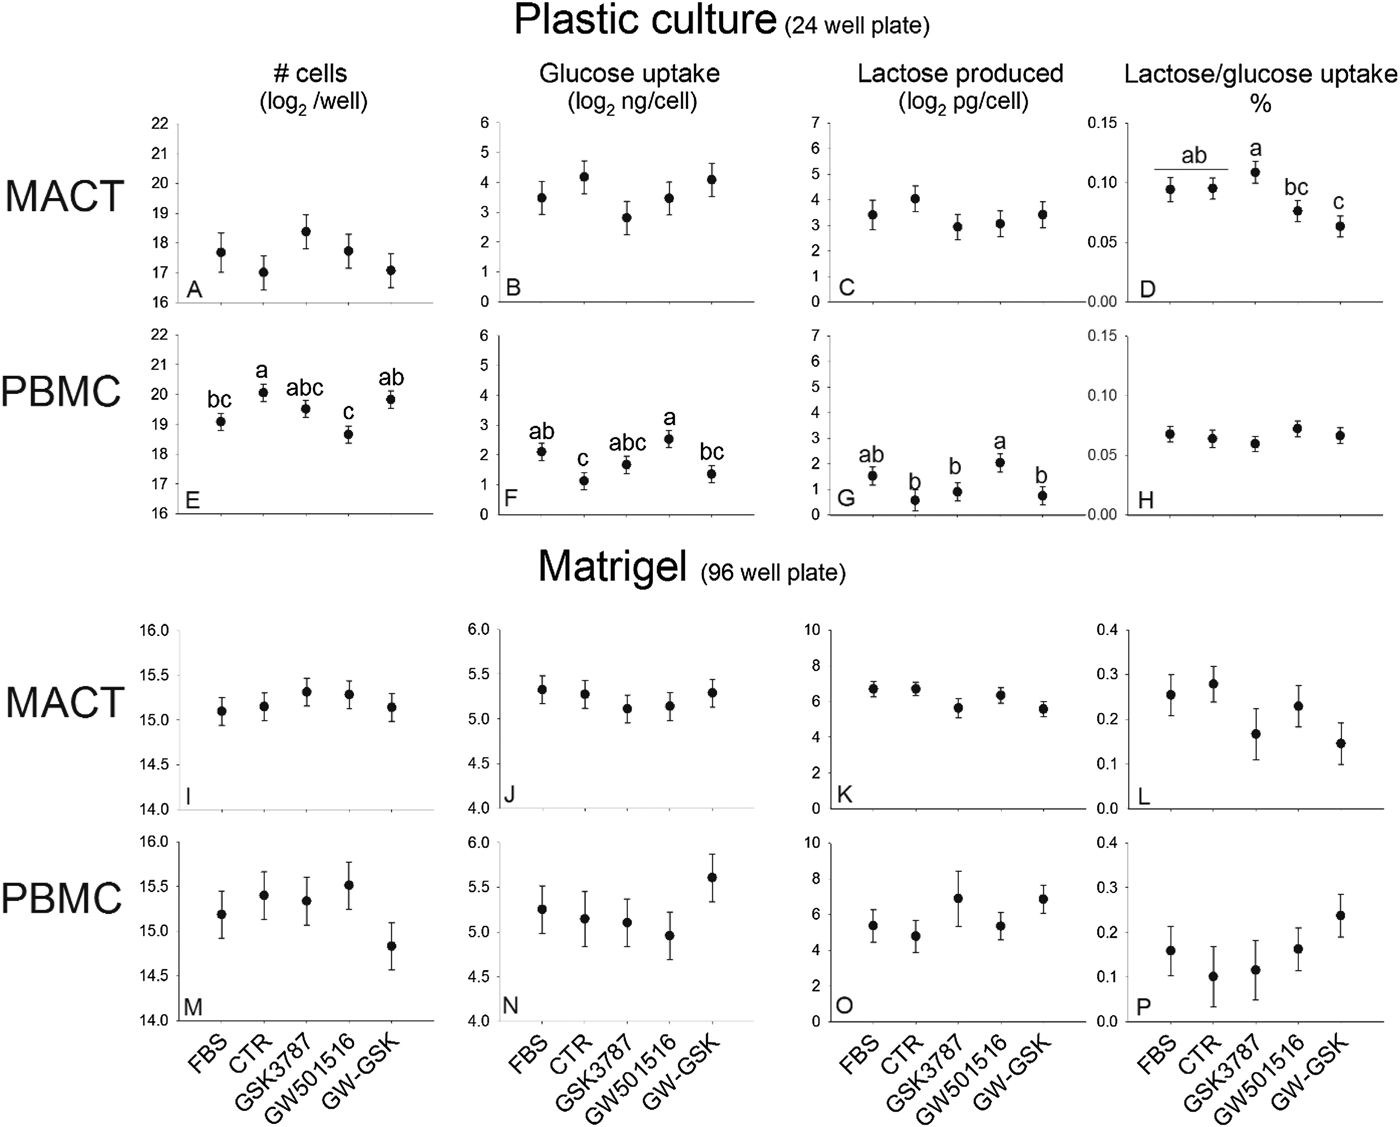
As for the gene expression, we detected an inconsistent response on glucose uptake and lactose synthesis of the type of bovine mammary cells to the treatments (Fig. 3). In MACT cells cultivated in plastic the modulation of PPARβ/δ did not significantly affect the glucose uptake, lactose produced, or the number of cells. The inhibition of PPARβ/δ had a larger amount of glucose used for lactose synthesis compared to the activation of PPARβ/δ or the combination of the inhibitor and activator of PPARβ/δ (Fig. 3d). In PBMC cells cultivated in plastic we detected an overall lower number of cells, higher amount of glucose uptake per cell, and greater lactose production per cell with the use of the PPARβ/δ agonist compared to the control or the use of the combination of PPARβ/δ agonist and antagonist (Fig. 3e–g).
Effect of PPARβ/δ modulation on cell number, glucose uptake, and lactose synthesis in bovine mammary cells. MACT and PBMC cells were cultivated in a lactogenic media and treated with only 10% fetal bovine serum (FBS), FBS + ethanol (i.e., true control), or 1000 nm of the PPARβ/δ antagonists GSK-3787, 1000 nm of the PPARβ/δ agonist GW501516, or a combination of the two. Parameters were measured in cells cultivated in plastic (i.e., 24 well plate) or in Matrigel (i.e., 96 well plate). Letters denote difference with a P ≤ 0·05.

Experiment 3
PBMC cultivated in Matrigel tended to form tridimensional structures (online Supplementary Fig. S3), but they failed to produce a clear alveoli-like structure as expected (Jedrzejczak & Szatkowska, Reference Jedrzejczak and Szatkowska2014). We did not observe any tridimensional structure formation by MACT cells. Despite this, compared to cultivation in plastic, both cell types had a significant larger uptake of glucose, secretion of lactose, and utilisation of glucose to produce lactose when cultivated in Matrigel vs. plastic (online Supplementary Fig. S4). The modulation of PPARβ/δ had no effects on cell numbers, estimated glucose uptake/cell and lactose synthesis/cell in MACT or PBMC cells compared to control (Fig. 3i–p).
Overall, MACT cells had larger glucose uptake and lactose production compared to PBMC when cultivated in Matrigel, but no difference was observed when cultivated in plastic (online Supplementary Fig. S4). However, compared to PBMC, MACT cells had overall larger expression of all the measured genes involved in glucose metabolism, with the exception of PDK4 which was similar between the two cell types (online Supplementary Fig. S4). Among all target genes measured the CALR was the most abundant.
Correlation analysis
Results of the correlation analysis between gene expression data and the glucose uptake, cell number, lactose synthesis in cells cultivated in plastic are reported in Supplementary Fig. S5. The correlation data are indicative of a positive association between the transcripts PPARD and CALR with lactose synthesis. Furthermore, the data also indicated a positive role of glucose import via glucose transporters and lactose synthesis, with the expression of SLC2A1 being more associated with the use of glucose for the synthesis of lactose compared to the expression of SLC2A8. Furthermore, the data do not support calreticulin being a negative regulator of GLUT1 transcript abundance.
Discussion
Modulation of PPARβ/δ by synthetic compounds.
In monogastrics, GSK-3787 is a potent PPARβ/δ inhibitor but can also inhibit, although with substantially lower potency, PPARγ, but does not affect PPARα activity (Palkar et al. Reference Palkar, Borland, Naruhn, Ferry, Lee, Sk, Sharma, Amin, Murray, Anderson, Perdew, Gonzalez, Muller and Peters2010). Our data clearly indicated that the GSK-3787 at concentration of ≥ 1 µm is an effective PPARβ/δ antagonist, confirming data obtained in monogastrics where a lower concentration (i.e., 0·1 µm) was effective (Palkar et al. Reference Palkar, Borland, Naruhn, Ferry, Lee, Sk, Sharma, Amin, Murray, Anderson, Perdew, Gonzalez, Muller and Peters2010). In our case the 0·1 µm concentration of GSK-3787 was less effective than 0·01 µm of the same compound in the absence of FBS but the antagonist effect disappeared or the compound had an agonist effect in the presence of 10% FBS. Based on the above observations, we can conclude that GSK-3787 is less potent as PPARβ/δ antagonist in ruminants, specifically mammary cells from bovine, compared to monogastrics. This is also supported by the lack of decrease of the transcription of PDK4 by GSK-3787. This might also be due to the activation of PPARα by the 10% FBS present in the medium (Bionaz et al. Reference Bionaz, Osorio and Loor2015; Song et al. Reference Song, Attia, Connaughton, Niesen, Ness, Elam, Hori, Cook and Park2010). Our data also confirmed the lack of any toxic effect on bovine mammary cells by the GSK-3787 (Palkar et al. Reference Palkar, Borland, Naruhn, Ferry, Lee, Sk, Sharma, Amin, Murray, Anderson, Perdew, Gonzalez, Muller and Peters2010).
PT-S58 has been shown to be a potent and specific PPARβ/δ inhibitor but with a significant, although small, inhibition of PPARα in monogastrics (Naruhn et al. Reference Naruhn, Toth, Adhikary, Kaddatz, Pape, Dorr, Klebe, Muller-Brusselbach, Diederich and Muller2011). Our data did not support PT-s58 being an effective PPARβ/δ antagonist in ruminant cells.
Modulation of PPARβ/δ and glucose metabolism.
Our data did not confirm prior data indicating that PPARβ/δ is an activator of the transcription of CALR (Riahi et al. Reference Riahi, Sin-Malia, Cohen, Alpert, Gruzman, Eckel, Staels, Guichardant and Sasson2010) and did not confirm that calreticulin is a negative regulator of GLUT1. All the above were fundamental factors in the support of the hypothesis of the present paper. Discrepancy of our data compared to what has previously been reported (Totary-Jain et al. Reference Totary-Jain, Naveh-Many, Riahi, Kaiser, Eckel and Sasson2005; Riahi et al. Reference Riahi, Sin-Malia, Cohen, Alpert, Gruzman, Eckel, Staels, Guichardant and Sasson2010) is difficult to explain. Prior data were all generated in bovine endothelial cells, while we used bovine mammary cells. Our cells were kept in high glucose medium, which is similar to the conditions of the studies in bovine endothelial cells (4·5 g/l or 25 mmol/l glucose) (Riahi et al. Reference Riahi, Sin-Malia, Cohen, Alpert, Gruzman, Eckel, Staels, Guichardant and Sasson2010). However, in contrast to epithelial cells, endothelial cells in vivo are rapidly exposed to high glucose concentrations post-prandial due to the direct contact with the circulating blood that can easily reach 7–8 mmol/l in healthy human subjects and 4·6 mmol/l in dairy cows (Nikkhah et al. Reference Nikkhah, Furedi, Kennedy, Crow and Plaizier2008; Lennerz et al. Reference Lennerz, Alsop, Holsen, Stern, Rojas, Ebbeling, Goldstein and Ludwig2013). Glucose with some delay freely diffuses into the interstitial space surrounding cells, including mammary epithelial cells, thus, the concentration of glucose in plasma and interstitial space becomes equivalent after a delay (Cengiz & Tamborlane, Reference Cengiz and Tamborlane2009). Therefore, we can speculate that the observed differences might be driven partly by a different biological need in vivo in responding to glucose upsurge between the two cells types. It is also possible that the differences observed are consequence of different glucose metabolism between the cell types in response to insulin.
In spite of the lack of confirmation of prior data, the modulation of PPARβ/δ had a minor and inconsistent effect on the expression of genes related to glucose metabolism, which was confirmed by a modest, if null effect, on the measured glucose uptake and lactose synthesis. Despite this, the modulation of PPARβ/δ could have some potential effects on glucose metabolism in our experiment due to the influence on expression of genes related to glucose metabolism. Based on prior data (Riahi et al. Reference Riahi, Sin-Malia, Cohen, Alpert, Gruzman, Eckel, Staels, Guichardant and Sasson2010) we expected in MACT cells treated with the PPARβ/δ agonist an increase in mRNA abundance of SLC2A1compared to the control due to the decrease in abundance of CALR. A decrease in glucose uptake was also expected due to the down-regulation of SLC2A8, but an increase in use of glucose for lactose synthesis due to the increased expression of LALBA and PDK4 was observed. The protein encoded by PDK4 is an inhibitor of the pyruvate dehydrogenase complex that catalyses the conversion of pyruvate to acetyl-CoA. The inhibition of pyruvate dehydrogenase by the PDK4 (Harris et al. Reference Harris, Bowker-Kinley, Huang and Wu2002) enables glucose sparing and channelling of pyruvate to glyceroneogenesis and fatty acid synthesis as observed in vitro and in vivo during starvation ( Connaughton et al. Reference Connaughton, Chowdhury, Attia, Song, Zhang, Elam, Cook and Park2010; Jeoung & Harris, Reference Jeoung and Harris2010). Notwithstanding the above data, an increase in lactose synthesis or utilisation of glucose for lactose synthesis in MACT cells cultivated in plastic was not detected. In PBMC cultivated in plastic a higher production of lactose, which was driven by a higher glucose uptake was noticed, but these observations were not supported by the expression of genes related to glucose utilisation.
Lactose synthesis has been reported in MEC isolated from rodents and cultivated in vitro since the late ’80s (Sasaki & Keenan, Reference Sasaki and Keenan1978). MEC cultivated in plastic can secrete lactose, as observed in bovine (Lin et al. Reference Lin, Sun, Hou, Qu, Gao and Li2016). We are not aware of studies where lactose secretion was compared between MEC cultivated in plastic and Matrigel in bovine. However, expression of LALBA is increased in cells cultivated in Matrigel compared to plastic, as detected in mouse MEC (Blum et al. Reference Blum, Zeigler and Wicha1989). Furthermore, bovine MEC isolated from fresh milk and cultivated in Matrigel produce alveoli-like structures and secrete many milk components, including caseins and lactalbumin (Hillreiner et al. Reference Hillreiner, Muller, Koch, Schmautz, Kuster, Pfaffl and Kliem2017). In our study, despites the lack of formation of obvious alveolar-like structure, we detected a higher lactose synthesis driven by a larger glucose uptake in cells cultivated in Matrigel vs. plastic.
The present study presents several limitations that are discussed in details in the online Supplementary File. Those include a likely not effective inhibition of PPARβ/δ as expected by 1000 nm of GSK-3787, the use of MACT and PBMC also present limitations, including the difference in expression of several measured genes (but not PPARD), lack of formation of alveolar-like structure when cultivated in Matrigel, and the cultivation of cells in supraphysiological glucose level.
Conclusions
Despite the above reported limitations, our data do not confirm the findings from Riahi et al. (Reference Riahi, Sin-Malia, Cohen, Alpert, Gruzman, Eckel, Staels, Guichardant and Sasson2010) obtained in endothelial cells. Therefore, we can conclude that our original hypothesis is not demonstrated and that PPARβ/δ does not play a major role in glucose import and lactose synthesis in bovine mammary cells, at least under the conditions used in the present work.
Supplementary material
The supplementary material for this article can be found at https://doi.org/10.1017/S0022029918000365
The present work was supported by a grant provided to MB by the Oregon Beef Council. Jayant Lohakare was financially supported by Kangwon National University, Chuncheon, South Korea. The authors thank Fernanda Rosa for performing the luciferase assay for Experiment 1 in cells using the HP Dispenser.