


INTRODUCTION
Oil palm (Elaeis guineensis Jacq.) – the source of 35% of all vegetable oils produced worldwide in 2013 – is the top-ranking oil crop (Rival and Levang, Reference Rival and Levang2015). It has long been known that application of fertilizer is necessary to obtain high yields in oil palm plantations (Foster, Reference Foster, Fairhurst and Hardter2003; Ng et al., Reference Ng, Chew, Goh and Kee1999). However, due to the ever-increasing cost of fertilizer and civil society's call for the adoption of environmentally friendly practices, today the efficacy of fertilizer application and its environmental impacts are of concern. Fertilization thus needs to be specifically tailored to crop needs. To meet the high K and Cl needs of the crop, KCl has become the most abundantly applied fertilizer in mature palm plantations. K is removed in the harvested fresh fruit bunches (FFB) and immobilized in the trunk. Depending on the author, K exports vary from 3.7 (Ng et al., Reference Ng, Thamboo and De Souza1968) to 4.3 g kg−1 of FFB (Ng et al., Reference Ng, Chew, Goh and Kee1999), i.e. 80–120 kg K ha−1 year−1 to achieve yields of 20–30 Mg ha−1 year−1 of FFB. Goh and Hardter (Reference Goh, Hardter, Fairhurst and Hardter2003) estimated the amount of K immobilized in the trunk of a mature palm in Malaysia at 70 kg ha−1 year−1.
Leaf analyses were used for fertilization management in West African palm plantations as early as the 1950s (Chapman and Gray, Reference Chapman and Gray1949; Foster, Reference Foster, Fairhurst and Hardter2003; Prevot and Ollagnier, Reference Prevot and Ollagnier1956). Potassium nutrition assessment is now widely used. Growers compare leaf K contents in their plantations to reference levels to adjust the fertilization schedule and meet the annual KCl needs of the crop. These optimal levels, based on the results of fertilizer trials (Foster, Reference Foster, Fairhurst and Hardter2003), help to achieve maximum yields, which are determined locally based on other factors. The response of leaf K contents to KCl applications is therefore an effective way to identify crop nutrient needs. However, it has not been possible to experimentally determine the optimal K content or to use leaf analyses efficiently in some oil palm plantations on volcanic soil or volcanic alluvium. In Indonesia, for instance, Caliman et al. (Reference Caliman, Daniel and Tailliez1994) reported that KCl fertilization had little effect on yield even when leaf K contents were found to be deficient. In northern Sumatra, Foster and Prabowo (Reference Foster and Prabowo1996) reported difficulties in correcting low leaf K contents even when high KCl rates were applied. In Papua New Guinea (PNG), Guiking (Reference Guiking1984) and Breure and Rosenquist (Reference Breure and Rosenquist1977) found that increasing KCl application rates increased yields, but concomitantly reduced leaf K content. All the soils mentioned by these authors share the common property to be of volcanic origin either as volcanic ashes (PNG) or as alluvium (Indonesia). We pooled the results of several fertilization trials conducted on three continents (Africa, South America and Southeast Asia) and identified soil properties that might lead to difficulty in correctly interpreting leaf K content. We focused on finding an indicator of conditions in which leaf K content analysis did not accurately assess KCl needs.
MATERIALS AND METHODS
Experimental design
Among the several dozen fertilizer trials conducted by CIRAD and its partners since the 1960s (Caliman et al., Reference Caliman, Daniel and Tailliez1994), we selected those in which KCl applications were studied and where the results of soil analyses of unfertilized topsoil were available. We chose 13 long-term fertilization trials to study leaf K responses to KCl inputs in different types of soil. Soils mainly differ by the type of parent material: tertiary sands for CA01, alluvium for PS01, RU01, SA01, SA06, SA09, SA10, SG01, sedimentary rocks for SL01, weathered volcanic ashes or rhyolite for AB01, AL10 and TT08. All the trials were thus conducted on mineral soils, except for AW01 where palms were grown in mixed mineral and peat soil. Agronomical management (upkeep, harvest) of the trials was assured according to the standards adopted by the profession. Yield were obtained by individual weighing of all bunches produced during the lifespan of the trial. Fertilizers were generally spread over a circle covering 1.5 to 2 m of radius from the base of the palm. KCl was applied at three rates, hereafter referred to as K0 (not fertilized), K1 and K2 (Table 1). As trials were conducted during different time lapses, rates of fertilizer increased with age of palm but they remained constant over the periods studied. These periods corresponded to periods when KCl was considered to have an impact, which generally corresponded to the end of the trial. Results were thus obtained for 5 to 20 years old palms.
Main characteristics of trials used for the study. Average applied KCl rates refer to the period studied.

*Planting year, †Studied period, ‡The Delay represents the time lapse between the beginning of the protocol and the period studied.
Effects of KCl on leaf contents and yields
The effects of KCl application on palm nutrition were assessed by analysing K, Ca and Cl contents (as % dry matter) from samples of leaflets taken halfway along Frond 17, as frequently done for major nutrients (Foster, Reference Foster, Fairhurst and Hardter2003). The effects of KCl application on yield were inferred from annual weights of FFB per palm. The mean leaf K, Ca and Cl contents and FFB yields were computed for each KCl level over the periods studied for each trial. When the ANOVA F tests for KCl effect were significant, we used the Tukey test at the 5% significance threshold to differentiate the mean results at each KCl application rate. Correlations between variables were assessed using Pearson's correlation coefficient (R). The difference in leaf K content (as % dry matter) between K2 and K0 was divided by the KCl application rate in K2 (in kg palm−1 year−1) to give an index of response, RK. The same calculation was done for leaf Ca content in order to give an index of response, RCa. To describe RK and RCa responses to the soil Ca/CEC ratio, we used the NLIN procedure in the SAS software to fit a hyperbolic curve with the least squares method (SAS Institute, 2011).
Soil analyses
The results of one or several top soil analyses were available for all the trials considered in this study. The samples were generally taken between zero and 20 cm in depth (maximum 30 cm) at sites where no fertilizers had been applied and which were located outside the weeded circle and harvesting and maintenance transit areas. The aim of these precautions was to assess the original properties of the soils without the effects of both fertilizers (for chemical properties) and agronomical management (for physical properties). The results presented are means per trial (Supplementary Table S1). All analyses were performed in the CIRAD laboratories (Montpellier, France) between 1976 and 2011. The descriptive variables considered were the soil organic carbon content calculated from total C determined by dry combustion (Dumas method – ISO 10694: 1995) minus mineral C (carbonate content) determined by volumetric method (ISO 10693:1995), the exchangeable cations and the cation exchange capacity (CEC), measured at the soil pH by exchange with cobalt hexamine trichloride (ISO 23470:2011). We then calculated the Ca/CEC ratio to determine the proportion of the soil exchange complex taken up by Ca.
RESULTS
The main effects of KCl inputs on leaf K and Ca contents are presented in Table 2. The results enabled us to classify leaf K responses in three categories as follows: (i) leaf K contents increased significantly with KCl application (seven trials); (ii) there was no significant effect and leaf K contents did not depend on the KCl application rates (three trials); and (iii) leaf K contents decreased significantly with the KCl application rate (three trials). For each of these three classes, RK ranged from 0.018 to 0.318, 0.003 to 0.016 and −0.046 to −0.025, respectively (Table 2). KCl application thus had a positive, neutral or negative effect on leaf K content. Leaf Ca responses were also classified in three categories: (i) leaf Ca contents decreased significantly with the KCl application rate (five trials in which leaf K responses were always positive); (ii) there was no significant effect (four trials); and (iii) leaf Ca contents increased significantly with KCl application (four trials of which three corresponded to a negative response by K contents).
Effect of KCl applications on leaf K contents. Significant effects (p value < 0.05) are shown in bold. Means followed by the same letter are not significantly different (p = 5%), according to the Tukey test. RK and RCa have been calculated as the differences in K and Ca content between K2 and K0 divided by the applied KCl rate in K2.

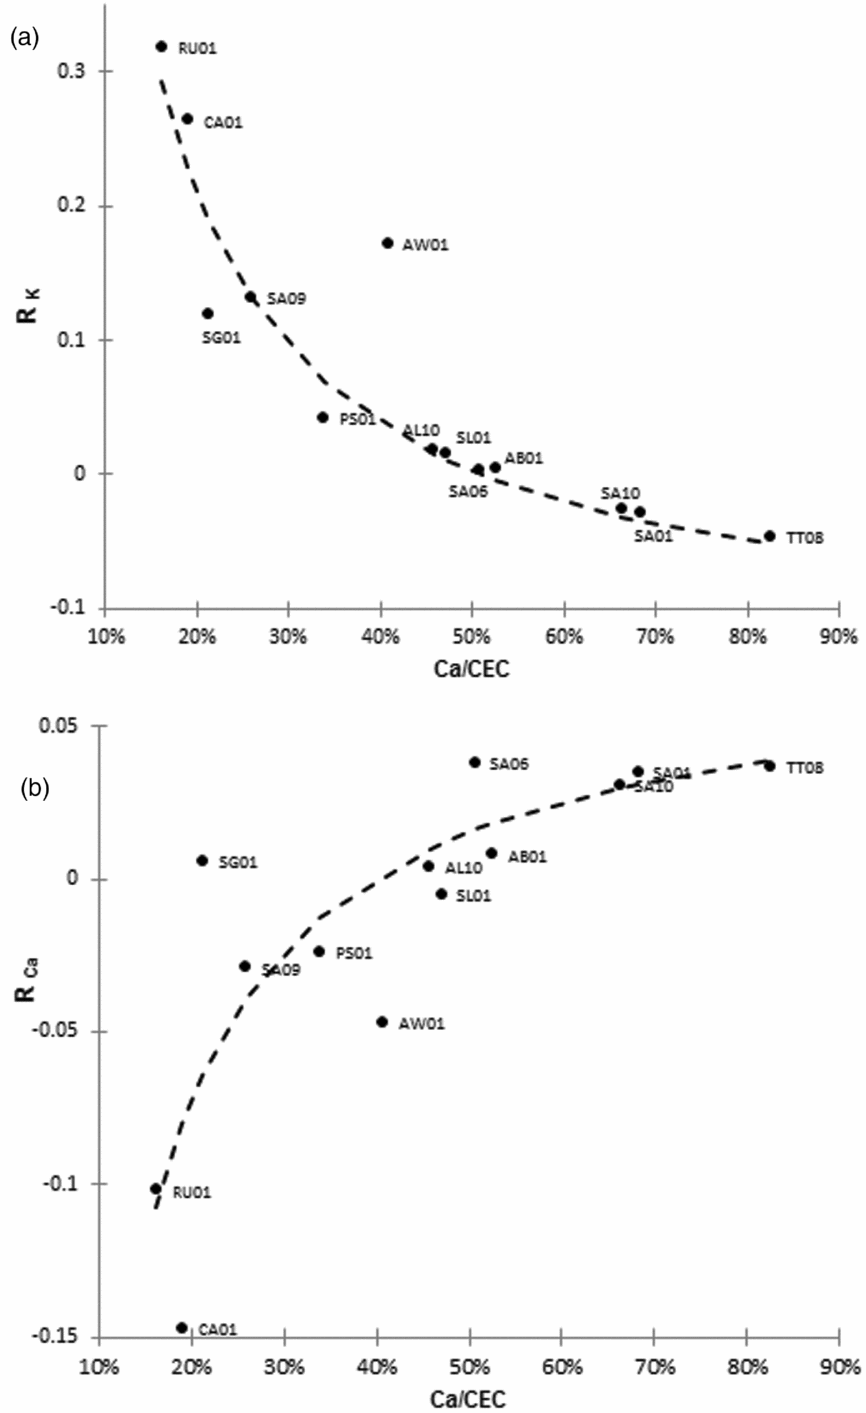
The impact of KCl on leaf K content decreased with the increase in the Ca/CEC ratio (Figure 1a). RK reached zero when the Ca/CEC ratio exceeded approximately 50%. Beyond this threshold, negative leaf K responses to KCl application were observed. Conversely, the impact of KCl on leaf Ca content increased with the increase in the Ca/CEC ratio (Figure 1b). Two hyperbolic response curves were fitted for the mineral soil trials, i.e. after eliminating the AW01 trial.
Relation between RK and Ca/CEC (a), relation between R Ca and Ca/CEC (b). Two hyperbolic curves have been fitted for the mineral soils (RK = −0.1356 + 6.92 (Ca/CEC)−1, R = 0.974, RCa = 0.0743–2.94 (Ca/CEC)−1, R = 0.844).
As KCl also provides chlorine, changes in leaf Cl contents are reported and highly significant increases in Cl contents occurred in all trials (Table 3). In seven trials, KCl application appeared to increase yield by more than 2.4 kg FFB per kg KCl and up to 12.5 kg FFB per kg KCl (p value ranging from 0.001 to 0.161). In the six remaining trials, the improvement in yield was not significant (from 2 to −2 kg FFB per kg KCl, p value > 0.28).
Effect of KCl applications on leaf Cl contents and yield. Significant effects (p value < 0.05) are shown in bold. Means followed by the same letter are not significantly different (p = 5%), according to the Tukey test.

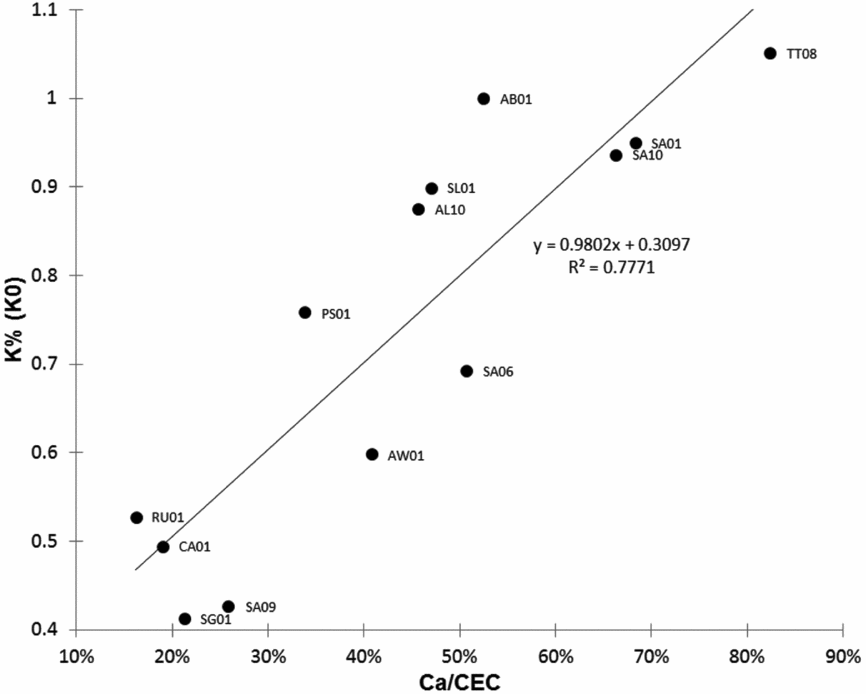
The leaf K contents in the K0 plots ranged from very low levels of less than 0.50% to over 1% after variable lapses of time without any KCl application. We thus sought soil variables that would best explain this final leaf content. Table 4 shows that the time during which the control was not fertilized, tended to influence the leaf K content, which decreased over time, but this effect was not significant (p value 0.052). Leaf K content was very poorly correlated with soil cation contents, especially exchangeable K, but was closely correlated with the Ca/CEC ratio (Figure 2).
Correlations between leaf K content in the K0 plots and soil exchangeable cations or delay from the beginning of the protocol.

Relation between leaf K contents in the K0 plots and soil Ca/CEC value.
DISCUSSION
The results of our trials confirmed high variability of leaf K responses to KCl inputs. In Africa, Caliman et al. (Reference Caliman, Daniel and Tailliez1994) reported significant yield responses with leaf K contents increasing from very low levels (0.5%) to optimum levels close to 0.9%. The yield responses we observed in trials AW01, CA01 and RU01 could be thus related with the clear improvement in leaf K contents (Table 2). In trials PS01 and SA01, no similar conclusion can be drawn, as there was no clear increase in K content which even decreased in trial SA01. In the remaining trials, the poor yield responses suggest that: (i) either the K nutrient status was close to the optimum content whatever the rate of KCl applied, (ii) yields were limited by another factor, climate, for instance, (iii) the data set is not precise enough to detect a significant yield response to KCl.
The relationship between yield and leaf K contents can be extremely variable as mentioned by Ollagnier and Ochs (Reference Ollagnier and Ochs1981), who showed that fertilizer could be saved by setting optimal leaf K content targets according to each combination of soil type, climate and potential yield. According to Goh and Härdter (Reference Goh, Hardter, Fairhurst and Hardter2003), ‘normal’ contents are within the 0.9 to 1.3% range for most soils. Many authors therefore agree that it is essential to determine the optimal leaf K content for each specific situation, and to draw up fertilization schedules accordingly. However, a number of anomalies have been reported indicating that it is not always possible to apply this approach for K nutrition. In trials conducted in northern Sumatra (Indonesia), Foster and Prabowo (Reference Foster and Prabowo1996) reported that leaf K contents were low and did not improve despite high KCl fertilization rates (up to 30 kg palm−1). Wilkie and Foster (Reference Wilkie and Foster1989) also reported significant decreases in leaf K contents with KCl applications on volcanic soils in PNG. Based on the same observations, Ollagnier and Ochs (Reference Ollagnier and Ochs1981) concluded that the increased yields they observed after KCl applications in trials in Colombia could only have been due to an increase in Cl contents, since K contents decreased significantly. These authors considered that optimum leaf Cl content was close to 0.5% (cited in Caliman et al., Reference Caliman, Daniel and Tailliez1994). For that reason, we also concluded that the significant yield response we observed in PS01 and SA01 was mainly due to improved leaf Cl content (Table 3). Our results also showed that leaf Ca contents were strongly influenced by the KCl applications and that the effects were generally the opposite of those observed in leaf K contents, as shown in Figure 1. Although Ca plays an important role as a structural component, there have been no reports of growth or yield response to Ca in oil palm. But our study highlights the fact that the well-known antagonistic effect between Ca and K (Goh and Hardter, Reference Goh, Hardter, Fairhurst and Hardter2003) is related to soil properties and to the Ca/CEC ratio.
By comparing K, Ca, Mg and Cl in trunks, rachis and leaflets in Colombian soils, Dubos et al. (Reference Dubos, Alarcón, López and Ollivier2011) found that applications of KCl or NaCl simultaneously increased Cl, K and Ca contents in trunks and rachis of leaves. These results revealed the key role of Cl in absorption of K and Ca whose amounts in the aerial parts increased with chloride. The responses of leaf Cl contents we observed in the 13 trials confirmed that the whole Cl status also changed in palms receiving KCl compared with unfertilized palms. Our hypothesis to explain the different responses of K and Ca leaf contents is that once K and Ca have been taken up, their allocation to the leaflet is influenced by the abundance of soil exchangeable Ca. This hypothesis is fully compatible with the relations we observed between Ca/CEC and RK or RCa (Figure 1). Additional studies would be required to understand the physiological processes involved in the cation allocation to the leaflet.
When Ca/CEC was > 50%, leaf K contents did not respond positively to KCl inputs and sometimes responded negatively. In such situations, it was not possible to use leaf contents for accurate assessment of crop K needs because this indicator can only be used correctly if it has been experimentally determined that the leaf K contents and yields concomitantly increase to reach equilibrium, at which point fertilization would no longer be cost-effective (Caliman et al., Reference Caliman, Daniel and Tailliez1994). In the interpretation of leaf K contents, it is generally recognized that very low K contents (around 0.6% for Ollagnier and Ochs, Reference Ollagnier and Ochs1981) indicate a deficiency that will affect yields, whereas high contents (over 0.9% for Goh and Härdter, Reference Goh, Hardter, Fairhurst and Hardter2003) indicate that nutrition is sufficient to achieve the yield potential. What happens when the K contents level off at between 0.6 and 0.9%, as was the case in some of our trials (Table 2)? Growers could be tempted to try to improve leaf K contents by applying massive rates of KCl, and if this coincides with Ca/CEC values that reach or exceed 50%, such applications would not be beneficial. Even worse, excessive fertilization could be harmful for the environment by increasing the risk of cation leaching into deeper soil horizons (Dubos et al., Reference Dubos, Snoeck and Flori2017; Kee et al., Reference Kee, Goh, Chew, Date, Grundon, Rayment and Probert1995; Tung et al., Reference Tung, Mohd, Majid, Goh and Huang2009). Several authors (Teoh and Chew Reference Teoh, Chew, Hassan, Chew, Wood and Pushparajah1987; Wilkie and Foster, Reference Wilkie and Foster1989) proposed analysing K contents in leaf rachis as an alternative to leaf analysis. They showed that in this organ, K contents always increased with KCl inputs even when leaf K contents decreased. As rachis K content provides reliable information on K uptake, it could be useful to check rachis K content when leaf analyses cannot be interpreted (Dubos et al., Reference Dubos, Alarcón, Chaves and Rubio2013).
It is essential to know in what circumstances the evaluation of leaf K content is not reliable. We thus recommend determining soil Ca/CEC values for the plantation blocks from which the leaf samples were obtained. It is not necessary to carry out annual soil analyses since the value is unlikely to change much with time. However, this type of sampling should be standardized, especially when assessing existing oil palm plantations where cropping practices contribute to separating different zones with different physical–chemical properties (Nelson et al., Reference Nelson, Webb, Banabas, Nake, Goodrick, Gordon, O'Grady and Dubos2014). In our study, we avoided analyses where fertilizer applications could modify cation contents and CEC. Neither did we consider zones (weeded circles, harvest paths, pruned leaf windrows) where organic matter content and CEC could have been impacted by agricultural practices. Surprisingly, the soil exchangeable K analysis provided no information that could be used to predict the onset of K deficiency when no fertilizer had been applied (K0) (Table 4). In some trials (SA01, SA10 and TT08), the control leaf K contents were always over 0.9% at 8, 10 and 6 years of age, respectively. The soil exchangeable K contents of SA01 and SA10 were as low as those of RU01, CA01 and SG01 (Table S1), for which the leaf K0 content was never over 0.55% at the end of the trial. However, we found a close correlation with the Ca/CEC variable (Figure 2), indicating that it accurately reflected the presence of K reserves in these soils. These reserves, which were not detected by exchangeable K analysis, were high enough to maintain adequate nutrition for up to 10 years in trial SA10. For this trial, Dubos et al. (Reference Dubos, Alarcón, López and Ollivier2011) found that applications of NaCl had a significant effect on K uptake. As this effect was as high as the effect of KCl on K uptake, they concluded that K could only have been provided by the soil reserves despite the fact soil analyses indicated a poor amount of exchangeable K. Foster and Prabowo (Reference Foster and Prabowo1996) also observed this type of situation in Indonesian soils where they recommended assessing soil K reserves via extraction with boiling HCl to explain the types of responses to K nutrition in different trials. The authors stressed that this method was more appropriate for volcanic soils in which some amorphous minerals and type 2:1 clay soils represent a substantial K reserve that cannot be detected by ammonium acetate extraction.
Fallavier and Olivin (Reference Fallavier and Olivin1988) conducted a laboratory study on two types of soil, one from the La Mé research station in Côte d'Ivoire, where leaf K contents were easily rectified by KCl inputs, and the other from Sumatra where leaf K contents did not respond to KCl inputs. They subjected soil columns to leaching after surface KCl applications (K equivalent: 2.3 cmol kg−1). These authors showed that at La Mé, a very small fraction (17%) of K inputs was retained in the soil column after several leaching cycles, while in the Indonesian soil, 46% of the inputs were retained by the soil, of which 15% was in a retrograded form in 2:1 minerals. These results showed that the nature of the soil K reserve differs between soils. Nevertheless, the Ca/CEC ratio appears to be useful for predicting or confirming the type of leaf K response as well as for assessing soil K reserves. In some soils, these reserves may be higher than suggested by extraction with cobaltihexamine chloride or ammonium acetate.
CONCLUSION
Amongst the 13 fertilizer trials selected for this study we observed positive yield and leaf K contents responses for three of them. This confirms the interest of leaf analysis to assess K fertilizer needs in oil palm plantation. For six trials, we observed a poor or unexpected K content response to KCl. We identified Ca/CEC of soil to predict in what circumstances a misinterpretation of leaf K content for fertilization management may occur. This variable reflects the abundance of exchangeable Ca in the soil that can influence the antagonistic K/Ca allocation in the leaflet when chloride is applied. We recommend the systematic determination of Ca/CEC when oil palm plantations are established. It makes it possible to predict whether leaf K contents could be used to draw up a KCl fertilization schedule. If this condition is not fulfilled, caution is needed before adopting an intensive fertilization strategy geared towards improving low leaf K contents. The economic and environmental issues would then warrant further analyses focused on leaf rachis, for instance, with conventional soil cation exchange analyses supplemented by other determinations.
Acknowledgements
The authors are grateful to Palmeras de los Andes in Ecuador, Indupalma S.A. in Colombia and PT Socfindo in Indonesia for permission to publish trial results mentioned in this paper.
SUPPLEMENTARY MATERIAL
To view supplementary material for this article, please visit https://doi.org/10.1017/S0014479717000473



