Introduction
A prolific malignancy in women, breast cancer accounts for 31% of all female cancer, 20–25% of female cancer deaths and 10% of all cancer deaths in the UK.Reference Bomford and Kunkler1
Developments in surgical intervention and adjuvant systematic treatments such as chemotherapy and hormonal therapy have lead to a decrease in breast cancer mortality over the last decade.Reference Tobias, Vaidya, Keshtgar, Douek, Metaxas, Stacey, Sainsbury, D'Souza and Baum2 In addition, tangential beam radiotherapy to the breast is also vital and extremely effective treatment modality that has been established for many years.
Along with focus on newer, more conformal treatments such as partial breast irradiation and IMRT,Reference Coles, Moody, Wilson and Burnet3 the tangential technique is in itself showing the potential for improvement. Studies using tangential radiotherapy with moderate deep inspiration breath holdReference Remouchamps, Letts, Vicini, Sharpe, Kestin, Chen, Martinez and Wong4 have shown improved distributions yielding a decrease in heart volume and cardiac complication. Also, developments in Mammosite brachytherapy with tangential beam irradiation are also showing improvements in toxicity and cosmesis.Reference Chao, Vicini, Wallace, Mitchell, Chen, Ghilezan, Gilbert, Kunzman, Benitez and Martinez5
Despite these potential improvements, current breast radiotherapy practice remains effective, reducing the risk of recurrence by two thirds.6 Nevertheless, it is not without flaws that could be improved.
One of the major drawbacks of current breast radiotherapy is skin toxicity, which is experienced by the majority of patients.Reference Porock and Kristjanson7 Moreover, it is those patients with larger breast that tend to experience horrendous and more substantial skin toxicity.
With what we understand about the nature of radiation interaction with matter and effective dose distributions, utilising higher energies (specifically 10MV) compared to the mainstay of 6MV widely in patients with larger breasts may have the potential to yield improved dose distributionReference Winfield, Deighton, Venables, Hoskin and Aird8 and thus, decreased skin toxicity. However, it is speculated that due to the greater build up depth compared to 6MV, superficial dose would be compromised.Reference Winfield, Deighton, Venables, Hoskin and Aird9
Nevertheless, due to the tangential nature of the beam, it is possible that this is not the case and superficial dose would not be compromised, as the build up depths from 10MV would be more comparable to that of 6MV.
Characterisation and quantification of the superficial build up in tangential beam radiotherapy is therefore paramount. This is due to the clinical improvements and implications that would arise with a more standard use of 10MV photons in treating these patients with larger breasts.
Literature Review
Current practice
Due to the fact that a large number of patients receive radiotherapy for breast cancer each year, there is a wealth of literature available surrounding the subject, producing a varied argument on breast radiotherapy.
Although dated, an article by Neal et al.Reference Neal, Mayles and Yarnold10 described breast radiotherapy as making little progression despite technological advances. At the time of this article, developments in the technical aspects of radiotherapy were well established. However, radiotherapy to the breast appeared to not exploit these advances with very few articles being published looking at ways to improve the technique.
Over the last five years, we have seen many advances in both technology and disease management. It is clear that extensive research has been taken place assessing several contemporary innovations in treatment delivery such as CT planning, IMRT and partial irradiation of the breast.Reference Coles, Moody, Wilson and Burnet3
The status of breast planning, as the literature indicates, is still predominantly based on single plane 2D systems. Although this method has been utilised for many years, it can lead to substantial dose inhomogenieties, notably in the case of patients with larger breasts.Reference Neal, Torr, Helyer and Yarnold11
In relation to developments in IMRT, results of various studies appear to be positive. Conforming dose decreases inhomogeneous dose distribution; therefore reducing radiation reactions experienced by the patient. This is supported with the results from a study by Kestin et al.Reference Kestin, Sharpe and Frazier12 in a group of ten patients receiving IMRT rather than conventional radiotherapy. Breast appearance post radiotherapy has also been reported to improve with IMRT compared to the standard tangential pair technique.Reference Yarnold, Donovan and Bleackley13, Reference Yanold, Owen and Ashorten14 It is therefore clear that there is plentiful literature to support IMRT, although full clinical implementation is yet to commence.
Another proposed technique, partial breast irradiation, has the aim of reducing lung and cardiac doses, the organs at risk during breast treatment, and also indicates that treatment of the whole breast to patients that don’t necessarily require it can be eliminated. However, one must be sceptical as long-term followup data is not yet available as the studies continue.
However, it is clear that these more advanced techniques for treating the breast remain hypothetical, and have not yet been clinically approved. It is likely that treatment and toxicity will be improved with the new methods due to the more accurate spatial dose distribution achieved.Reference Donovan, Bleackley, Evans, Reise and Yarnold15 Nevertheless, have all options of current treatment been explored. Are we jumping too far ahead?
A need for change
It can be argued that for radiotherapy to progress, treatment techniques need to develop in conjunction with the technology and expertise available. However, these techniques are not yet at our disposal so the question arises. Should improvements to current tangential radiotherapy be explored first?
Tangential breast irradiation has been at the forefront of breast cancer treatment for many years and remains, very much, the gold standard for treatment. Reduced mortality is currently established;6 however, this technique is still not perfect and could be improved, specifically with reference to issues with skin toxicity in patients with larger breasts.
A somewhat ‘‘comfort blanket’’ has been established in the scope of breast radiotherapy. With good treatment outcomes already achieved, improvements into toxicity have had rather little consideration. Before moving onto more technologically advanced methods, surely ways of reducing effects and improving patient quality of life should be investigated? The goal should be perfection in all areas of treatment, not just final outcome.
Dose homogeneity
Sources of dose variation with tangential pair irradiation can be attributed to many factors. These include irregular contours throughout the volume, lung correction factors,Reference Redpath, Thwaites, Rodger, Aitken and Hardiman16 diversity of breast shape of the treatment volume and more importantly in the scope of this project, breast size.
Dose inhomogeneity within the breast is greater than at other anatomical sites, particularly in women with large breasts.Reference Neal, Mayles and Yarnold10 Leading to increased skin reaction and general treatment toxicity. This characteristic is explored and highlighted in many studies, although again they are relatively dated, however this again re-iterates the lack of recent research in this area.
Moody et al.Reference Moody, Mayles and Bliss17 investigated cosmetic effects of radiation to 559 patients with small, medium and large breasts over five years. Results of this work showed that 39% of women with large breasts had changes in appearance. This is compared to 33% and 6% to women with medium and small breasts, respectively. Literature has underpinned this factor but little was done to explore this further; until the development of the START trial.
Impact of START
The START trial (Standardisation of Radiotherapy) began in 1999. The predominant goal being to assess the effects of radiotherapy schedules using fractionation sizes larger than 2.0Gy in terms of tumour control, quality of life, normal tissue and economic consequences in women who are prescribed post operative radiotherapy for early breast cancer.18
Within the findings of the START trial, it has been discovered that 46% of the centres investigated utilised higher energies ranging from 8MV, 10MV and 15MV photons for treatment of larger breasts to achieve optimal dose distribution.Reference Winfield, Deighton, Venables, Hoskin and Aird8
In contrast, Winfield et al.Reference Winfield, Deighton, Venables, Hoskin and Aird9 suggest that higher energy use for large breasts may compromise superficial tissue coverage. This would have implications to recurrence due to under-irradiating this region. However, this is by no means categorical evidence and a suggestion only.
However, should 10MV have more comparable build up depth to 6MV with tangential beams, 10MV will not compromise superficial coverage to a significant degree in larger breast patients. Skin toxicity will be reduced with a decrease in superficial dose and overall improved dose homogeneity.
At this point, a contradiction arises with in the literature. It has been documented that there is a possibility of compromise to superficial dose when using higher energy (10MV). However, the START trial found that 83% of investigated centres utilised a 16Gy boost to the tumour bed.Reference Winfield, Deighton, Venables, Hoskin and Aird8
Electron boosts have been proven to reduce the risk of recurrence in patients aged 50 years and under.Reference Bartlink19 Superficial dose at the site of excision is escalated with the boost and skin toxicity worsened. Therefore, in those with larger breasts, any loss in superficial coverage if 10MV were to be used, is consolidated by the boost, making any negative impact of 10MV less significant.
Acute toxicity
Acute, is a key factor that needs improvement for breast irradiation to become a better treatment. Survival and control have been well established with radiotherapy, the focus now needs to be on reducing these effects, thus delivery of an overall superior treatment.
Short-term treatment reactions are predominantly related to skin toxicity induced by treatment. Porock and KristjansonReference Porock and Kristjanson7 reported that 90% of patients treated with radiotherapy for breast cancer in their study population will develop some degree of radiation-induced dermatitis, highlighting how prolific this problem is.
Materials
Thermoluminescent dosimeter (TLD)
TLD’s were used for dose recording and reading throughout the resarch. This was due to their versatility, small size and easy reading technique, which is supported by Banjade et al.,Reference Banjade20 who described the use of TLD’s as an effective dose mapping technique.
A batch of 80 TLD’s were utilised which provided a sufficient number for all aspects of dose reading required. In order to minimise possible errors related to the TLD’s, all of those used were from this same batch. No additional TLD’s were incorporated, and at no time were the TLD’s annealed separately. During the experiment the individual TLD’s were selected randomly.
Phantoms
Despite the advent of a variety of breast phantom designs for the START trial,Reference Venables, Winfield, Deighton, Aird and Hoskin21 none were used in this study, due to availability limitations. However, as reports suggest, by not using a breast specific phantom, negative implications to the study could have been induced with regard to replication of treatment position and geometrical approximations to the patients shape.Reference Davis, Pfafflin and Cozzi22
To replicate breast tissue and achieve the best possible characteristics reflective of the treatment situation, Water-equivalent phantoms were used in the form of square blocks of equal surface area but varying thickness. During the experiment they were used to both replicate the breast (three 50 mm blocks combined on top of each other) and build up tissue.
Methods
Characterisation of TLD relative response (chip factors)
With regard to experimental uncertainty of TLD’s, it was important to correct for characteristic differences (error) in response associated with individual TLD’s. As a result, chip factors where obtained before the dose measurements took place. These factors where then incorporated when calibrating the batch (Corrected reading = Chip factor × reading) to correct for these errors. In addition, any faulty TLD’s or those poorly responding where presented and eliminated.
Using the 600c series Linac (energy was not important here, 6MV was used due to greater accessibility of machine time) the whole TLD batch was placed on a 10 cm thick water phantom. This was to induce backscatter, reflective of the normal treatment condition. A layer of phantom, 1.5 cm thick was then placed on top of the TLD batch. In doing so, 100% of the dose delivered was at the level of the TLD’s.
The Linac parameters used here were 0° rotation on the gantry, collimator and couch, and a 10 cm × 10 cm field size. In consideration to the 6MV beam profile, it was important to acknowledge dose variation at 100 cm FSD. Thus, to incur a smaller dose variation, the FSD was extended to 159.5 cm to the surface of the 1.5 cm thick anterior layer of phantom (161 cm to the TLD’s).
The monitor units needed to deliver 2Gy were calculated and delivered to the batch, to simply adhere to common fractionation size in breast radiotherapy. Once irradiated, the TLD batch was read and then annealed and a repeat of this process was performed.

Stability of linac output
An additional factor associated with experimental uncertainty of TLD’s is Linac output. Stability of Linac output was an important consideration, as variations in output would affect TLD readings. Therefore, the variation in output was obtained; to establish the degree of uncertainty this factor would yield.
In order to collect sufficient data, three separate measurements, for each energy, where taken throughout the day at three hour intervals, for three days. This was achieved using the department’s morning quality assurance method of calculating Linac output.
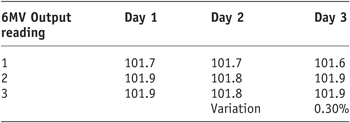
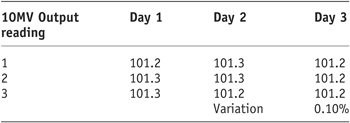
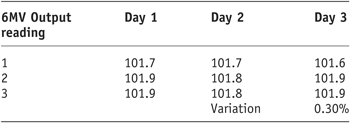
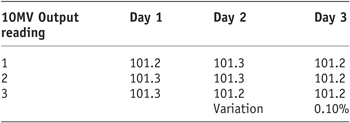
As the results show (Tables 1 and 2) there was a very small variation in Linac output for 6MV and 10MV (0.3% and 0.1%, respectively). It was therefore decided to continue with the remaining study using the output established during the morning QA.
6MV linac output stability
10MV linac output stability
Calibration
To establish absolute dose values during all stages of dose recording in the main study, calibration of the batch prior was paramount.
To calibrate the batch, a random sample of nine TLD’s was selected from the batch. Once selected, they were arranged onto a 15 cm thick phantom in a 3 × 3 square arrangement fixed by Perspex spacers.
On top of the TLD’s was 1.5 cm thickness of phantom for 6MV energy and 2.2 cm thickness for 10MV energy to incur D-max at the level of the TLD’s. The levels of D-max used here are those associated with the 600C and 2100CD Linac in the department that where used for 6MV and 10MV dose measurements. The field size used was again 10 cm × 10 cm with gantry, floor and collimator rotations of 0°. When calibrating, 1Gy was delivered at 100 cm FSD.
Main study
Once calibration readings had been obtained, three TLD’s were placed linearly on top of 15 cm thick phantom, supported by Perspex spacers. This was 5.6 cm medially from the lateral edge of the phantom. A 10 cm × 20 cm asymmetric field size was set with the isocentre of the field placed directly at the central TLD at an FSD of 94.4 cm.
A 270° collimator rotation was used for both RAO and LPO beams. In relation to wedging, a 30° enhanced dynamic wedge was used in each beam. The gantry angles for each beam were 315° and 135° for the RAO and LPO, respectively.
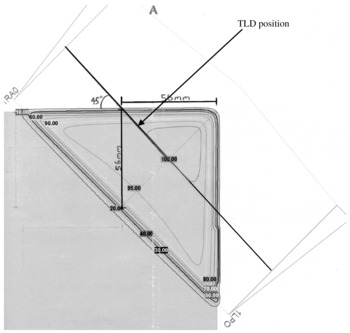
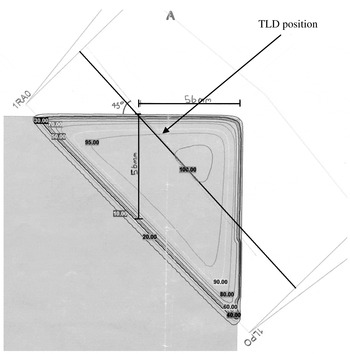
Using the planning system, diagrams of this set-up and TLD placement are shown with the proposed dose distribution through the phantom (Figures 1 and 2). It is important to note that these set-up diagrams show the stage where no build up material is used.
6MV set-up and dose distribution.

10MV set-up and dose distribution.

In order to enable the contribution of each beam to be shown, it was decided to perform the data collection for each beam individually, for both 6MV and 10MV photon energies. The component doses where then added up to obtain the total dose received.
Using 6MV photons, the RAO beam, with no build up material placed on top, irradiated the set of three TLD’s, representing 0 cm build up (dose at skin). The three TLD’S where then replaced and the LPO beam delivered. Each beam delivered 1Gy (the monitor units needed where calculated) to conform to treatment fractionation of 2Gy.
The TLD’s were then removed and replaced by another three TLD’s and the process repeated but with 2 mm of build up material placed on the TLD’s for each beam. This process was repeated for each requisite thickness (depth) of build up material. For 6MV photons, these depths where 0 mm, 2 mm, 3 mm, 5 mm, 7 mm, 10 mm, 12 mm, 15 mm and 20 mm. It was believed that this would present with a sufficient range of superficial dose values to adequately characterise build up dosimetry.
Once all of the 6MV data had been collected, the TLD’s where read then annealed in order for them to be reset. The same process was then carried out in order to collect the 10MV photon data. However, to gain a fair representation of superficial build up past the maximum for 10MV, 12 mm build up was omitted and replaced with 25 mm build up.
For all of the build up readings, correction factors for distance (Fdis) and depth (Fdep) were calculated for 6MV and 10MV, respectively. These had to be incorporated along with the chip factors and calibration factor when calculating absolute dose values.
Results
Stability of linac output
Tables 1 and 2 display the output factors recorded and the subsequent percentage variation in output of the 600C and 2100CD Linac.
As the results show, for both photon energies the output remained stable with very subtle variation in output obtained.
6MV build up depth results
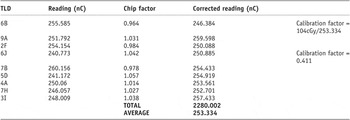
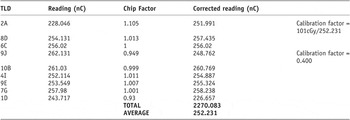
Table 3 shows the readings taken and the subsequent calibration factor for the 6MV dose readings.
6MV Calibration Factor readings

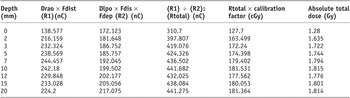
The absolute total dose values at depth for 6MV build up are displayed in Table 4.
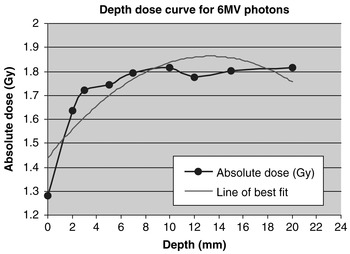
The depth–dose plot to express the absolute total dose (both RAO and LPO contributions) as indicated in Table 4 against the build up depth is shown in Figure 3.
Depth–dose curve for 6MV photons.

The line of best fit displays the general characteristic nature of the 6MV superficial buildup obtained.
As the line of best fit shows, at no point was 100% of the dose delivered (2Gy) recorded in this depth range. Also, this curve indicates a peak dose of 1.88Gy (94%) occurred at a depth of 13.5 mm.
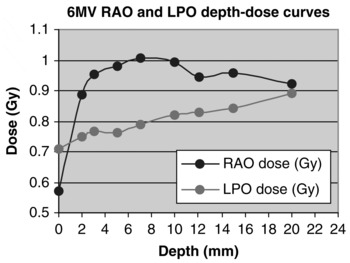
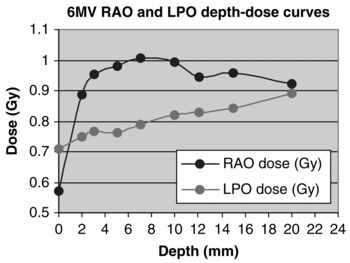
The individual contributions of both RAO and LPO fields have been developed from Table 4 using the R1 and R2 values. The respective depth dose plots are shown in Figure 4.
6MV RAO and LPO depth–dose curves.
6MV: Absolute dose values at depth

It is clear that for every measured build up depth (except 0 mm), a greater contribution of the total dose arose from the RAO field. The difference however, increases from the 2 mm plot to the 7 mm plot, after which a progressive decreases is shown.
10MV build up depth results
Table 5 shows the readings taken and the subsequent calibration factor for the 10MV dose readings.
10MV Calibration Factor readings

As Table 5 shows, there was a 2.67% difference in the calibration factors obtained between 6MV and 10MV photons. In addition to the uncertainty caused by inherent TLD error, this variation is also attributed to the energy dependency of the TLD’s. The monitor units delivered are calibrated to pass through water, thus differences in 6MV and 10MV energy absorption through the lithium fluoride TLD’s, result in a variation in dose recording.
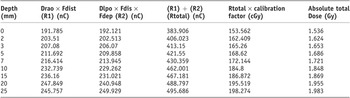
The absolute total dose values at depth for 10MV photons are displayed in Table 6.
10MV: Absolute dose values at depth
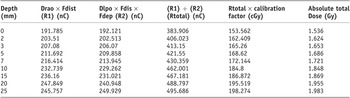
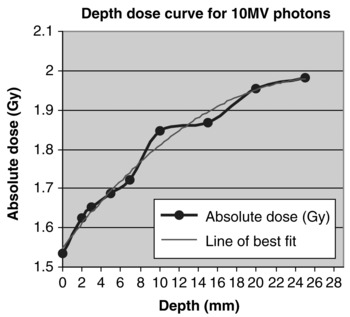
The depth–dose plot to express the absolute total dose values (both RAO and LPO contributions) as seen in Table 6, against depth, is shown in Figure 5.
Depth–dose curve for 10MV photons.

Figure 5 shows that, like with 6MV photons, at no point was 100% (2Gy) recorded. The line of best fit shows a peak dose of 1.98Gy (99%) at a depth of 24.3mm. Therefore, the difference in the peak dose and depth from 6MV to 10MV according to the data was 0.1Gy over 10.8 mm.
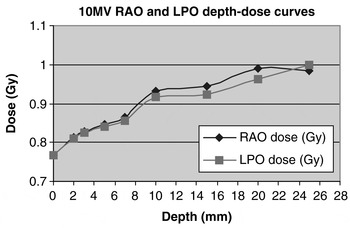
The individual contributions of both RAO and LPO fields have been developed from Table 6 using the R1 and R2 values. The respective depth dose plots are shown in Figure 6.
10MV RAO and LPO depth–dose curves.

The contributions of each field to the total dose at each depth is much more similar when irradiating with 10MV photons. The nature is the same in relation to a gradual increase in difference (in this case from 7 mm to 15 mm) then progressive decrease (from 15 mm to 25 mm). However, the magnitude of difference is significantly less. Again, this has descriptive implications to the dose distribution produced within the breast when 10MV photons are used.
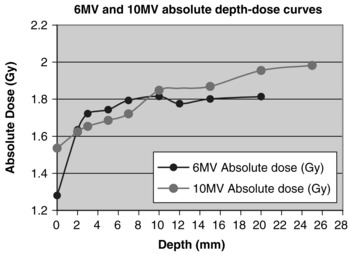
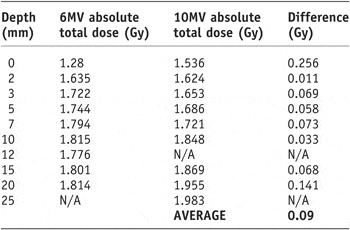
To simplify comparative analysis, the absolute total dose values for 6MV and 10MV have been placed together in Table 7 along with the numerical difference in dose at each point. Similarly, Figure 7 displays both depth–dose plots (Figures 3 and 5) on the same axis.
6MV and 10MV absolute depth–dose curves.

6MV and 10MV absolute dose values and numerical difference
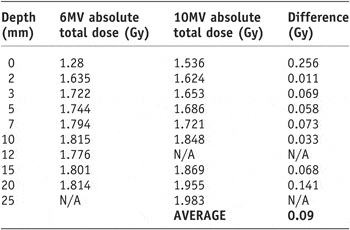
The numerical difference in dose does vary slightly, but is generally very small. The overall average difference of 0.09Gy at each depth shows that there is very little difference in the superficial dose between 6MV and 10MV photons in tangential radiotherapy. This inference is further highlighted in Figure 7.
Discussion
Data collection
As shown in Tables 3 and 5, when obtaining a calibration factor for both 6MV and 10MV photons, a rather broad variation in individual TLD response is shown.
This highlights the influence of the individual TLD response error with relation to the experimental uncertainty. Despite the fact that this was taken into account and correction factors (chip factors) where recorded, the response error remained. Ultimately proving a major influence to the uncertainty of the results of this study.
TLD response proved the dominant factor with respect to experimental uncertainty. However, the influence of Linac output variation cannot be ignored. Despite the results of the output investigation yielding a very small variation (0.3% and 0.1%), it would have been better to obtain this value at the exact start of calibration, rather than assuming it’s stability and using the output value established at the morning QA procedure. This would have removed the presence of this uncertainty factor, additional to the error in TLD response.
In addition, the use of a breast specific phantom would have brought some benefit. Although this was not a huge factor as superficial tissue was the region investigated it still shows a drawback of this study. By not using a breast specific phantom, negative implications where present in terms of replication of treatment position and geometrical approximations to the patient’s shape.Reference Davis, Pfafflin and Cozzi22
Clinical implications
Figures 3 and 5 both display a graphical interpretation of the absolute dose values recorded (displayed in Table 4 and 6). In addition, they also contain the line of best fit; a representation of the general characteristic nature of the superficial dosimetry experienced for each energy. It is this that has been used to analyse the maximum dose recorded and their depths of occurrence.
This investigation was carried out once, therefore although the superficial dosimetry has been quantified, it would be inaccurate to use these lines (absolute dose) at this stage as representations of the general dosimetry. This is due to their relevance to a single data collection, with no average results obtained (a limiting factor and drawback of this study).
Using Figures 3 and 5, the maximum doses recorded for 6MV and 10MV photons were 1.88Gy (94%) at 13.5 mm and 1.98Gy (99%) at 24.3 mm, respectively. This was a very slight increase in total dose, ultimately 0.1Gy, through a depth of 10.8 mm. The closely comparable data drawn here is a vital and indicative factor, further exemplified in Table 7 and Figure 7.
By placing the 6MV and 10MV data sets together, this small difference is shown more clearly and to greater effect. There is clearly a strong correlative relationship (Figure 7) between the actual doses recorded for 6MV and 10MV photons.
In addition, as displayed in Table 7, there is only a 0.09Gy average difference in the doses recorded at each depth. This is extremely small (4.5% of the 2Gy dose delivered) and not large enough to implicate detrimental implications to superficial coverage in 10MV treatment of women with larger breasts.
Furthermore, these inferences underpin the efficacy and clinical relevance to the justifiable use of 10MV photons. A factor that has already been considered, with the START trial showing 46% of the centres investigated using higher energies for treating larger breasts.Reference Winfield, Deighton, Venables, Hoskin and Aird8
It is important to note here that the above data (0.09Gy average difference at each depth) is with disregard to 12 mm and 25 mm depth recordings. These depths were not investigated for each energy in consideration the differences in D-max between 6MV and 10MV photons.
As a result of the main study, it is evident that this justification is further reinforced. This is respective to the dosimetry characteristics and relative contributions (weighting) of each field for the different energies.
For a number of years it has been commonly believed that there is greater dose inhomogeneity in larger breast treatments, which ultimately causes the significant skin reaction experienced in this patient population.Reference Back, Guerrieri, Wratten and Steigler23
In both energies investigated here, the contributory dose from the RAO and LPO fields where looked at separately. In doing so, it is apparent that an equal 50:50 weighting was produced when 10MV photons were used. This weighting was not equal with 6MV photons. The RAO field had a 53% weighting, and the LPO field 47%.
This information is illustrated in Figures 4 and 6. In comparison to Figure 4, Figure 6 indicates this more equal weighting of dose from each field. To a certain degree, both RAO and LPO lines are superimposed. This conclusion cannot be made for the 6MV contributory doses where a greater difference is clearly evident, due to the 53:47 ratio of weightings.
Moreover, the equal weighting of dose present in 10MV irradiation implies a more homogenous and improved dose distribution compared to 6MV photons. The improvement to dose inhomogeneity would reduce these skin reactions.Reference Porock and Kristjanson7, Reference Back, Guerrieri, Wratten and Steigler23 The effects to long-term and permanent breast appearanceReference Mettler24, Reference Archambeau, Pezner and Wasserman25 would also decrease in incidence.
Conclusion
Ultimately, through analysis of the results, it has been established that there is no significant difference in the superficial build up characteristics between 6MV and 10MV photons. Thus, the compromise to superficial dose originally limiting this energy use is not as significantly present as assumed.
The improved dosimetry and more homogenous characteristics produced with 10MV photons, further underpins this role. In using 10MV photons, the skin reactions developed would be reduced leading to a much better treatment experience for the patient. Therefore, implementation of 10MV photon treatments as a standard for women with larger breasts must surely be considered.