

INTRODUCTION
Spacers are used as solid insulating support for high voltage conductors in a compressed gas insulated system systems (GIS) (Laghari, Reference Laghari1985). These systems are subjected to very fast transient over voltages (VFTO), which lead to their insulation failure due to flashover along insulator surface. This involves the formation of discharge path along the surface of the insulator that leads to breakdown at a reduced voltage. The presence of spacer between spark gap electrodes is necessary in the study of operation of GIS under VFTO especially when a series of breakdown occurs during the working of a disconnector (Ran et al., Reference Ran, Wang, Wang, Zhang, Yan and Wang2013). The spacer plays a critical role in Blumlein pulse forming line (PFL) based high voltage pulse power systems. Blumlein consists of two PFL, one between the outer and intermediate conductor and the other between the inner and intermediate conductor (Roy et al., Reference Roy, Menon, Mitra, Kumar, Kumar, Sharma, Mittal, Nagesh and Chakravarthy2008; Kumar et al., Reference Kumar, Mitra, Senthil, Sharma, Nagesh, Singh, Mondal, Roy and Chakravarthy2007). However, it consists of support insulators between these conductors the design of which is of considerable importance for reliable operation at high voltages. Further the energy mismatch between Marx generator and Blumlein leads to the development of high field stresses followed by failure of the solid support insulation (Sharma et al., Reference Sharma, Mitra, Senthil, Sharma, Singh, Tewari and Mittal2014). The discharge along insulator surface in compressed gases involves a number of electron-photon processes in the surrounding gas volume that modifies the ionization parameters which influences the ionization growth (Sudarshan et al., Reference Sudarshan and Dougal1986). The presence of spacer in compressed gases significantly reduces the breakdown voltage and increases the speed of propagation of electrons between the electrodes (Li et al., Reference Li, Theophilus and Srivastava1995a). The discharge can initiate at any point on the surface of the spacer (Pfeiffer, Reference Pfeiffer1982) and the high speed photographic study shows a consistent growth of charge carriers along the spacer surface which helps in discharge development (Li et al., Reference Li, Theophilus and Srivastava1995b). Time-resolved optical and electrical study of the avalanche and streamer formation in uniform fields without space charge effects have already been carried out in nitrogen and air (Kennedy, Reference Kennedy1995; Wen, Reference Wen1989; Verhaart, Reference Verhaart1982). A number of studies have been carried out in recent times to study the development of arc and flashover along an ice covered insulator using optical emission spectroscopy (OES) to study the different plasma parameters and the contribution of different particles in the plasma processes (Nekahi et al., Reference Nekahi, Farokhi, Farzaneh and Stewart2014; Reference Nekahi and Farzaneh2011a). The method of OES is passive and is based on recording light emitted from the plasma. The collision with electrons leads to excitation of plasma particles. The relaxation of the excited particles to lower energy state is the reason of emission of photon of light (Kolpaková et al., Reference Kolpaková, Kudrna and Tichý2011). The ablation of materials by electrical spark plasma forms the basis of analysis of OES. The excited ablated material in the plasma emits light in the vacuum ultraviolet (UV) to visible range, the wavelength of which is the characteristic of the element present in the sample and its intensity is a measure of its concentration. The ablation of zinc-oxide films caused by yttrium garnet aluminum (Nd:YAG) laser was studied using OES and it was observed that the electron temperature and densities decreases with distance from the target being 1.2 eV and 3.2 × 1017 cm−3, respectively, with a small rise at a distance of 20 mm from the target (Saji et al., Reference Saji, Joshy and Jayaraj2006). The spectroscopic studies on plasma produced from a laser ablated magnesium-sulphate surface shows a reduction in temperature and electron density for both the incident laser wavelengths of 1064 nm and 532 nm (Salik et al., Reference Salik, Hanif, Wang and Zhang2014). The enhancement in emission from lithium at 670.8 nm as compared to the transition at 610.3 nm in the presence of a variable magnetic field shows electron impact excitation as the dominant mechanism behind the increase in intensity line at 670.8 nm as compared to recombination (Kumar et al., Reference Kumar, Singh, Prahlad and Joshi2010). Time and space resolved spectroscopic study of discharge in pure helium gas environment at a pressure of 105 Pa shows the formation of discharge channel within the gap with varying plasma densities comprising of an inner high dense layer of the order 3 × 1016 cm−3 and an outer lower density layer of 5 × 1015 cm−3 with temperature of these layers being 2 eV (Yatom et al., Reference Yatom, Stambulchik, Vekselman and Krasik2013). The layering of the plasma at the gas plasma interface into fast and slow ion components with fast component penetrating into the ambient gas and deceleration of the slow component gives a double peak in the temporal profile of laser produced carbon plasma (Thareja et al., Reference Thareja, Abhilasha and Dwivedi1995). OES was carried out for the determination of the excitation temperature of an arc over an ice covered insulator surface (Nekahi & Farzaneh, Reference Nekahi and Farzaneh2011b). The excitation temperature was determined using relative line intensity method by using the copper and oxygen spectral line, which was found to be 9000 K and it did not vary significantly with the discharge current (Nekahi & Farzaneh, Reference Nekahi and Farzaneh2011b). The OES of dc flashover along lexan surface in air and nitrogen shows that the discharges propagates close to the surface in air and away from it in pressurized nitrogen (Krile et al., Reference Krile, Neuber, Dickens and Krompholz2004). The pulsed flashover of lexan in nitrogen environment leads to the development of flashover path along the insulator surface in the presence of UV illumination and away from the surface in the absence of UV. This is due to the presence of photo-electrons, which helps in spark development close to the insulator surface. A decrease in flashover delay time in humid nitrogen is due to the presence of weakly bound electrons in moisture which is available for flashover initiation (Morales et al., Reference Morales, Krile, Neuber and Kromp Holz2006; Krile et al., Reference Krile, Neuber and Krompholz2008; Reference Krile, Neuber, Dickens and Krompholz2005). However, in the absence of UV, the flashover path in air is close to the insulator surface and away from it in nitrogen environment mainly due to the presence of oxygen in air, which has a lower excitation threshold leading to larger production of photoelectrons close to the insulator (Morales et al., Reference Morales, Krile, Neuber and Kromp Holz2007). The streamer propagation study of magnesium-fluoride in nitrogen, oxygen, and dry air using an intensified charge-coupled device camera shows streamer initiation at anode which is segmented in nitrogen environment unlike in oxygen where the streamer growth is blurry and diffused with self-absorption of emission lines by oxygen molecules in vacuum UV range (Laity et al., Reference Laity, Neuber, Fierro, Dickens and Hatfield2011). The presence of needle protrusion at 1 mm above the insulator surface leads to the formation of discharge path in gas away from the insulator surface similar to the plain gas gap conditions with perturbation, which signifies the importance of the region of highest stress in determining the discharge initiation and propagation particularly for fast voltage transients (Pfeiffer et al., Reference Pfeiffer and Volker1980). The presence of particle on spacer surface provides a local field enhancement and the phenomenon of breakdown was modeled by considering avalanche growth in the surrounding of the particle (Cooke, Reference Cooke1982). The objective of this paper is to study the effect of particle contamination (needle protrusion) on spectral characteristics of discharge along insulator surface. It provides an insight into the variation of plasma parameters (plasma temperature and electron density) with distance of particle from cathode. A comparison of Hα line in an insulator bridged gap in air and nitrogen medium is carried out by using the line broadening of Hα.
EXPERIMENTAL METHODS
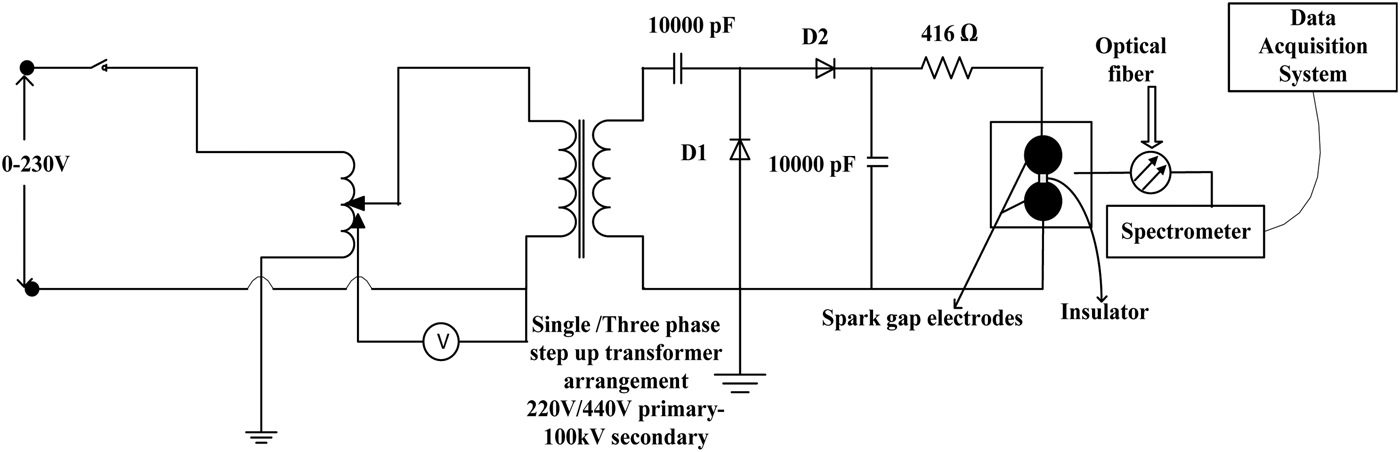
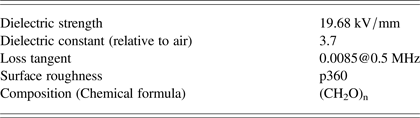
The experimental setup for the OES studies on the insulator surface is shown in Figure 1. A single phase ac supply is fed to a step up transformer arrangement with a secondary voltage of 100 kV. The output of the step-up transformer is fed to a voltage-doubter circuit for the generation of a high voltage dc output which is fed to the spark gap electrodes enclosed within a Perspex chamber for high pressure studies. The spark gap chamber has a view port arrangement of diameter 150 mm where the lens arrangement is placed perpendicular to path of spark gap discharge to capture the light generated as a result of gap breakdown. Two Rogowski profile electrodes of 90 mm diameter and 36 mm thickness forms the spark gap electrodes with a cylindrical spacer of 36 mm diameter and 20 mm thickness placed in between the two electrodes. The spacer used is polyoxymethylene commercially known as delrin, which is a commonly used insulator in pulse power systems. The configuration of spark gap electrodes along with the spacer arrangement is very similar to the configurations reported in the literatures for surface flashover study (Ran et al., Reference Ran, Wang, Wang, Zhang, Yan and Wang2013; Ping Yan et al., Reference Yan, Shao, Wang, Gao, Yuan, Pan, Zhang and Sun2011). Table 1 gives the characteristics of the insulating material used between the electrodes.
Equivalent circuit of the high voltage dc generation and optical spectroscopy measurement

Characteristics of sample (polyoxymethylene)
OES is used to determine the spectrum of the plasma with the collected light mainly coming from the bulk of the plasma. However, there could be some emissions from regions near the electrodes. The emissions produced as a result of surface discharge in air and nitrogen is collected using a 150 mm focal length lens and is coupled to a time integrated spectrometer (Ocean Optics, USB 2000) using a multimode optical fiber arrangement with a core diameter of 400 µm. The integration time of the spectrometer is 1 ms to 65 s, baseline corrected wavelength value of 750 nm and the optical fiber used for signal capture subtends an acceptance angle of 25.4° with a solid angle of 1.491sr. A positive dc voltage of 50 kV was applied to the cylindrical samples of polyoxymethylene with the samples prepared in the following configuration as shown in Figure 2: (1) Needle of 3 mm length with a diameter of 1 mm connected at the cathode tip of the insulator (Type I). (2) Needle of 3 mm length with a diameter of 1 mm connected at the center on the surface of the insulator (Type II). (3) Needle of 3 mm length with a diameter of 1 mm connected at the anode tip of the insulator (Type III). The intensity lines were studied with the three sample configurations in air and nitrogen compressed at a pressure of 1 kg/cm2 to analyze the effect of location of particle contamination on the flashover path.
Sketch of different types of sample used.
RESULTS AND ANALYSIS
Analysis of Surface Flashover Activity in Air Ambience by OES
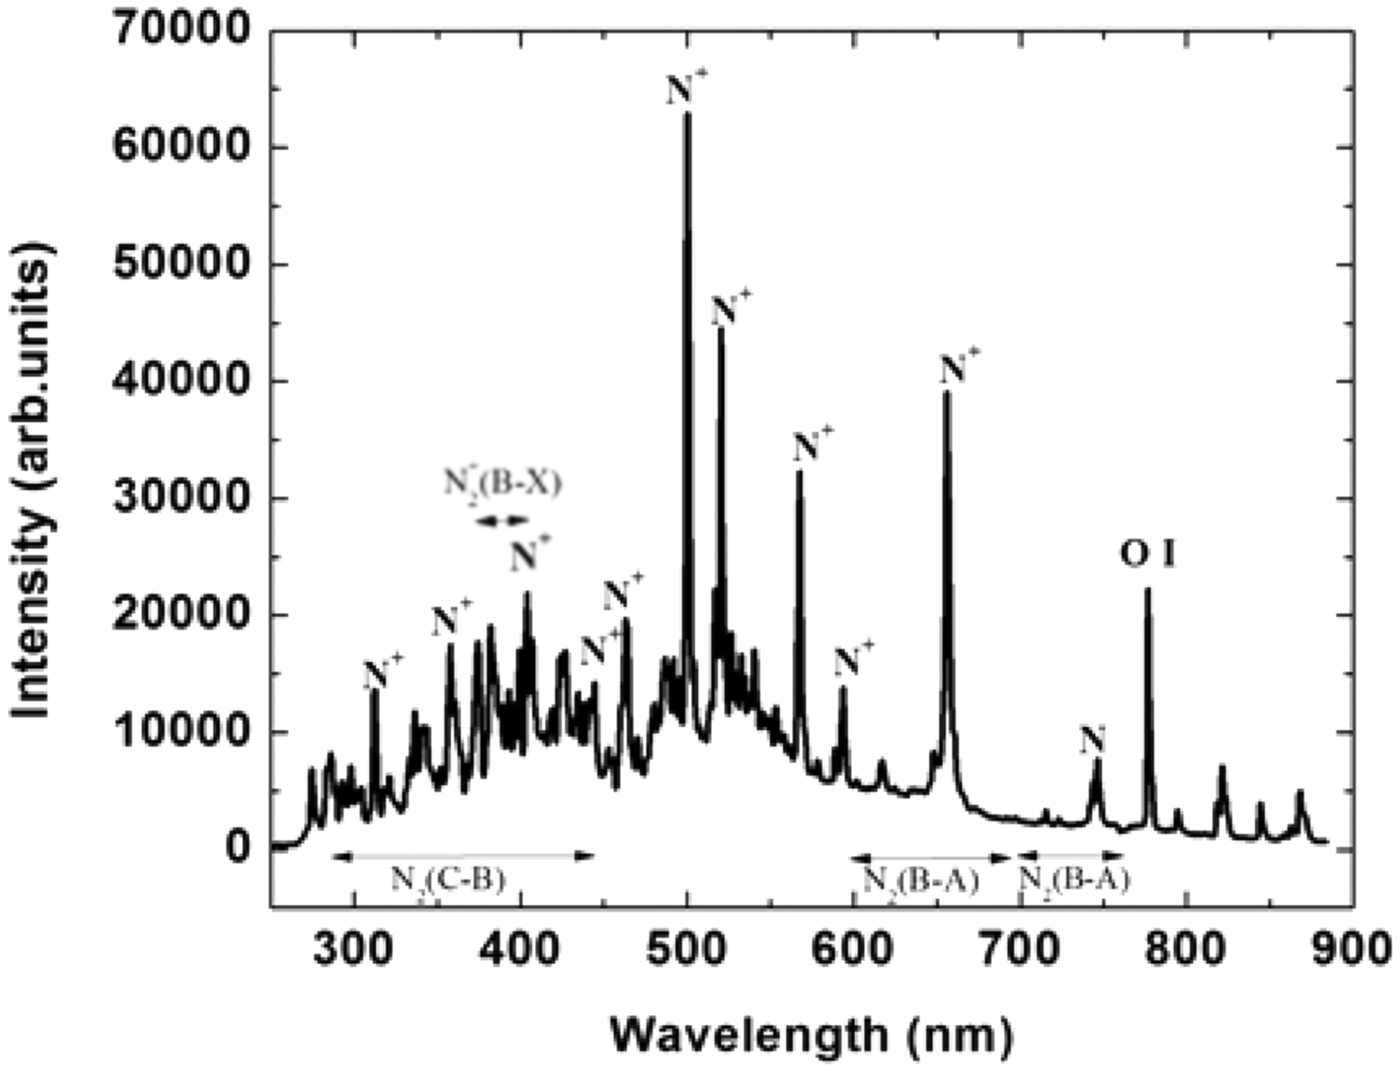
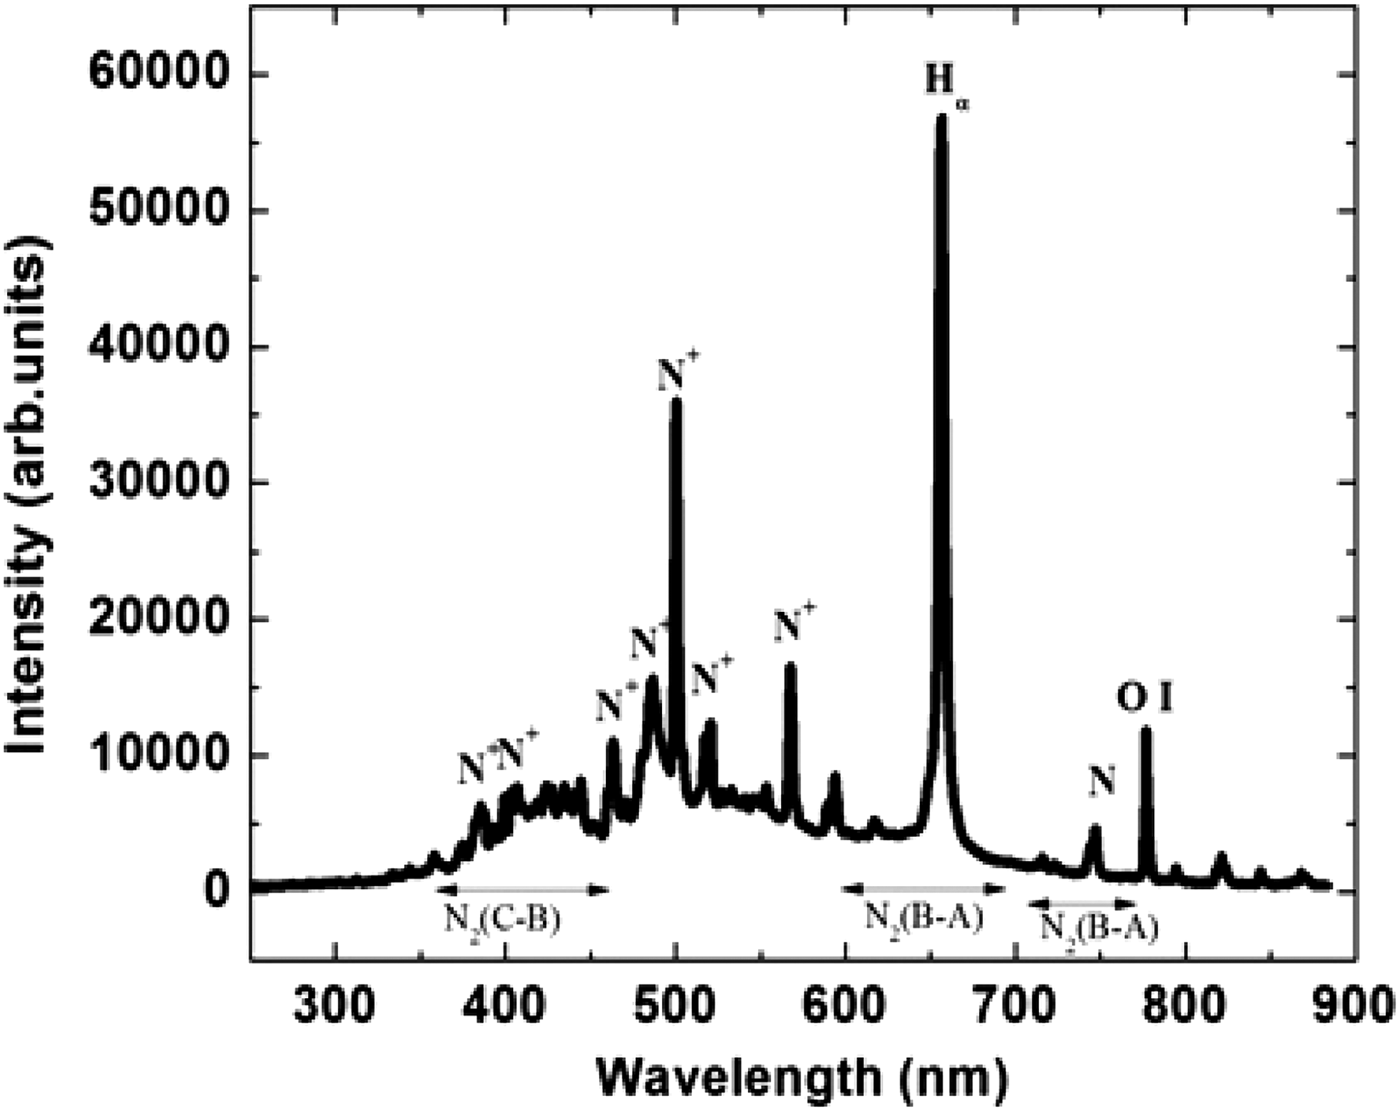
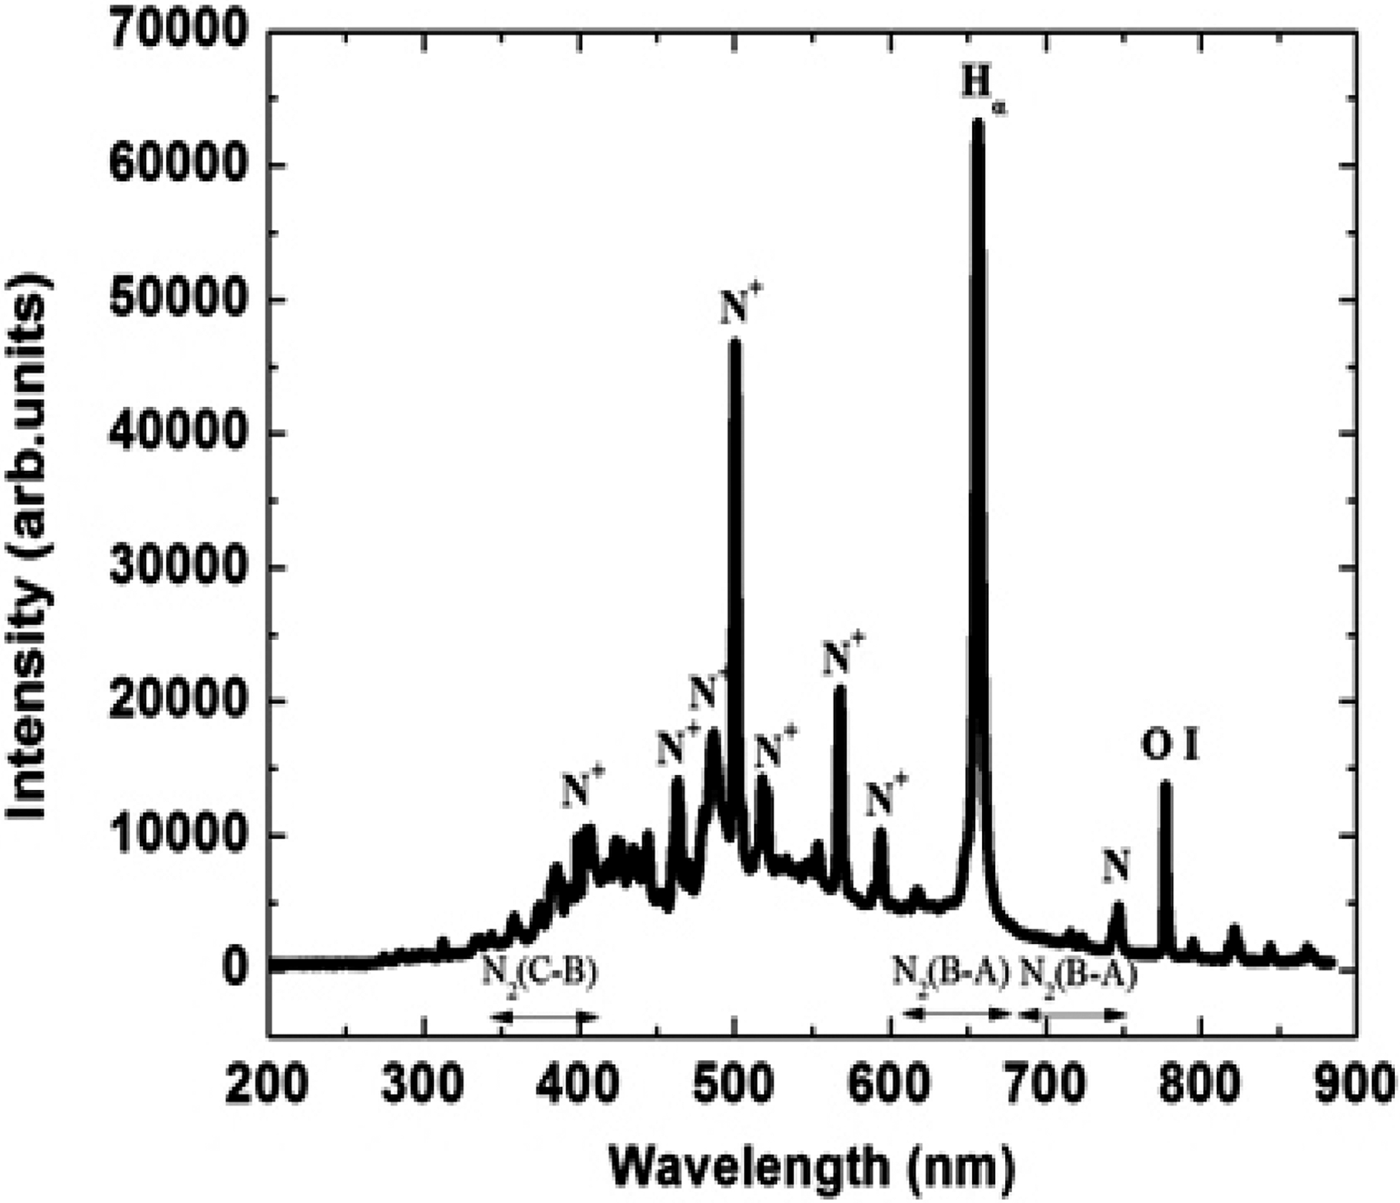
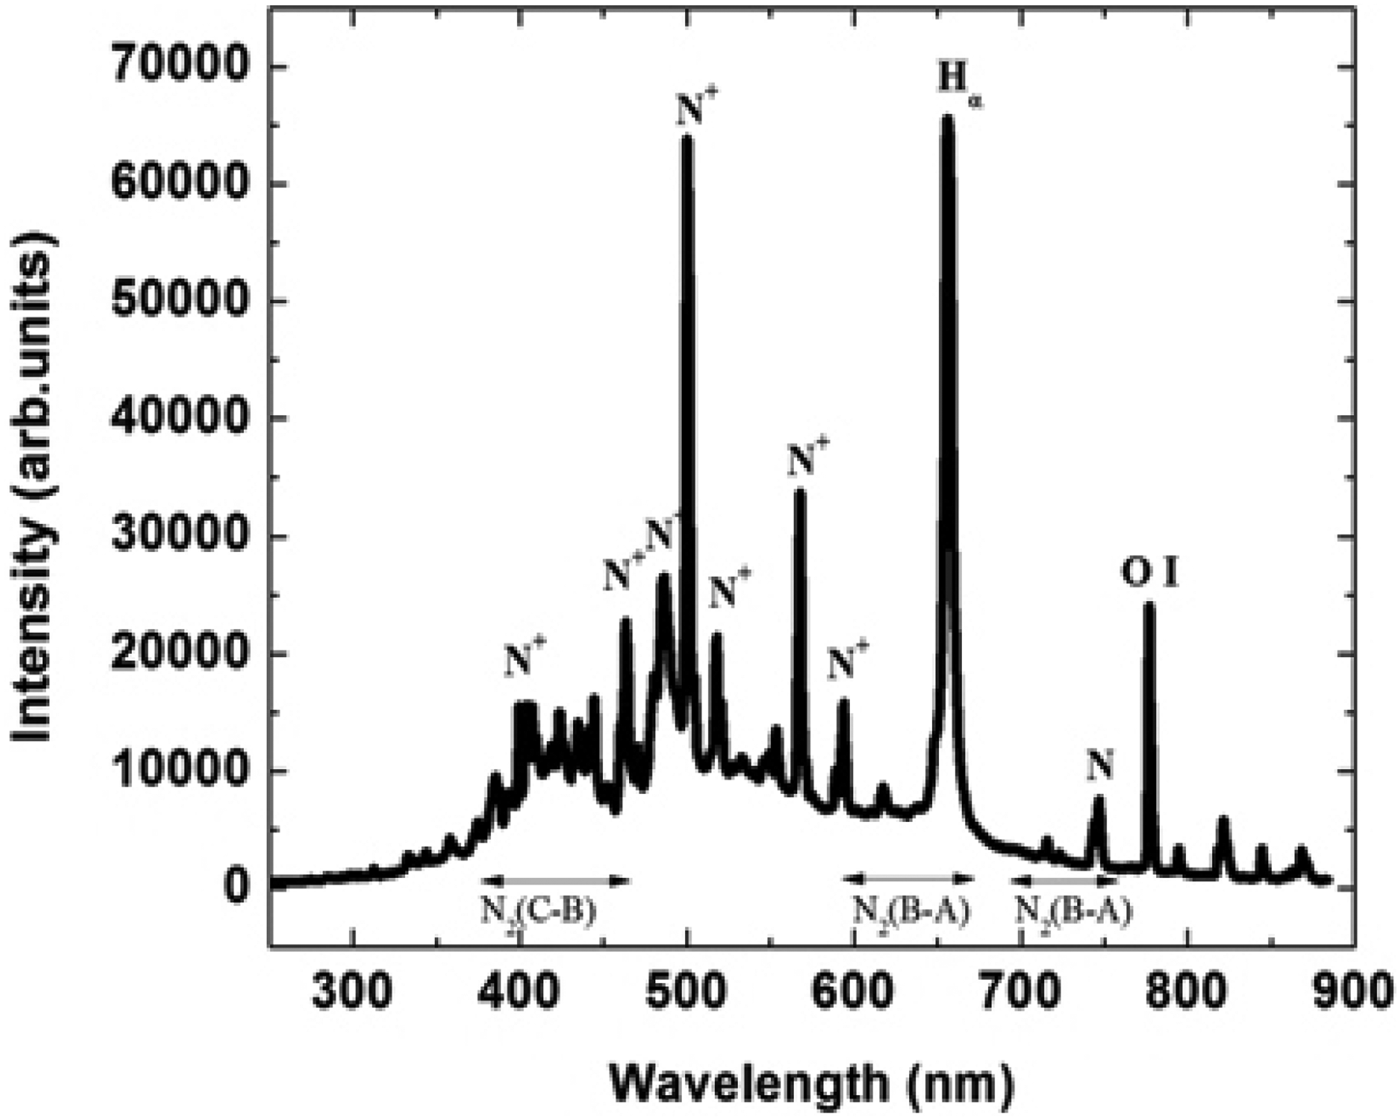
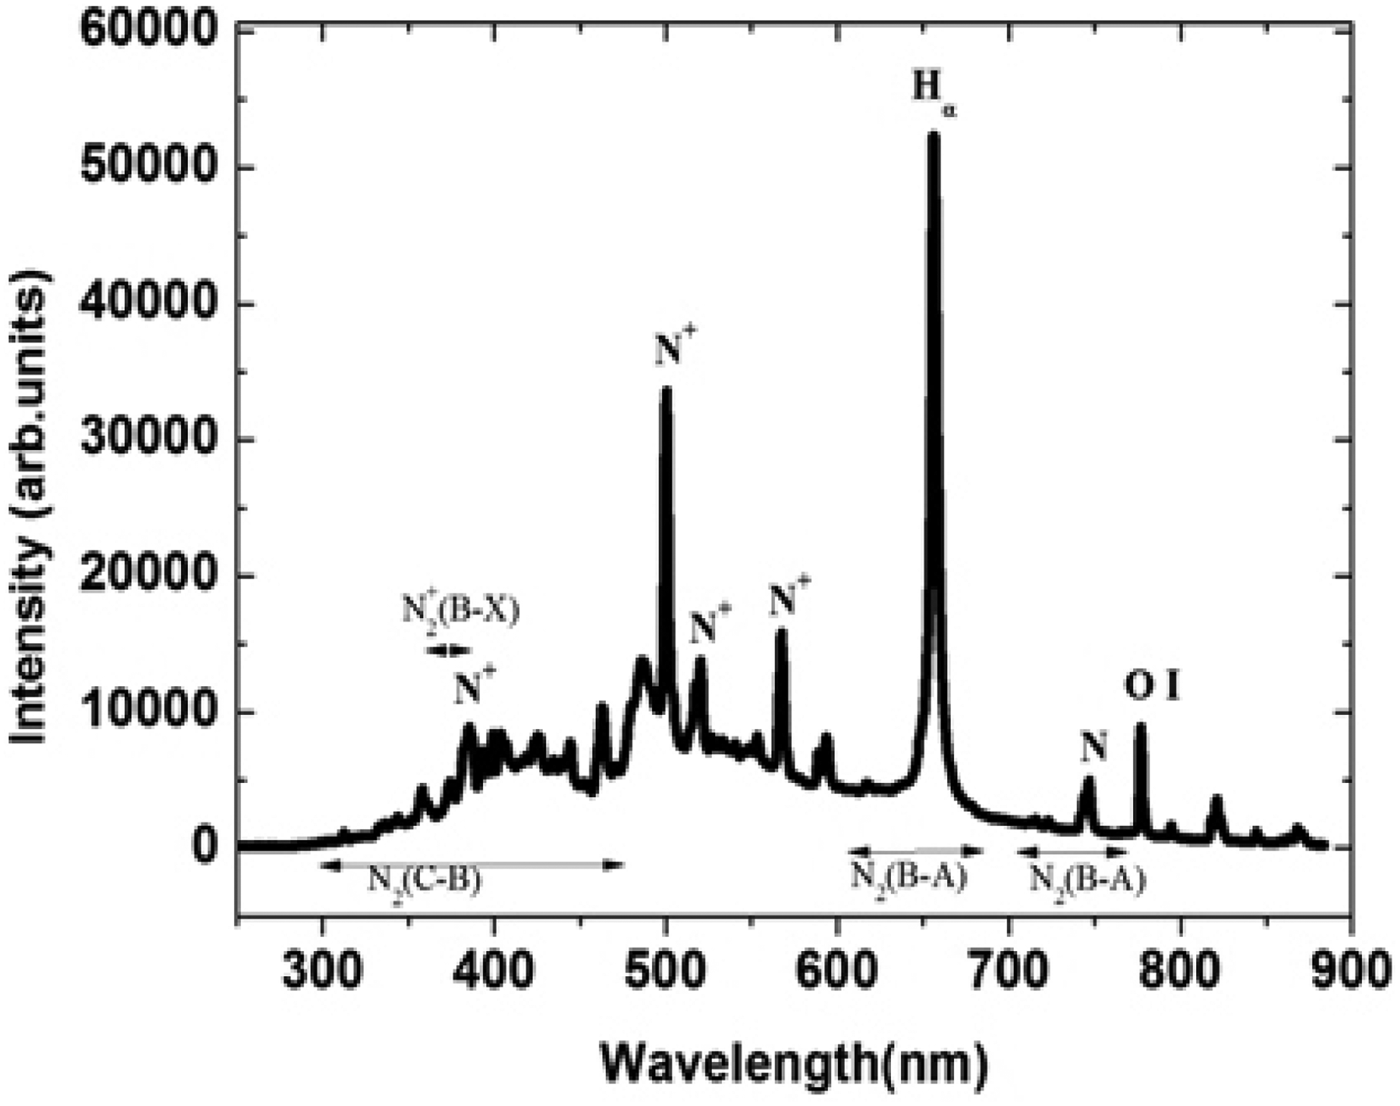
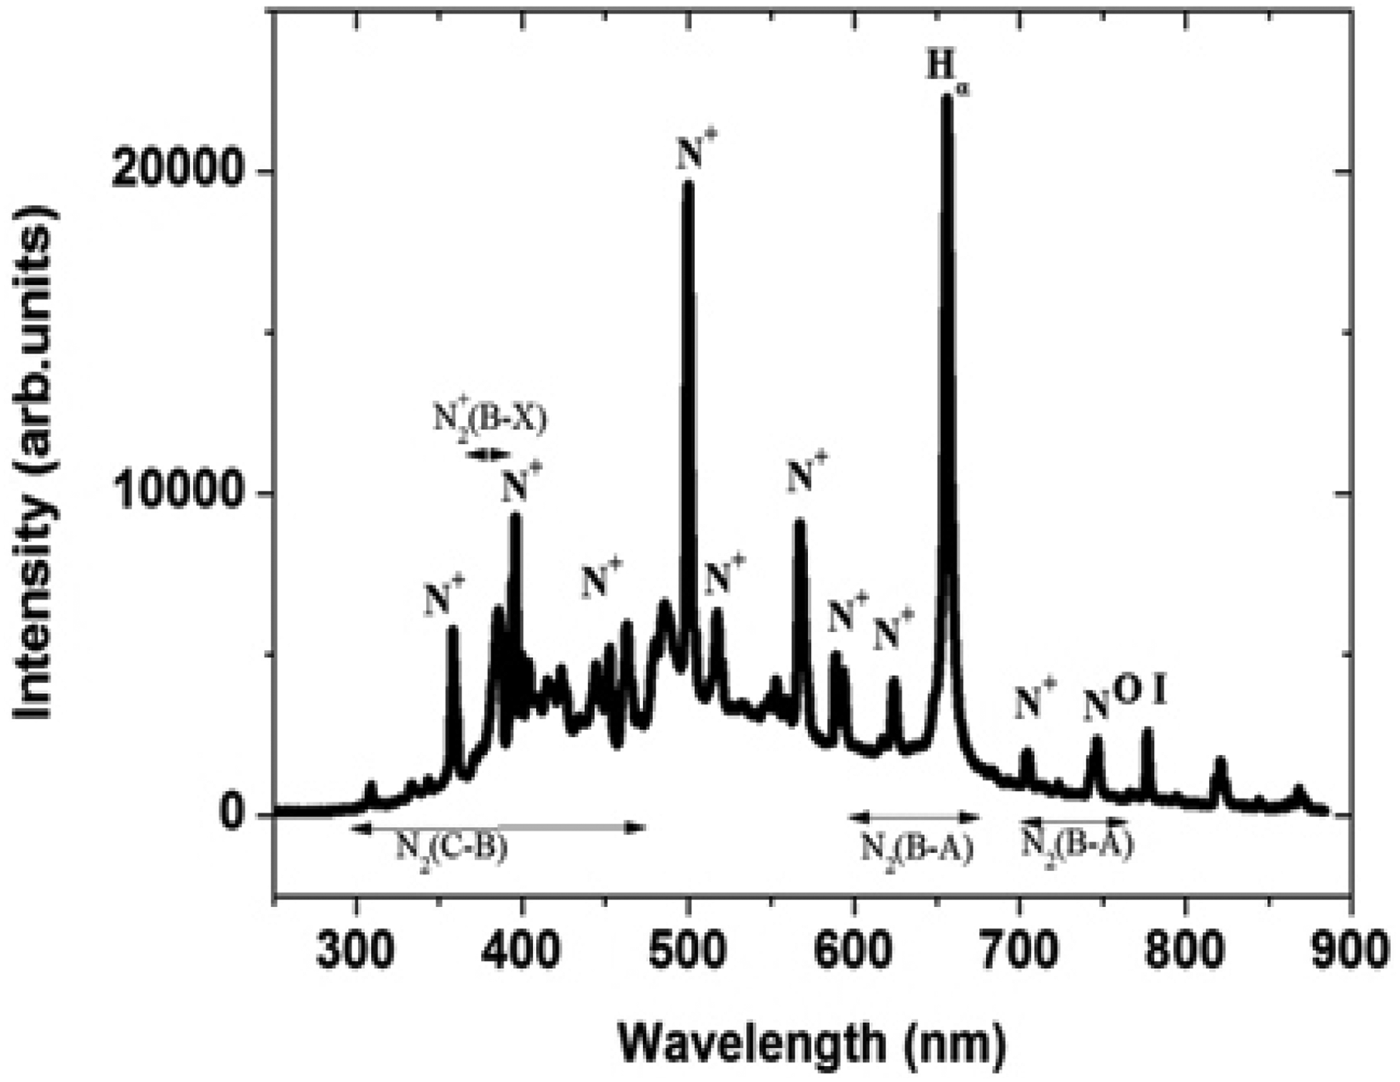
The phenomenon of surface flashover is analyzed based on the relative intensity of the constituents present in the emission spectra during the discharge phase. However, emphasis is laid on the study of the variations in the emission spectra as a result of the introduction of particle contamination at different positions along insulator surface. The need of needle protrusion along the surface of the insulator creates field non-uniformity and initiates discharge along a particular path. Each spectral data is an average of five shots. The emission spectra profile of a spark gap discharge with air as the background medium in the absence of an insulator is shown in Figure 3. A high intensity count of singly ionized nitrogen is observed in emission spectra of air. The spectra clearly shows a part of the molecular band emission spectrum of N2 (C-B) second positive system, which covers a range 300–450 nm and N2 (B-A) first positive system in the range 600–850 nm. The N2+ (B-X) first negative system has a spectral band at 391 nm is present in the emission spectra but is not very prominent. Other lines observed in the spectra originate from excited N and N+ species (Horst et al., Reference Horst, Verreycken, Van Veldhuizen and Bruggeman2012). Air has nitrogen in maximum composition which leads to the highest intensity of N+ in the emission spectra at 500.5 nm and 656 nm as compared to other excited constituents like N and N+ species. The line at 777 nm is of resonant O I as both nitrogen and oxygen form the major constituents of air. The different spectral lines are identified with the use of Lofthus et al. (Reference Lofhtus and Krupenie1977) and the NIST database (Ralchenko et al., Reference Ralchenko, Kramida, Reader and Team2013). The experiment is repeated with an insulator placed between the two electrodes. A needle protrusion as shown in Figure 2 is placed at cathode and the emission spectra are observed in Figure 4. The spectra shows an increase in the intensity of hydrogen (Hα) at 656.3 nm (Bruggeman et al., Reference Bruggeman, Schram, Ágonzález, Rego, Kong and Leys2009) unlike in air which signifies the fact that discharge takes place along insulator surface in a gas insulated system bridged by a solid dielectric. However, the peak observed near 656 nm is that of N+ (Horst et al., Reference Horst, Verreycken, Van Veldhuizen and Bruggeman2012) on which Hα is superimposed leading to an increase in intensity at 656.3 nm in the presence of an insulator.
Optical emission spectra of spark gap discharge in air.
Optical emission spectra of spark gap discharge in air along insulator surface when needle protrusion is at the cathode.
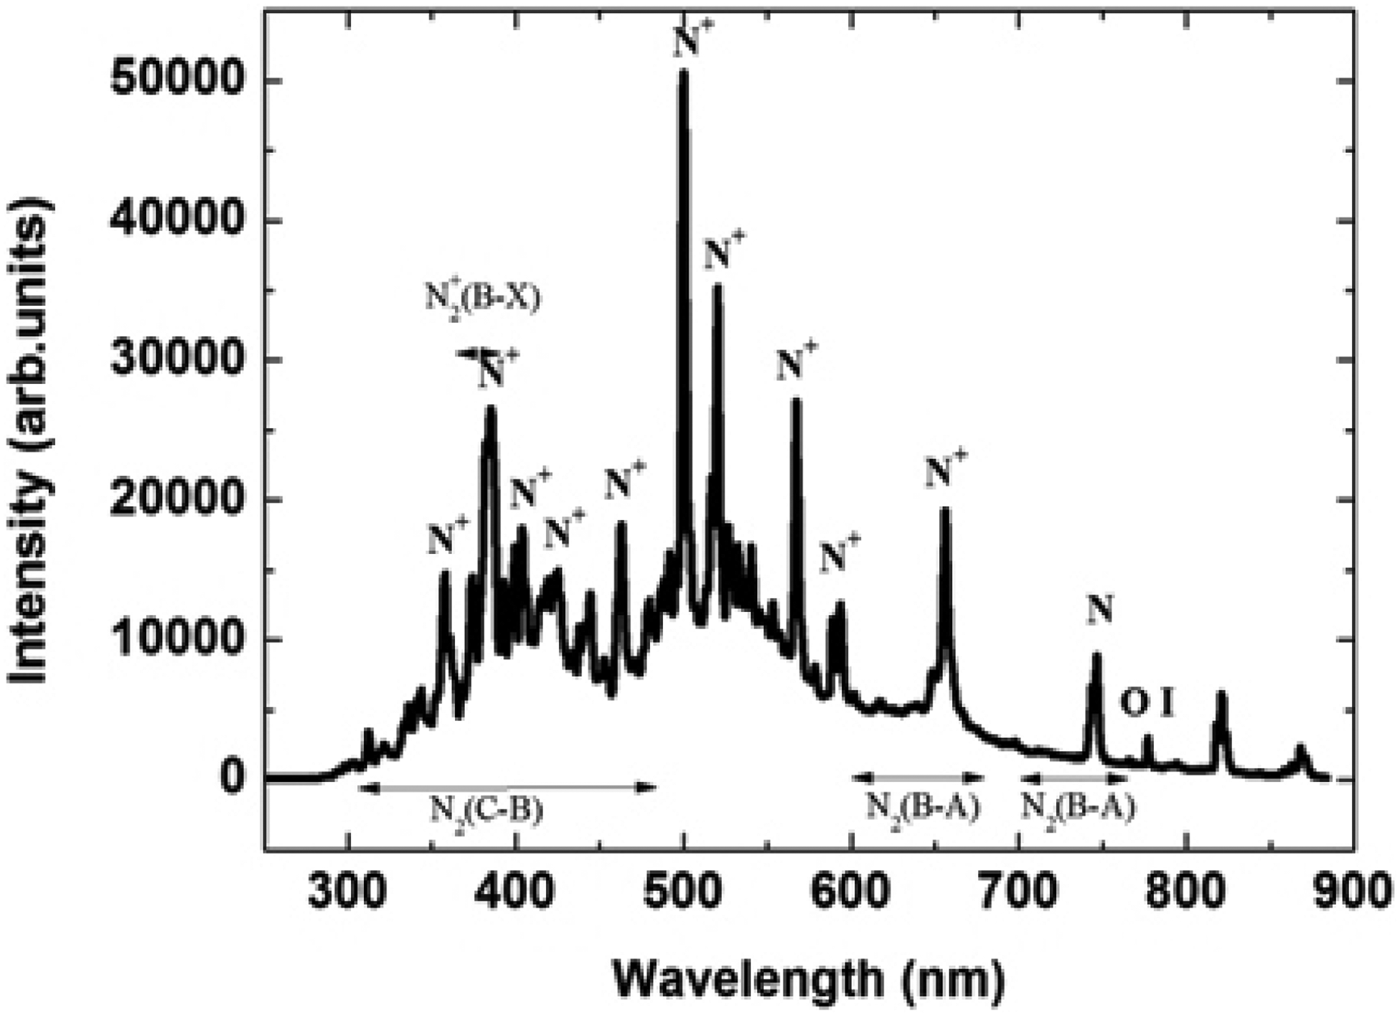
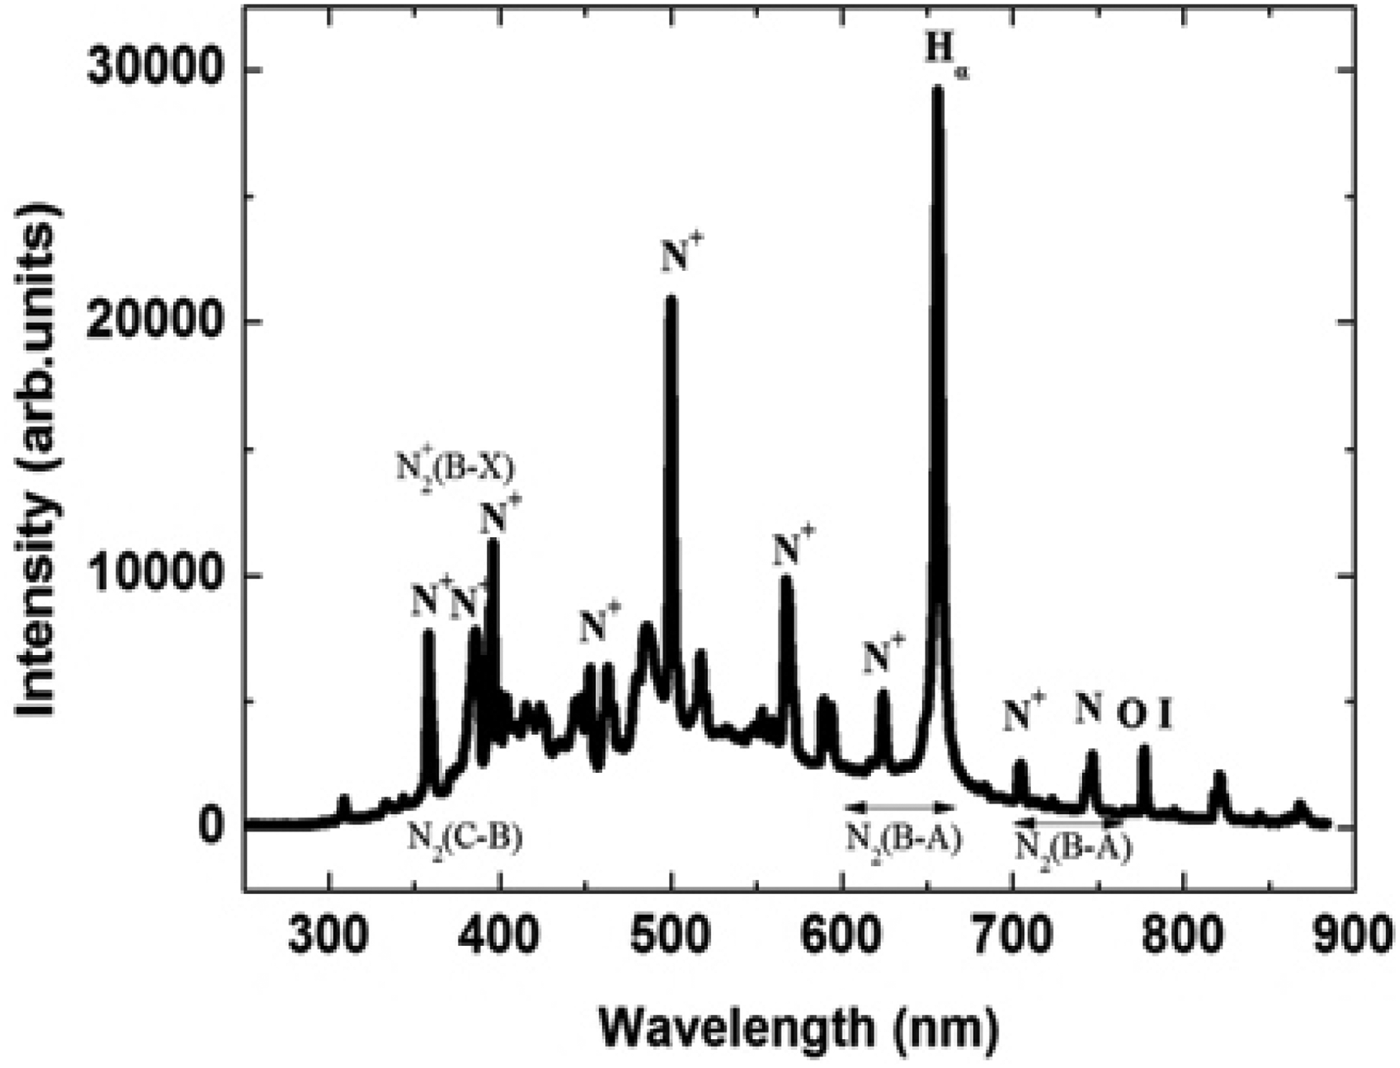
Figures 5 and 6 shows the emission spectra of spark gap discharge when needle is placed at the center and at the anode end along the surface of the insulator, respectively. The maximum intensity of Hα line is observed when needle electrode is placed at the center. This implies that placing a needle at the center reduces the effective gas gap. Discharge paths are formed between the needle and both the electrodes in either direction, leading to greater removal of the materials from insulator surface, which in turn leads to highest intensity of Hα in the atomic spectral lines. With needle protrusion placed at the anode end, however, comparable intensities of nitrogen N+ and Hα lines are observed in the atomic spectra. This explains the fact that the spark bifurcates and multichannel discharge takes place both in the gas and along the surface of the insulator leading to nearly same intensities of both the elements.
Optical emission spectra of spark gap discharge in air along insulator surface when needle protrusion is at the center.
Optical emission spectra of spark gap discharge in air along insulator surface when needle protrusion is at the anode.
Analysis of Surface Flashover Activity in Nitrogen Ambience by OES
The experiments are repeated to optically study the discharge in nitrogen at a pressure of 1 kg/cm2 as the background gas instead of air. Figure 7 shows the spectral lines of spark gap discharge in compressed nitrogen gas. A slight reduction in the values of intensities of singly ionized nitrogen is obtained, which signifies suppression in the intensity of spark discharge in compressed gases. The spectra show a peak in the range of 391 nm which is a molecular band spectrum of N2+ (B-X) first negative system clearly visible in the spectrum. The spark gap breakdown consists of mainly the ignition and spark phase. The line band around 568 nm is that of N+, which implies that there is no significant molecular emission during the spark phase and the emission of first positive system in the spark phase is mainly because of the overlap between the N2 (B-A) and atomic nitrogen lines (Horst et al., Reference Horst, Verreycken, Van Veldhuizen and Bruggeman2012). Similarly the peak around 525 nm is that of presence of atomic nitrogen in the spark phase of discharge. However, in the presence of an insulator, the lines at 568 nm and 525 nm are suppressed as shown in Figures 8, 9, and 10. This shows that the Hα line plays the major role at 656.3 nm which suggest that discharge takes place along the insulator surface. When the needle is present at the anode end of the insulator, the discharge phenomenon is very similar to the one taking place in the air medium with needle at anode. The emission in the ignition phase of discharge mainly comes from the first positive system, second positive system, and first negative system of nitrogen (Horst et al., Reference Horst, Verreycken, Van Veldhuizen and Bruggeman2012).
Optical emission spectra of spark gap discharge in nitrogen.
Optical emission spectra of spark gap discharge in nitrogen along insulator surface when needle protrusion is at the cathode.
Optical emission spectra of spark gap discharge in nitrogen along insulator surface when needle protrusion is at the center.
Optical emission spectra of spark gap discharge in nitrogen along insulator surface when needle protrusion is at the anode.
In the presence of insulator, these band intensities are drastically reduced due to a decrease in voltage withstand strength and emission takes place from any point on the surface of the insulator. The nitrogen used in the flashover study is an IOLAR grade with two percent oxygen as impurity. This results in the presence of a resonant O I at 777 nm. However, the intensity value is very less when compared to flashover along the insulator surface in ambient air medium in which oxygen is 20% by volume which contributes to the high intensity value of O I line.
Comparison of Hα in Air and Nitrogen Medium
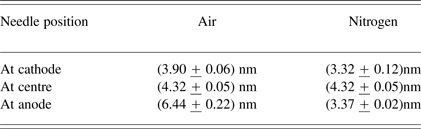
The effect of needle protrusions at different points along the insulator surface is analyzed on the basis of line broadening of Hα in nitrogen and air with insulator. The measured Hα intensity is fitted with a Lorentzian line shape. The full width at half maximums (FWHMs) is then estimated from the fitted curve. The discharge initiates at the triple point (cathode + insulator + gas) and arc begins to develop close to the surface leading to slight ionization and arc development. The FWHM estimated from the Hα line broadening are (3.90 ± 0.06) nm and (3.327 + 0.12) nm in air and nitrogen, respectively. When the needle is placed at the center along the insulator surface there is further increase in ionization and expansion of arc leading to increase in FWHM. Maximum value of FWHM is observed when the needle is at anode, where the arc has completely expanded leading to maximum line intensity. This suggests that the Doppler broadening of the lines to be dominant. Figure 11 shows line broadening of Hα in air and nitrogen with needle (protrusion) at anode.
Line broadening of Hα in nitrogen and air with insulator (needle at anode).The spectrum of N is subtracted from the spectrum of Hα and N to obtain only the Hα line.
Table 2 shows a comparison of FWHM in air and nitrogen for different positions of the needle protrusions. The continuous increase in FWHM in air as the protrusion moves away from the cathode is mainly due to the presence of moisture in air. The hydrogen present in moist air ionizes more rapidly than the ionization of hydrogen along the insulator surface. However, such freely available hydrogen is not present in a pure nitrogen environment which leads to an increased value of intensity and hence an increased FWHM in air than in nitrogen.
Shows a comparison of FWHM in air and nitrogen for different positions of the needle protrusions
Estimation of Plasma Temperature and Electron Density
The variation in plasma temperature and electron density is studied as a function of distance of the particle protrusion from the cathode along the surface of the insulator. The line pair approach was used to estimate plasma temperature and density in which relative intensities of emission lines were used. The plasma temperature and density estimations are based on the assumption of local thermodynamic equilibrium (Antony et al., Reference Anthony, Jatana, Vasa, Sridharraja and Laxmiprasad2010). For the plasma in local thermodynamic equilibrium, the energy level population of the different species is given by the Boltzmann's law (Unnikrishnan et al., Reference Unnikrishnan, Alti, Kartha, Santhosh, Gupta and Suri2010)
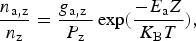 $$\displaystyle{{{n_{{\rm a}\comma {\rm z}}}} \over {{n_{\rm z}}}} = \displaystyle{{{g_{{\rm a}\comma {\rm z}}}{\rm \; }} \over {{P_{\rm z}}}}\exp \lpar \displaystyle{{ - {E_{\rm a}}Z} \over {{K_{\rm B}}T}}\rpar \comma \;$$
Z refers to the ionization stage of the species (Z = 0 and 1 correspond to neutral and single ionized atoms, respectively) k B is the Boltzmann's constant, T is the plasma temperature, n a,z, E a and g a,z are the population, energy, and degeneracy of the upper energy level a, n z is the number density and P z is partition function of the species in ionization stage Z. The integrated intensity I z of a spectral line occurring between upper and lower energy level i of the species in the ionization stage Z is given by
 $${\rm \; \; }{I_{\rm z}} = \displaystyle{{hc} \over {4{\rm \Pi }{{\rm \lambda}_{{\rm ai}\comma {\rm Z}}}}}{A_{{\rm ai}\comma {\rm Z}}}\displaystyle{{{n_{{\rm a}\comma {\rm z}}}} \over {{P_{\rm z}}}}{g_{{\rm a}\comma {\rm z}}}L{\rm \; exp}\left({\displaystyle{{ - {E_{{\rm k}\comma {\rm z}}}} \over {{K_{\rm B}}T}}} \right)\comma \;$$
where h is the Planck's constant, c is the speed of light, L is characteristics length of plasma, λai,Z is the transition line wavelength and A ai,Z is the transition probability.
The intensity ratio of the two lines of the same species of the ionization stage Z is given by
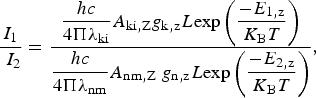 $$\displaystyle{{{I_1}} \over {{\rm \; }{I_2}}} = \displaystyle{{\displaystyle{{hc} \over {4{\rm \Pi }{{\rm \lambda}_{{\rm ki}}}}}{A_{{\rm ki}\comma {\rm Z}}}{g_{{\rm k}\comma {\rm z}}}L{\rm exp}\left({\displaystyle{{ - {E_{1\comma {\rm z}}}} \over {{K_{\rm B}}T}}} \right)} \over {\displaystyle{{hc} \over {4{\rm \Pi }{{\rm \lambda}_{{\rm nm}}}}}{A_{{\rm nm}\comma {\rm Z}}}{\rm \; }{g_{{\rm n}\comma {\rm z}}}L{\rm exp}\left({\displaystyle{{ - {E_{2\comma {\rm z}}}} \over {{K_{\rm B}}T}}} \right)}}\comma \;$$
where I 1 is the line intensity from k-i is transition and I 2 is the line intensity from n-m transition.
Using Eq. (3) we have
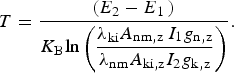 $$T = \displaystyle{{\lpar {E_2} - {E_{1{\rm \; }}}\rpar } \over {{K_{\rm B}}{\rm ln}\left({\displaystyle{{{{\rm \lambda}_{{\rm ki}}}{A_{{\rm nm}\comma {\rm z\; }}}{I_1}{g_{{\rm n}\comma {\rm z}}}} \over {{{\rm \lambda}_{{\rm nm}}}{A_{{\rm ki}\comma {\rm z}}}{I_2}{g_{{\rm k}\comma {\rm z}}}}}} \right)}}.$$
The wavelengths λnm and λki of N+ lines used in the temperature calculation are 567.4 nm and 500.5 nm, respectively. Figure 12 shows a variation of plasma temperature with distance of needle from cathode along the insulator surface. However, there is not much variation in temperature with distance of particle contamination from cathode. A slight increase in plasma temperature in nitrogen as compared to air can be attributed to reduction in the mean free path in nitrogen with pressure which leads to more number of collisions between the particles leading to an increase in temperature. The ratio of the intensities which is evaluated using two similar wavelengths of nitrogen or air increases implying more ionization as observed with an increase in electron density as shown in Figure 13. This increased intensity ratio leads to reduction in plasma temperature as the particle moves away from the cathode. The effect is independent of the nature of the gas medium surrounding the particle. The results are similar to the study on laser produced carbon plasma in which the temperature shows a decreasing behavior with distance (Harilal et al., Reference Harilal, Bindhu, Issac, Nam Poo Ri and Vallabhanac1997). The electron density calculated from the atom and ion spectral lines that is emitted from the plasma produced by the discharge between the cathode anode (AK) gap is determined by the Saha-Boltzmann's equation and is given by
 $${n_{\rm e}} = \displaystyle{{{I_{\rm a}}} \over {{I_{\rm i}}}}6.6 \times {10^{21}}\displaystyle{{{A_{\rm i}}{g_{\rm i}}} \over {{A_{\rm a}}{g_{\rm a}}}}\exp \left({\displaystyle{{{E_{{\rm ion}}} + {E_{\rm i}} - {E_{\rm a}}} \over T}} \right)\comma \;$$
where n e is the electron density, I a and I i are the intensity values of same species in different ionization stages, i.e., of N and N+, E i, A ig i, and E a, A ag a are the energy, transition probabilities of states and degeneracy of the upper energy level and E ion is the minimum energy required to create an ion pair, respectively, obtained from the NIST database (Ralchenko et al., Reference Ralchenko, Kramida, Reader and Team2013). The wave-lengths of N+ and N used in the density calculation are 500.5 nm and 746.8 nm, respectively. Figure 13 shows the variation in electron density with the distance of particle (needle) from cathode. An increase in the distance of particle away from cathode serves as conducting medium along the insulator surface which leads to more desorption of materials along the surface. Also the cumulative effect of secondary electron multiplication along the insulator surface lead to net increase in electron density as the particle moves away from the cathode. However, the density growth in nitrogen is less compared to that in air proves the fact of higher breakdown voltage in nitrogen insulated gap. The additional electrons generated in the gap helps in rapid ionization of the gap causing the breakdown at a reduced voltage.
Variation of plasma temperature with distance of needle from cathode.
Variation of electron density with distance of needle from cathode.
CONCLUSION
The technique of optical emission spectroscopy is used to study the dc discharge along polyoxymethylene subjected to particle contamination in air and nitrogen medium. A variation in the intensities of the constituent atoms implies material erosion and electron desorption from insulator surface which is being dependent on the position of the particle contamination along the insulator surface. A reduction in the intensity of spark is observed in nitrogen medium could be due to the reduction in energy gained between successive collisions as the pressure is increased and hence the collective intensity is less when the excited atoms return to the ground state.
A reduction is observed in the value of plasma temperature from 0.441 eV to 0.437 eV with increase in the distance of particle contamination from cathode. The increase in electron density from 2.1 × 1012 cm−3 to 2.8 × 1012 cm−3 can be attributed to increased material desorption and secondary electron multiplication with increase in distance of particle from cathode. Future work involves the use of different gases like argon, helium and different insulator materials to further study the variations in the discharge phenomena.