Somatic cell count (SCC) is a widely used marker of udder health representing an analytical parameter to evaluate intramammary infections and related changes in milk quality (Raynal-Ljutovac et al. Reference Raynal-Ljutovac, Pirisi, de Crémpux and Gonzalo2007; Koess & Hamann, Reference Koess and Hamann2008). It has been reported that ewe milk with high SCC shows impaired milk quality in terms of gross composition, and increased proteolytic activity (Albenzio et al. Reference Albenzio, Caroprese, Marino, Santillo, Taibi and Sevi2004, Reference Albenzio, Caroprese, Santillo, Marino, Muscio and Sevi2005).
SCC measures all types of cells, and it does not discriminate the different types of milk cells such as eosinophils, lymphocytes, macrophages, neutrophils and epithelial cells (Kehrli & Suster, 1994). Differentiation of the type of cells in milk is a diagnostic tool to detect mastitis, polymorphonuclear leucocyte (PMN) being the principal leucocytes that increase during pathogen invasion. Furthermore, PMN were found to be responsible for intense proteolysis in ewe milk samples (Albenzio et al. Reference Albenzio, Santillo, Caroprese, d'Angelo, Marino and Sevi2009) whereas macrophages were found to minimally contribute to the proteolytic activity in ewe milk (Caroprese et al. Reference Caroprese, Marzano, Schena, Marino, Santillo and Albenzio2007). Differential leucocyte cell count, both in milk with low and high SCC, could be a useful approach to detect not only the immune status of mammary gland but also to predict the changes in milk quality.
The first method for enumerating and differentiating somatic cells in milk is direct microscopic differential count. In cow milk the use of flow cytometric dot plot to differentiate cells and to determine the percentages of cell types is well documented (Leitner et al. Reference Leitner, Shoshani, Krifucks, Chaffer and Saran2000; Pillai et al. Reference Pillai, Kunze, Sordillo and Jayarao2001; Dosogne et al. Reference Dosogne, Vangroenweghe, Mehrzad and Massart-Leën2003; Koess & Hamann, Reference Koess and Hamann2008). In ewe milk, previous research reports the use of the flow cytometry method for the identification of macrophages (Caroprese et al. Reference Caroprese, Marzano, Schena and Sevi2008) and for leucocyte differential count in ewe bulk milk (Albenzio et al. Reference Albenzio, Santillo, Caroprese, d'Angelo, Marino and Sevi2009). In ewe milk, about 50% of SCC variance is attributed to several physiological and environmental factors, therefore the extrapolation of dairy cattle research findings on milk SCC to sheep could be misleading. Although some studies on differential leucocyte count using microscopy (Morgante et al. Reference Morgante, Ranucci, Paeselli, Casoli and Duranti1996; Cuccuru et al. Reference Cuccuru, Moroni, Zecconi, Casu, Caria and Contini1997) and flow cytometry (Albenzio et al. Reference Albenzio, Santillo, Caroprese, d'Angelo, Marino and Sevi2009) have been used for differential leucocyte count in ewe milk samples with <600 000 cells/ml and >1 000 000 cells/ml, no data were reported on the distribution of leucocyte population in ewe milk samples with different levels of SCC.
This study was undertaken to i) compare flow cytometry and direct microscopic count for the differentiation of macrophages, lymphocytes and PMN in ewe milk; ii) test the flow cytometric method for differential leucocyte count in ewe milk with low and high SCC; iii) study the distribution of leucocytes in individual ewe milk with low and high SCC.
Materials and Methods
Experimental design
Individual ewe milk samples were collected from 40 Comisana ewes homogeneous for age, stage of lactation (mid lactation), parity, number of lambs born, mean body weight (55·55±1·81 kg) and analysed for SCC using a Fossomatic Minor (Foss Electric, Hillerød, Denmark) according to the International Dairy Federation standard (IDF, 1995). Milk samples were grouped for SCC in low-SCC (LSCC) when the count was lower than 5·00×105/ml and high-SCC (HSCC) when the count was higher than 1·00×106/ml. Mesophilic bacteria (Plate Count agar, Oxoid, Milano, Italy) at 37°C for 24 h were enumerated in ewe milk samples using standard procedures.
Ewes were housed on straw litter; they grazed and were supplemented with hay and concentrate. Ewes were healthy at the beginning of the trial and were monitored by veterinarians throughout the experiment. Ewes showing any sign of clinical mastitis were excluded from milking. The ewes were milked using pipeline milking machines.
Leucocyte differential count
Leucocyte differential count was performed according to Koess & Hamann (Reference Koess and Hamann2008) with some modifications. Milk samples (200 ml) were diluted with 200 ml of phosphate-buffered saline (PBS; pH 7·4) +0·02% NaN3 and were centrifuged at 1000 g at 4°C for 15 min. The fatty fraction and supernatant were removed. Recovered pellets were washed with 30 ml of PBS and centrifuged twice at 400 g at 4°C for 10 min. Cell pellets were suspended in 500 μl of PBS and counted using Fossomatic Minor to obtain a concentration of at least 106cells/ml. Samples of 100 μl of cells were centrifuged at 350 g at 10°C for 4 min; the supernatant was discarded and cells were labelled with 10 μl of mouse anti-bovine CD5 conjugated to R-Phycoerythrin (RPE) (MCA2215PE, Serotec, Oxford, UK) for the detection of lymphocytes; with 10 μl of mouse anti-bovine CD11b conjugated to Fluorescein Isothiocyanate (FITC) (MCA1425F, Serotec, Oxford, UK) for the detection of PMN; with 5 μl of mouse anti-human CD14 conjugated to RPE–Alexa Fluor 647 (MCA 1568P647 T, Serotec, Oxford, UK) for the detection of macrophages. After incubation at 4°C for 20 min, 100 μl of PBS were added and centrifuged at 350 g at 10°C for 10 min. Samples were acquired by flow cytometry (Cell Lab Quanta SC™, Beckman Coulter Inc., Fullerton CA, USA). Linear amplification of the forward scatter (FS) and side scatter (SS) light signals was set with logarithmic amplification of the fluorescence signals. The 488-nm excitation wavelength was used.
Milk lymphocytes, macrophages and PMN were selected for analysis by gating on the FS and SS dot plot. FITC and RPE fluorescence were measured at 519 nm and 578 nm, respectively. FL1 versus FL2 was then used to determine the proportions of CD14/CD11b and CD14/CD5. The proportion of non viable milk cells was determine by staining cell pellets, suspended in 200 μl of PBS, with 50 μl of propidium iodide (PI, P4864, Sigma-Aldrich, Milan, Italy) (4 μl/ml) and incubated for 15 min. Samples were acquired by flow cytometry (Cell Lab Quanta SC™) and fluorescence was measured at 617 nm (FC, flow cytometric method).
Microscopic differential leucocyte count was performed to compare results from microscope slides and flow cytometric count. Slides were prepared using 5 ml of milk centrifuged at 1000 g for 15 min; the smears were stained with May-Grünwald-Giemsa (MDLC, microscopic differential leucocyte count method).
Statistical Analyses
All the variables were tested for normal distribution using the Shapiro-Wilk test (Shapiro & Wilk, Reference Shapiro and Wilk1965).
Data on the differential count of lymphocyte, PMN and macrophage detected using the two different methods (FC and MDLC) were processed by ANOVA for repeated measures of SAS (1999).
The model utilized was (Eq. 1):

where μ is the overall mean; α is the effect of differential count method (i=1–2); β is the different cell count variation within the method; γ is the effect of SCC level (k=1–2); αγ is the interaction of differential cell count method×SCC level and ε is the error.
Percentage and count of lymphocyte, PMN, and macrophage obtained using FC were analysed using an ANOVA with one factor (level of SCC) using the following model (Eq. 2)

where μ is the overall mean; α is the effect of SCC level (i=1–2); β is individual milk sample variation within level of SCC; and ε is the error.
Linear simple correlations (LSCs) between lymphocyte, PMN and macrophage detected using FC and lymphocyte, PMN, and macrophages detected using MDLC were also investigated. LSCs were performed between total SCC, lymphocyte, PMN and macrophage and non viable cells.
When significant effects were found (at P<0·05) Student's t test was used to locate significant differences between means.
Results and Discussion
The average SCC was 225·10±94·99×103cells/ml in LSCC and 1247·08±117·82×103/ml in HSCC individual ewe milk. Mesophilic cell load did not exceed the threshold of 3 log10 cfu/ml and 5 log10 cfu/ml in LSCC and HSCC, respectively. LSCC individual ewe milk showed good hygienic quality for both parameters analysed so that ewe milk could be processed as raw milk, whereas HSCC ewe milk required heat treatment before cheese production according to EEC directive 92/46. Although SCC threshold is not fixed for ovine milk the EEC directive regulates that when mesophilic cell load exceed 5 log10 cfu/ml ewe milk has to be heat treated for cheese production.
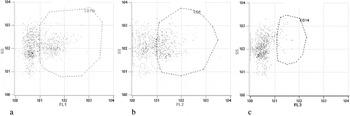
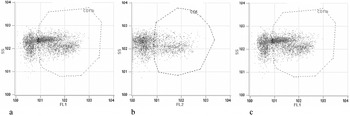
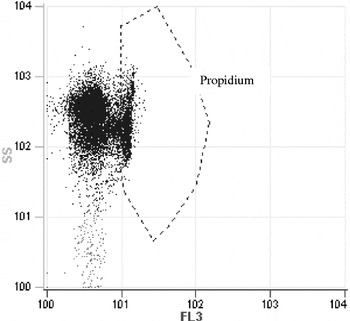
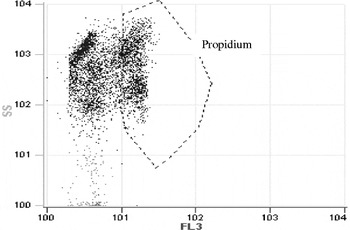
Microscopy is the common method used to determine the percentages of milk leucocyte cells; this method, although slow and labour intensive, remains in many instances the reference method against which other methods are calibrated (Kelly, Reference Kelly, Roginski, Fuquay and Fox2003). In the present study FC procedure was applied to ewe milk for cell type differentiation: the method is based on differential SCC by fluorescence properties and shapes of cells into clusters which can be directly related to cell types. Figures 1 and 2 show dot plots of different cell populations detected using FC in ewe milk with low and high SCC, respectively. Figures 3 and 4 show dot plots of non viable cells using staining with PI detected using FC in ewe milk with low and high SCC, respectively.
Dot plots of different cell populations using flow cytometry a) CD11b positive cells, b) CD5 positive cells, c) CD14 positive cells in ewe milk with low somatic cell count.

Dot plots of different cell populations using flow cytometry a) CD11b positive cells, b) CD5 positive cells, c) CD14 positive cells in ewe milk with high somatic cell count.

Dot plots of non viable cells using staining with propidium iodide (PI) in ewe milk with low somatic cell count.

Dot plots of non viable cells using staining with propidium iodide (PI) in ewe milk with high somatic cell count.

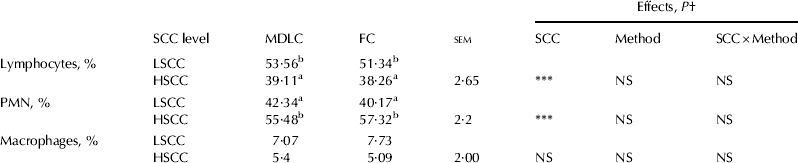
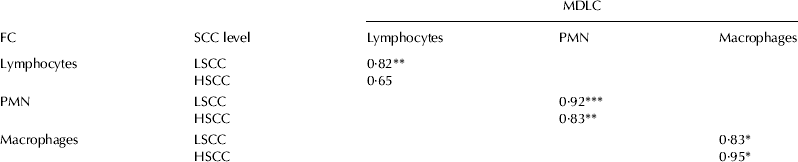
Table 1 gives the percentage of the main leucocyte populations in LSCC and HSCC ewe milk detected using FC and MDLC. No differences were found between the two methods for the detection of macrophages, lymphocytes and PMNs both in ovine milk with low and high SCC thus the use of FC can be suggested as a routine test for rapid discrimination of leucocyte cells in ewe milk. Indeed, a positive correlation was found in lymphocytes, PMNs and macrophages detected using MDLC and FC (Table 2). Furthermore, on average FC was highly correlated to the official direct microscopy method for all leucocyte classes: macrophages (r=0·79, P<0·01), lymphocytes (r=0·84, P<0·001) and PMNs (r=0·94, P<0·001).
Comparison of average percentage differential count of lymphocytes, PMN and macrophages from direct microscopic differential leucocyte count (MDLC) and flow cytometry (FC) in ewe milk samples with Low (LSCC) and High (HSCC) level of SCC. Values are means±sem, n=80

† NS, not significant; *** P<0·001
a, b Indicative level of significance within a row
Correlation coefficients between lymphocytes, PMN, and macrophages detected using flow cytometry method (FC) and lymphocytes, PMN and macrophages detected using direct microscopic differential leucocyte count (MDLC) in ewe milk samples with Low (LSCC) and High (HSCC) level of SCC. Values are means±sem, n=80

* P<0·05; ** P<0·01; *** P<0·001
It is reported that the small amount of cells in milk from healthy cow (Dosogne et al. Reference Dosogne, Vangroenweghe, Mehrzad and Massart-Leën2003) and ewe milk (Albenzio et al. Reference Albenzio, Caroprese, Marino, Santillo, Taibi and Sevi2004) makes the identification of leucocytes more difficult than in high-SCC milk using microscopic differential cell count. In the present study, the optimization of preliminary procedures allowed the determination of the different cells types in LSCC ewe milk using the two methods.
Table 3 shows the percentage and the number of milk leucocyte differential count using FC. Percentage of lymphocytes in ewe milk was higher in LSCC (50%) than in HSCC (39%); the differences found between two classes of SCC are due to the relative variations of leucocytes, in particular of PMN cells. Lymphocyte counts ranged from 273·91±56·62×103cells/ml to 308·90±46·15×103cells/ml in LSCC and HSCC, respectively. The absence of differences in the lymphocyte count between LSCC and HSCC suggests that in ewe milk this population is quite stable, being not influenced by changes in total SCC. This finding leads to the hypothesis that in ewe milk with low- and high-SCC, lymphocytes are not recruited in the ewe mammary gland in response to inflammation, suggesting that resident lymphocytes may be able to mount an immune response. Lymphocytes are divided into two subsets: T and B lymphocytes; in cow milk the percentage of B lymphocytes remains fairly constant during lactation (Sordillo & Streicher, Reference Sordillo and Streicher2002). Previous studies report that in ewe milk with <600 000 cells/ml lymphocytes represented about 40% of leucocyte population in early and mid lactation and were the lowest at the end of lactation (Albenzio et al. Reference Albenzio, Santillo, Caroprese, d'Angelo, Marino and Sevi2009) while ewe milk with >1 000 000 cells/ml lymphocytes were about 43% (Albenzio et al. Reference Albenzio, Caroprese, Marino, Santillo, Taibi and Sevi2004) throughout lactation. The dynamics of lymphocytes seem to have a constant decrease during lactation in ewe (Cuccuru et al. Reference Cuccuru, Moroni, Zecconi, Casu, Caria and Contini1997); in contrast other authors found that concentrations of lymphocytes are high in the secretion of involuted udders but decrease to very low numbers during the week preceding calving and at calving (Rainard & Riollet, Reference Rainard and Riollet2006).
Least square means of percentage and count of lymphocytes, PMN and macrophages using flow cytometry (FC) method in ewe milk samples with Low (LSCC) and High (HSCC) level of SCC. Values are means±sem, n=80

† NS, not significant; ** P<0·01;*** P<0·001
a, b Indicative level of significance within a row
PMN number was lower in LSCC than in HSCC (248·83±46·87×103 cells/ml v. 444·38±58·62×103cells/ml); accordingly PMN percentage was lower in LSCC (40%) than in HSCC (57%). PMNs are the first population recruited from the blood into the mammary gland and play an important role in the immune defence of the mammary gland. In cow milk from healthy uninfected quarters the proportion of PMN is approximately 12% (Kelly et al. Reference Kelly, Tiernan, O'Sullivan and Joyce2000) whereas the percentage increases up to 90% in mastitic milk (Keherly & Shuster, 1994). In ewe milk PMN ranged from 30% to 40% for SCC <100 000 cells/ml (Cuccuru et al. Reference Cuccuru, Moroni, Zecconi, Casu, Caria and Contini1997), and were about 52% for SCC >1 000 000 cells/ml PMN (Albenzio et al. Reference Albenzio, Caroprese, Marino, Santillo, Taibi and Sevi2004). In the current study PMNs were positively correlated with SCC (r=0·83; P<0·001) evidencing that PMNs may be considered a good marker to evaluate ewe udder health.
In LSCC ewe milk PMNs were positively correlated with non viable cells (r=0·75; P<0·001) whereas in HSCC no significant correlation was found. The positive correlation suggests that the resident PMNs in LSCC are not recruited in their protective role of the ewe mammary gland. The absence of correlation between PMNs and non viable cells in HSCC supports the hypothesis that the recruitment of defence cells is activated in response to the immune stimuli. Mehrzad et al. (Reference Mehrzad, Duchateau and Burvenich2004) report that the PMN recruited in the udder during the transition from normal- to high-SCC milk are relatively young and show slow apoptosis while the PMN population resident in the udder is old and not very efficient. Resident PMNs in cow milk with low SCC modulate the initial steps of dynamic immune defence of the udder (Mehrzad et al. Reference Mehrzad, Duchateau and Burvenich2004). Further investigations are required to better clarify the role of resident PMN in the ewe udder.
In general, the dynamics of PMN in ewe milk are different from bovine milk in terms of percentage threshold passing from ewe milk with <300 000 cells/ml to ewe milk with >1 000 000 cells/ml.
No differences were found for macrophages which were 36·36±5·51×103cells/ml and 39·32±6·83×103cells/ml in LSCC and HSCC, respectively. The percentage of macrophages was about 7% in LSCC and 5% in HSCC evidencing that macrophages are not the predominant class of leucocytes in ewe milk, and they did not vary in ewe milk samples with low and high SCC. In cow milk macrophages are the predominant cells from a healthy udder (Kelly & Fox, 2006) and normal bovine milk from uninfected quarters with <100 000 cells/ml contains 60–70% macrophages (Kehrly & Shuster, Reference Kehrly and Shuster1994; Kelly, Reference Kelly, Roginski, Fuquay and Fox2003). In ewe milk the percentage of macrophages from noninfected udders was 57·33% (Morgante et al. Reference Morgante, Ranucci, Paeselli, Casoli and Duranti1996) and their distribution seems to be influenced by PMN distribution: the increase of PMNs corresponded to a decrease of macrophages (Cuccuru et al. Reference Cuccuru, Moroni, Zecconi, Casu, Caria and Contini1997). Recent studies conducted on ewe milk report that macrophages percentage was about 4% both in milk with <600 000 cells/ml and >1 000 000 cells/ml, and that during lactation macrophages show an opposite trend with respect to PMNs (Albenzio et al. Reference Albenzio, Caroprese, Marino, Santillo, Taibi and Sevi2004, Reference Albenzio, Santillo, Caroprese, d'Angelo, Marino and Sevi2009). Considering the low concentration of macrophages in LSCC and HSCC ewe milk samples it could be hypothesized that the contribution of the macrophages to the defence of mammary gland might be limited.
Conclusions
FC was successfully applied for differential leucocyte count in ewe milk with low and high SCC. In ewe milk lymphocytes did not vary with increased number of somatic cells and they represented the predominant cell type in LSCC. PMNs represented the main population detected in HSCC and the correlation with SCC evidenced that this leucocyte class could be useful in differentiating ewe milk cell count, being strictly responsible for the SCC increase. Macrophage levels in ewe milk are lower than in cow milk reaching the value of maximum 7% and did not show differences between LSCC and HSCC.