


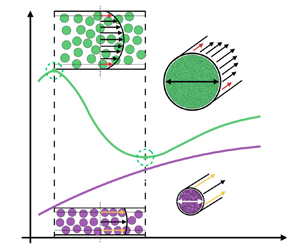



1. Introduction
Fluids confined within geometries of molecular dimensions are commonly encountered in geological and biological systems (Bocquet & Charlaix Reference Bocquet and Charlaix2010), as well as in many engineering applications, e.g. membrane science (Mistry et al. Reference Mistry, Pillai, Mattia and Borg2021), that have been constantly growing in recent years – fostered by the technological progress in the fabrication of nanofluidic devices (Kavokine, Netz & Bocquet Reference Kavokine, Netz and Bocquet2021). In these flows, three significant length scales can be identified: the diameter of fluid constituent particles  $\sigma$, the flow characteristic length
 $d$, which is related to the channel size, and the molecular mean free path (MFP)
 $\lambda$, which represents the average distance travelled by particles between two consecutive collisions. The interplay of phenomena occurring at these scales leads to complex fluid behaviour. Indeed, the continuum approach based on the Navier–Stokes equations breaks down with increasing rarefaction (
 $\lambda \sim d$), since the local thermodynamic equilibrium condition is not fulfilled. Likewise, the standard kinetic theory description is no longer accurate at the nanoscale where dense (
 $\lambda \sim \sigma$) and confinement (
 $d\sim \sigma$) effects come into play, implying that the Boltzmann equation must be replaced by more complicated kinetic models, such as the Enskog equation (Kremer Reference Kremer2010).
Despite the availability of computational procedures to describe the flow of confined fluids, the fundamental understanding of many phenomena occurring under tight confinement is still lacking. A notable example is that, for simple fluids, the Poiseuille mass flow rate (MFR) is found to monotonically increase in channels of molecular dimensions when the fluid density decreases, by using numerical solutions of the Enskog equation (Wu et al. Reference Wu, Liu, Reese and Zhang2016) and event-driven molecular dynamics (EDMD) simulations (Sheng et al. Reference Sheng, Gibelli, Li, Borg and Zhang2020). This behaviour is in sharp contrast with the long-standing recognition of flow mechanics in microchannels, which instead exhibits a non-monotonic variation of the MFR and the formation of a stationary point referred to as the ‘Knudsen minimum’ (Pollard & Present Reference Pollard and Present1948; Cercignani & Sernagiotto Reference Cercignani and Sernagiotto1966; Tatsios, Stefanov & Valougeorgis Reference Tatsios, Stefanov and Valougeorgis2015), as long as the channel is sufficiently long and does not contain any bends (Ho et al. Reference Ho, Li, Su, Wu, Borg, Li and Zhang2020).
A possible explanation of the Knudsen minimum disappearance is that the transport in dense fluids changes from convection to molecular diffusion under tight confinements. Here, molecular diffusion is referred to as the diffusive mechanism which is driven by the interactions between fluid particles in the continuum limit ( $\lambda \ll d$), and it is distinguished from the Knudsen diffusion that takes place in the free molecular limit (
 $\lambda \gg d$), where particles only collide ballistically with the wall (Xiao & Wei Reference Xiao and Wei1992). The dominance of diffusive transport at the nanoscale is known to take place for long alkanes in porous media, where the hydrodynamic description breaks down, although doubt remains for single-site gas molecules (Falk et al. Reference Falk, Coasne, Pellenq, Ulm and Bocquet2015). Despite the fact that there is no unequivocal evidence that this behaviour also occurs for non-tortuous channels, some hints supporting the diffusive nature of Poiseuille flow transport in tight geometries are provided by the analysis of velocity profiles. These are no longer parabolic as expected for force/pressure-driven flows, but show a plug-like behaviour instead, suggesting the predominance of diffusive mechanisms (Firouzi & Wilcox Reference Firouzi and Wilcox2013). However, a conclusive proof regarding a crossover from convection to molecular diffusion in these systems, that is triggered by the fluid confinement, has still not been given.
The aim of this work is to perform a detailed investigation of the Knudsen minimum disappearance in straight nanochannels, and elucidate the underpinning physical reasons. There are two main findings. First, despite the molecular-like confinements, we show that diffusion does not dominate transport, and so the convective flow contribution cannot be neglected outside the free molecular regime. Second, we show that the monotonic increase of MFR can be attributed to the larger relative importance of the velocity slip at the wall, compared with the other physical mechanisms that are normal contenders at the microscale. The rest of the paper is organised as follows. In § 2 we outline the simulation approach used to numerically study the transport process. In § 3.1 we show that the Knudsen minimum vanishing in straight nanochannels cannot be attributed to diffusive processes, whereas in § 3.2 we prove that the contribution of the fluid slippage at the confining solid surface provides a satisfactory explanation of this recently discovered feature. A summary of the main results and conclusions follow in § 4.
2. Methodology
We consider force-driven Poiseuille flows inside a long tubular geometry with nominal diameter  $d$, where the fluid is modelled using a system composed of hard-sphere particles with molecular diameter
 $\sigma$. The wall is assumed to be a structureless cylindrical surface and the fluid–wall interactions are described by the Maxwell scattering kernel with full tangential momentum accommodation coefficient, where impinging particles are diffusely reflected after being thermalised with the wall. The exact time evolution of the monatomic hard-sphere system is simulated using EDMD. In these simulations, the state of the system jumps from one time to another, corresponding to the upcoming collision, through three basic steps: (a) evaluating the time of the earliest collision event, (b) moving ballistically all particles for that time interval, and (c) updating the velocity of the particles that have collided with another particle or the wall, according to elastic hard-sphere dynamics or the Maxwell scattering kernel, respectively. Note that the time step is not constant throughout the simulation run, like in regular molecular dynamics simulations, as it depends on the spatial coordinates and velocities of all molecules in the system. More information on the simulation set-up can be found in Corral-Casas et al. (Reference Corral-Casas, Gibelli, Borg, Li, Al-Afnan and Zhang2021).
Three dimensionless groups can be identified to systematically describe the different transport processes that may take place in this system, namely the reduced density, the confinement ratio and the Knudsen number. The reduced density  $\eta =n{\rm \pi} \sigma ^{3}/6$, where
 $n$ is the number density, represents the number of fluid particles in the theoretical volume occupied by one hard sphere. This first dimensionless group defines the degree of fluid rarefaction, allowing us to differentiate between dense (large
 $\eta$ values) and rarefied (low
 $\eta$ values) gas flows. The confinement ratio
 $R=d/\sigma$ provides information about the degree of fluid inhomogeneity that arises because of the presence of walls, where tight confinements (low
 $R$ values) are associated with a more prominent molecular layering next to the confining surface and, therefore, with an increase of the collision frequency of fluid particles with the wall. Finally, the Knudsen number
 $Kn=\lambda /d$ quantifies the departure of the fluid from its local quasi-equilibrium case. The continuum approach can be used for
 $Kn\lesssim 0.01$, while non-equilibrium effects come progressively into play in the following three regimes: slip (
 $0.01< Kn\lesssim 0.1$, where the continuum model still holds but different boundary conditions are needed to capture the ‘slippage’ of fluid particles at the solid surface), transition (
 $0.1< Kn\lesssim 10$, where the continuum description breaks down and kinetic equations must be used instead) and free molecular (
 $Kn>10$, where molecules move ballistically between collisions with the confining wall). The expression of the MFP, derived from kinetic theory, is given by Kremer (Reference Kremer2010),
 \begin{equation} \lambda=\frac{16}{5{\rm \pi}}\frac{\mu}{P}\sqrt{\frac{{\rm \pi} kT}{2m}}, \end{equation}
where  $m$ is the molecular mass and
 $P$ is the pressure, related to the density through
 $P=nkTZ$, in which
 $k$ is the Boltzmann constant,
 $T$ the temperature of the system and
 $Z$ is the fluid compressiblity factor, that can be accurately approximated by the equation of state for the hard-sphere fluid proposed in Carnahan & Starling (Reference Carnahan and Starling1969),
 \begin{equation} Z=\frac{P}{nkT}=\frac{1+\eta+\eta^{2}-\eta^{3}}{\left(1-\eta\right)^{3}}. \end{equation}
According to the Enskog theory, the shear viscosity  $\mu$ of a hard-sphere fluid is given by
 \begin{equation} \mu=\frac{5}{16\sigma^{2}}\sqrt{\frac{mkT}{\rm \pi}}{\mu_f}= \frac{5}{16\sigma^{2}}\sqrt{\frac{mkT}{\rm \pi}}\frac{1}{\chi}\left[1+\frac{16}{5}\eta\chi+\frac{64}{25}\left(1+\frac{12}{\rm \pi}\right)\eta^{2}\chi^{2}\right], \end{equation}
where  $\mu _f$ is the dense gas correction for the viscosity of a rarefied gas and
 $\chi$ represents the contact value of the pair correlation function in a hard-sphere fluid in uniform equilibrium, which from the aforementioned equation of state reads as
 \begin{equation} \chi=\frac{1}{nb}\left(\frac{P}{nkT}-1\right)=\frac{1}{2}\frac{2-\eta}{\left(1-\eta\right)^{3}}, \end{equation}
where  $b=2{\rm \pi} \sigma ^{3}/3$ is the second virial coefficient (Kremer Reference Kremer2010). It is worth stressing that only two out of the three dimensionless groups are independent, as they are interrelated through
 \begin{equation} Kn = \frac{\lambda}{d}=\frac{\mu_f}{6\sqrt{2}\eta Z R}. \end{equation}
3. Results and discussion
3.1. Knudsen minimum disappearance: analysis based on diffusion
The Knudsen minimum disappearance, which was initially presented for the slit geometry in Wu et al. (Reference Wu, Liu, Reese and Zhang2016), is demonstrated for a cylindrical pipe in this work, where it is seen to occur between  $R=20$ and
 $R=8$ in figure 1(a). Here, we show transport results from non-equilibrium EDMD simulations that are performed in the presence of an external unidirectional force
 $F$ along the axis of the channel, whose value is assumed to be sufficiently low so that the flow remains in the linear response regime – the artificial addition of heat is adequately dissipated by the wall. The numerical evaluation of the MFR for each case, depending on
 $\eta$ and
 $R$, is obtained from a spatial integration of local densities and velocities.
(a) Comparison between the dimensionless MFR provided by non-equilibrium simulations (symbols) and the theoretical predictions assuming Fickian diffusion, as given by (3.1) (lines). There is good agreement in the free molecular regime ( $Kn\geqslant 10$), whilst Fick's law underestimates MFR elsewhere, which implies that convective transport terms cannot be neglected at any confinement. The normalising factor of the MFR
 $\dot {m}_n$ is presented in (A6) of Appendix A. (b) Dependence of the self-diffusivity
 $D$ on the Knudsen number
 $Kn$ and the confinement ratio
 $R$. Horizontal lines represent the theoretical value of the Knudsen self-diffusivity from (3.2) for each confinement ratio.

As mentioned in § 1, the Knudsen minimum vanishing might be explained by supposing that, under molecular confinements, a crossover from convective to diffusive transport takes place up to the late transition regime ( $Kn\lesssim 10$). This hypothesis is tested by comparing the actual MFR with the analytical estimate assuming that the transport is solely driven by diffusion, which is based on the Fick's first law where the MFR of diffusing particles
 $\dot {m}_d$ follows a linear response with the density gradient along the axial
 $z$ direction
 ${\rm d}n/{\rm d}z$,
 \begin{equation} \dot{m}_d={-}\frac{{\rm \pi} d^{2}}{4}mD\frac{{\rm d}n}{{\rm d}z}={-}\frac{D{\rm \pi} d^{2}m}{4kT\left(Z+\eta\dfrac{{\rm d}Z}{{\rm d}\eta}\right)}\frac{{\rm d}P}{{\rm d}z}, \end{equation}
in which  $D$ is the self-diffusion coefficient. Note that the number density
 $n$ and pressure
 $P$ are interconnected using (2.2), with the pressure gradient being identified with the force
 $F$ through the fundamental relation given by
 $-{\rm d}P/{\rm d}z=nF$.
However, before comparing the MFR simulation results with the predictions given by (3.1), self-diffusion results  $D$ are needed as this information is unavailable in the literature for the cylindrical geometry. Therefore, a set of equilibrium EDMD simulations is carried out, see details in Corral-Casas et al. (Reference Corral-Casas, Gibelli, Borg, Li, Al-Afnan and Zhang2021), where the self-diffusion coefficients are determined by means of the Einstein relation in the entire range of flow regimes, for different confinement ratios of interest. These simulation results are shown in figure 1(b), where it can be seen that, from a qualitative standpoint, self-diffusivities increase with Knudsen number because the MFP becomes larger and, therefore, particles have more mobility before colliding with another entity in the system. At the same time, self-diffusivities increase with the flow characteristic length for a given
 $Kn$, as large
 $R$ values imply less collisions with the diffuse wall model that hinder the molecular displacement in the streamwise direction. Note that in the free molecular limit, where there are just diffuse collisions with the wall, numerical results perfectly agree with the analytical Knudsen self-diffusivity prediction from kinetic theory (Kremer Reference Kremer2010),
 \begin{equation} D_{k}=\frac{2d-\sigma}{3}\sqrt{\frac{2kT}{{\rm \pi} m}}, \end{equation}
where it has been accounted for the fact that the effective transversal space accessible to the centre of molecules is  $d-\sigma$.
As presented in figure 1(a), it is found that the Fick's first law unsurprisingly reproduces the MFR simulation results very well in the free molecular regime. The slight disagreement in the tightest of confinements (for  $R=3$) can be attributed to the transition from Fickian to anomalous diffusion (e.g. of single-file type), as particles cannot overtake each other when moving along the channel. However, it is evident that (3.1) underestimates the mass transport along the remaining flow regimes (
 $Kn\lesssim 10$) and, therefore, the governing mechanism in this range of
 $Kn$ is no longer purely diffusive. This clearly proves that, in straight channels, the supposed crossover from convection to diffusion does not occur even under tight confinements and, consequently, cannot explain the Knudsen minimum disappearance. Note that these results do not imply that diffusion is not the governing transport mechanism within more complex geometries, such as in microporous media, which will need to be addressed separately.
3.2. Knudsen minimum disappearance: analysis based on slip
As discussed so far, there are a number of mechanisms that influence the MFR through a channel, and so the best explanation for describing the features of the MFR dynamics can be inferred in the limits of the continuum ( $Kn\rightarrow0$) and free molecular (
 $Kn\rightarrow\infty$) regimes, as we illustrate in figure 2(a). As suggested by the analysis from § 3.1, the fluid flow is convective in nature in the continuum regime, regardless of
 $R$. When moving towards the free molecular regime (i.e. decreasing density values), the MFR initially increases as the viscosity decreases, implying that the fluid velocity arising as a response to a given external driving force will be larger. By contrast, the fluid flow is driven by Knudsen diffusion in the free molecular regime. This means that, when moving back towards the continuum regime (i.e. increasing density values), the MFR decreases as the molecular MFP shortens, implying lower self-diffusivities as observed in figure 1(b).
(a) Qualitative analysis of the dimensionless MFR curves against the Knudsen number. In sufficiently large channels (orange colour), where the continuum transport is larger than the free molecular one, the MFR curve develops two stationary points. In tighter confinements (blue colour), where the free molecular flow is larger than the continuum one, the MFR curve could either show the two stationary points or follow a monotonic increase instead, where the Knudsen minimum disappears. (b) Relative percentage error of the MFR predicted by the Navier–Stokes equation with slip, for different confinement ratios. Dashed horizontal lines are the average percentage error over the displayed range of  $Kn$: the mean error is within 8 % for the tighter
 $R=5$, whereas it reduces to less than 4 % for the largest
 $R=50$ considered here. The inset shows the slip coefficients determined from EDMD simulations, for different
 $R$ and
 $\eta$ values, obtained by fitting the quadratic velocity profiles.

Under a sufficiently loose confinement ( $R\gtrsim 60$ as shown in Appendix A), the Knudsen minimum existence follows from these two limiting behaviours. The MFR in the continuum regime is always larger than that in the free molecular regime and, therefore, the MFR curve must show two stationary points as depicted by the orange curve in figure 2(a), namely the Knudsen maximum and the Knudsen minimum. If the confinement is tighter, the continuum MFR is lower than the free molecular one. Accordingly, the flow transport curve may either form two stationary points, given by the blue dotted line, or else could show a monotonic increase throughout the entire range of Knudsen numbers, as represented by the blue solid line. It is then clear that, for the confined case, a necessary and sufficient condition for the Knudsen minimum to appear is that the Knudsen maximum shows up as well. Indeed, the first derivative of the MFR is positive in the continuum regime but, by definition, it is negative in the left neighbourhood of the local minimum. Therefore, before this local minimum, there must necessarily be a point at which the first derivative changes from positive to negative, which corresponds to a local maximum. Consequently, proving the disappearance of the Knudsen minimum is equivalent to demonstrating the Knudsen maximum vanishing. The latter question is easier to address as this local maximum falls in the continuum/slip regime (
 $Kn\lesssim 0.1$), where it can be tackled analytically using the Navier–Stokes equations with the first-order velocity slip boundary condition, which in its dimensionless form (a step-by-step derivation of this mathematical expression is presented in Appendix A) reads as
 \begin{equation} \dot{m}=\frac{\dot{m}_h}{\dot{m}_n}=\frac{3R\eta}{5\sqrt{\rm \pi}\mu_f}\left(1+8\alpha Kn\right). \end{equation}
Note that the velocity slip boundary condition at the wall used to derive (3.3) is based on the strain rate and not on the stress tensor, leading to less accurate results if the wall is not at rest (Lockerby et al. Reference Lockerby, Reese, Emerson and Barber2004). The validity of (3.3) in the considered range of  $Kn$ is tested in figure 2(b), where we show the relative error with respect to the EDMD results presented in figure 1(a). It is clear that, despite the tight confinements, the evaluation of the Navier–Stokes equations with the numerical slip coefficients
 $\alpha$ presented in the inset of figure 2(b) predicts the MFR very accurately. In the following analysis, the slip coefficient
 $\alpha$ is assumed to be constant and equal to that of a rarefied gas, albeit the slip phenomenon is known to be more complicated when dealing with liquid-like densities, and the standard kinetic theory treatment is no longer applicable (Martini et al. Reference Martini, Roxin, Snurr, Wang and Lichter2008; Hadjiconstantinou Reference Hadjiconstantinou2021; Shan et al. Reference Shan, Wang, Wang, Zhang and Guo2022). This fact is also reflected in the inset of figure 2(b), where the non-trivial dependence of
 $\alpha$ on both the confinement ratio
 $R$ and the reduced density
 $\eta$ can be observed. The validity of this assumption will be discussed later.
Equation (3.3) clearly shows that, at constant  $R$, there are three physical terms contributing to the MFR, namely the viscosity (i.e. via
 $\mu _f$), the density (i.e. via
 $\eta$) and the slip (i.e. via
 $1+8\alpha Kn$). These terms vary with the reduced density but, for the following analysis, we find it more convenient to study the MFR with respect to the reduced specific volume
 $\nu =1/\eta$, as in this way there is a one-to-one direct correspondence between
 $\nu$ and
 $Kn$. It should be stressed that this choice does not limit the generality of the conclusions. The relative importance of these terms can be singled out by evaluating their corresponding partial rates of change,
 \begin{equation} \frac{{\rm d}\dot{m}}{{\rm d}\nu}= \frac{{\rm d}\eta}{{\rm d}\nu}\left(\frac{\partial\dot{m}}{\partial\mu_f}\frac{{\rm d}\mu_f}{{\rm d}\eta}+ \frac{\partial\dot{m}}{\partial\eta}+ \frac{\partial\dot{m}}{\partial Kn}\frac{{\rm d}Kn}{{\rm d}\eta}\right)= \frac{1}{\nu^{2}}\left(Q_{\mu}+Q_{\eta}+Q_{\alpha}\right), \end{equation}
where
 $$\begin{gather} Q_{\mu}=\frac{3R\eta\left(1+8\alpha Kn\right)}{5\sqrt{\rm \pi}\mu_f^{2}}\frac{{\rm d}\mu_f}{{\rm d}\eta}, \end{gather}$$
 $$\begin{gather}Q_{\eta}={-}\frac{3R\left(1+8\alpha Kn\right)}{5\sqrt{\rm \pi}\mu_f}, \end{gather}$$
 $$\begin{gather}Q_{\alpha}=\frac{24R\eta\alpha}{5\sqrt{\rm \pi}\mu_f}\frac{{\rm d}Kn}{{\rm d}\eta}. \end{gather}$$
These individual contributions are presented in figure 3(a) for  $R=20$, in a range of
 $\nu$ values corresponding to
 $Kn\lesssim 0.1$, namely the slip regime. Here, the plot of (3.5) shows that the partial derivative of the MFR with respect to the viscosity,
 $Q_{\mu }$, is always positive with increasing reduced specific volume. In particular, the rate of change is higher for low
 $\nu$ values, whereas its value decreases for large reduced specific volumes. Equation (3.6) shows that the MFR partial derivative with respect to the density,
 $Q_{\eta }$, is always negative with increasing reduced specific volume. If the slip contribution is temporarily disregarded, the density is seen to become relevant over the viscosity at
 $\nu \approx 6$, and drives the MFR to decrease monotonically with a further increase in the reduced specific volume. Equation (3.7) shows that the MFR partial derivative with respect to the slip,
 $Q_{\alpha }$, is always positive with increasing specific volume. In particular, the rate of change is almost negligible in the continuum regime while it becomes larger in the slip regime (
 $\nu \gtrsim 3.33$), where rarefaction effects become more prominent and the fluid slippage at the wall increasingly contributes to the overall MFR.
(a) Partial rates of change against the reduced specific volume, for  $R=20$, under the continuum framework of fluid modelling, which capture how flow transport is affected by a change of each of the underlying contributions. (b) Interplay between the continuum (dash-dotted) and the slip (dotted) contributions for different
 $R$. For sufficiently large
 $R$ values, the continuum contribution dominates and the sum of all rates of change (solid) crosses the
 $x$-axis, i.e. the Knudsen maximum appears. However, for tight channels, the continuum contribution is less relevant whereas slip remains the same, driving the overall rate of change to be positive throughout the entire range of
 $\nu$ values, with the Knudsen maximum disappearing as a consequence.

Three important observations are in order and presented in figure 3(b), that helped us to understand why the Knudsen minimum disappears only when confinements are tight. The first remark is that the viscosity and density contributions exactly counterbalance at the same  $\nu$ regardless of
 $R$. This can be easily proved using (3.5) and (3.6), and it is clearly shown by dashed lines, representing the sum of viscosity and density rates of change (dubbed the continuum contribution from here onwards), which always cross the
 $x$-axis at
 $\nu \approx 5.711$. A second remark is that the magnitude of the rate of change of the continuum contribution reduces with tighter channels, and so its absolute value decreases with lower
 $R$ for a given
 $\nu$ value, as could also be deduced from (3.5) and (3.6). The third remark is that the slip contribution (dotted line) is independent of
 $R$, as it is seen in (3.7), and so its relative importance grows when the confinement ratio reduces.
The interplay between the three aforementioned contributions (denoted by solid lines in figure 3(b), representing the sum of continuum and slip terms) significantly depends on the size of the channel, and we can mainly distinguish between two types of flow behaviours. For sufficiently large channel sizes and starting from the continuum regime (low  $\nu$), the viscosity contribution initially dominates and leads the MFR to increase with
 $\nu$. The region corresponding to low
 $\nu$ values can then be referred to as viscosity dominated since this contribution overcomes that of density, and here the slip term is negligible. Unlike the viscosity term that gets weaker as the fluid rarefaction increases, the density term becomes progressively more important and causes the Knudsen maximum to form by eventually driving the MFR to decrease.
For tight confinements, viscosity is initially dominant and drives the MFR increase as in the previous case. However, now there is an interplay between density and slip in the region where the transport was previously density dominated, as the relative contribution of slip becomes more and more important for decreasing  $R$ values. Indeed, as emphasised by the magnitude of the continuum and slip contributions in figure 3(b), there might be a threshold confinement ratio
 $R$ at which the latter overcomes the former, preventing the formation of the expected Knudsen maximum. Therefore, the velocity slip at the boundary impels the MFR curve to monotonically increase throughout the entire range of flow regimes, with the Knudsen maximum (and so, the Knudsen minimum) disappearing as a consequence.
It is worth noticing that, within the simplified solution represented by (3.4), the Knudsen minimum disappearance can be determined by a simple argument. As the rate of change of the MFR is a continuous function that takes positive values in the continuum limit, a sufficient condition for the MFR to cross the  $x$-axis could be defined by the Bolzano theorem,
 \begin{equation} \lim_{\nu\to\infty}\left(Q_{\mu}+Q_{\eta}+Q_{\alpha}\right)=\frac{8\sqrt{2}\alpha-3R}{5\sqrt{\rm \pi}}\leqslant 0, \end{equation}
from where the threshold value of the confinement ratio for the Knudsen minimum disappearance is  $R_t<8\sqrt {2}\alpha /3\approx 4.3$. The numerical results presented in figure 1(a) show that the MFR monotonically increases with rarefaction up to about
 $R\approx 8$, and so the theoretical estimate from (3.8) only provides a sufficient condition, but not necessary, for the Knudsen minimum disappearance.
The analysis carried out in this section is based on two main simplifying considerations. The first assumption consists on using nominal values for density and viscosity in the Navier–Stokes equations to predict the MFR values, despite the fact that it is well known that, under tight confinement, density is non-uniform across the channel and viscosity is no longer a local property of the position along the channel (Travis, Todd & Evans Reference Travis, Todd and Evans1997). However, there is a large body of evidence demonstrating that the hydrodynamic framework is valid down to nanoscale confinements (Bocquet & Charlaix Reference Bocquet and Charlaix2010), and indeed our numerical simulations in tight geometries also showed an agreement with the theoretical prediction provided by the Hagen–Poiseuille solution with slip, (3.3), using nominal values of the fluid properties – as it is presented in figure 2(b). The second assumption involves the use of a constant slip coefficient although, unlike the rarefied case, numerical evidence shows that it depends on the channel size and on the fluid density – see the inset within figure 2(b). However, the validity of the presented analysis can be straightforwardly extended when a more accurate expression of the slip coefficient is used. As an example, a universal scaling law is derived for the slip coefficient in a planar geometry by Shan et al. (Reference Shan, Wang, Wang, Zhang and Guo2022), where it is shown that  $\alpha$ varies significantly with
 $\eta$, while the dependence on
 $R$ can be neglected. Accordingly, the slip contribution is still independent of
 $R$ and the continuum contributions remain linear functions of
 $R$, counterbalancing each other at a specific
 $\eta$ value regardless of the confinement ratio. Therefore, although the curves corresponding to these contributions are different from those depicted in figure 3(b), there still must exist a threshold confinement ratio for which the Knudsen minimum disappears as, when
 $R$ is small enough, the decay of the MFR due to the density decreasing is overcome by the enhancing contribution of the slip.
4. Conclusions
We have studied the Knudsen minimum disappearance that occurs for Poiseuille flows in tight cylindrical geometries. High-fidelity EDMD simulations have been carried out in a wide range of reduced fluid densities  $\eta$ and channel confinement ratios
 $R$, in both equilibrium (to obtain the self-diffusivities needed in the Fickian framework) and non-equilibrium (directly evaluating the MFR) set-ups. Although diffusion is supposed to be the main transport mechanism at the nanoscale, we found that the convective contribution to the MFR cannot be disregarded – even under confinements of molecular dimensions. This convection-dominated transport, which is analytically studied using the Hagen–Poiseuille solution with first-order slip, is decoupled into its three fundamental contributions, namely viscosity, density and slip. The individual influence of each of them on transport is assessed for different fluid rarefaction states and confinement ratios, which revealed that the disappearance of the Knudsen minimum is a consequence of the interplay between these contributions. More specifically, the combined contribution of viscosity and density weakens in tight geometries, whereas the slip term remains the same when
 $R$ decreases, and so its relative importance increases in this context. Therefore, the Knudsen minimum vanishing under tight confinement can be explained by the more accentuated importance of the fluid slippage at the wall. The relevance of this work underpins in its qualitative explanation of dense flow mechanisms at the molecular scale, which may help to better understand how slip, from a fundamental standpoint, affects the flow of dense gases/liquids confined within tight geometries, such as the high-pressure methane transport in unconventional shale rocks (Zhang et al. Reference Zhang, Shan, Yulong and Guo2019) or water transport in nano-structured filtration membranes (Falk et al. Reference Falk, Sedlmeier, Joly, Netz and Bocquet2010).
Funding
This research was funded in whole, or in part, by the King Fahd University of Petroleum and Minerals (KFUPM), Saudi Arabia. M.K.B. and L.G. are funded by the Engineering and Physical Sciences Research Council (EPSRC) under grant numbers EP/V012002/1, EP/R007438/1. For the purpose of open access, the author has applied a CC BY public copyright licence to any Author Accepted Manuscript version arising from this submission.
Declaration of interests
The authors report no conflict of interest.
Data availability statement
The data that supports the findings of this study are openly available in Edinburgh DataShare repository at https://doi.org/10.7488/ds/3480.
Appendix A
The Navier–Stokes equations for the incompressible flow of a Newtonian fluid through an infinite cylindrical channel simplify to
 \begin{equation} \frac{1}{r}\frac{{\rm d}}{{\rm d}r}\left(r\frac{{\rm d}u_z}{{\rm d}r}\right)=\frac{1}{\mu}\frac{{\rm d}P}{{\rm d}z}, \end{equation}
where  $u_z$ is the fluid macroscopic velocity in the streamwise direction and
 $r$ is the radial direction. The first-order slip at the wall,
 $r=d/2$, can be written as
 \begin{equation} u_s={-}\alpha\lambda\left.\frac{{\rm d}u_z}{{\rm d}r}\right|_{r=d/2}, \end{equation}
where  $u_s$ is the slip velocity and
 $\alpha =2/\sqrt {{\rm \pi} }$ is the velocity slip coefficient (Gibelli Reference Gibelli2012). The straightforward solution of the boundary value problem from (A1), (A2) reads as
 \begin{equation} u_z(r)=\frac{1}{4\mu}\frac{{\rm d}P}{{\rm d}z}\left(r^{2}-d\alpha\lambda-\frac{d^{2}}{4}\right). \end{equation}
The spatial integration of the velocity field over the circular cross-section yields the Hagen–Poiseuille solution for the MFR
 \begin{equation} \dot{m}_h=mn\int_{0}^{d/2}u_z(r)2{\rm \pi} r\,{\rm d}r ={-}\frac{mn{\rm \pi} d^{4}}{128\mu}\frac{{\rm d}P}{{\rm d}z}\left(1+8\alpha Kn\right). \end{equation}
The dimensionless MFR in the continuum limit,  $Kn\rightarrow0$, can be obtained from (A4) by setting
 $\alpha =0$ (i.e. the non-slip solution) and
 $\eta _0=0.494$, which corresponds to the freezing density of a hard sphere fluid (Sigurgeirsson & Heyes Reference Sigurgeirsson and Heyes2003),
 \begin{equation} \frac{\dot{m}_h}{\dot{m}_n}=\frac{3R\eta_0}{5\sqrt{\rm \pi}\mu_f(\eta_0)}, \end{equation}
where  $\dot {m}_n$ is a normalising factor defined as
 \begin{equation} \dot{m}_n={-}mn_0\frac{{\rm \pi} d^{2}}{4}\frac{1}{m}\frac{1}{n_0}\frac{{\rm d}P}{{\rm d}z}\frac{d}{\sqrt{kT/m}}={-}\frac{{\rm \pi} d^{3}}{4\sqrt{kT/m}}\frac{{\rm d}P}{{\rm d}z}. \end{equation}
On the other hand, the dimensionless MFR in the free molecular limit,  $Kn\rightarrow\infty$, is provided by (3.1), with the Knudsen self-diffusivity from (3.2) as the proportionality factor and
 $Z=1$,
 \begin{equation} \frac{\dot{m}_d}{\dot{m}_n}=\frac{D_k}{d}\sqrt{\frac{m}{kT}}=\frac{2}{3}\sqrt{\frac{2}{\rm \pi}} \left(1-\frac{1}{R} \right). \end{equation}
As discussed at the beginning of § 3.2, independently on the confinement ratio  $R$, the MFR increases/decreases with the increasing/decreasing of the Knudsen number in the continuum/free molecular regimes. Therefore, a sufficient condition for the Knudsen minimum to show up easily follows from the condition that the MFR in the continuum regime is larger than that in the free molecular regime, from where it turns out that the only acceptable solution is
 $R\gtrsim 60$.


 Open access

