Recent research has shown that institutional settings lead to different developmental and distributional outcomes. One strand of this literature suggests public policies favoring landownership concentration can reduce public investment in primary schools (Engerman and Sokoloff Reference Engerman and Sokoloff2000). Galor, Moav, and Vollrath (Reference Galor, Moav and Vollrath2009) predicted that land concentration had an adverse effect on public education spending and used early-twentieth-century U.S. state-level data to support their prediction. While most of these papers study the provision of education, in this paper, I focus on the impact of landownership institutions on the funding of hospitals and dispensaries. These facilities have been essential in improving quality of life and today absorb more than half of public health spending in most countries (World Health Organization 2010, p. 67).
This paper explores whether land tenure systems affected the revenue available to hospitals and dispensaries in colonial India—see Figure 1. Early in its conquest, the East India Company (EIC) introduced a landlord system, granting landownership to a few precolonial tax collectors (zamindars). As more regions came under British rule, the EIC increasingly granted landownership directly to cultivators (non-landlord systems), which led to a more equitable land distribution (Banerjee and Iyer Reference Banerjee and Iyer2005) and higher wages (Caum-Julio Reference Caum-Julio2024) in the non-landlord regions.
PROVINCIAL MAP OF COLONIAL INDIA IN 1901
Sources: Author’s illustration.

I explore the effect of land tenure systems on two types of spending for hospitals and dispensaries. One is public funds from district and local boards. These boards were the main revenue source for most healthcare facilities. In districts with landlord tenure systems, less land tax was collected—land tax being the main revenue source for these boards (Chaudhary Reference Chaudhary2010; Lee Reference Lee2018). Thus, healthcare facilities in landlord districts may have received less funding from district and local boards than those in non-landlord districts. The other revenue sources I focus on are Indian private subscriptions and donationsFootnote 1—the main private revenue sources for hospitals and dispensaries. Unlike public board funds, private subscriptions and donations did not depend on the tax revenue. Here, I analyze to what extent they differed between landlord and non-landlord districts and explore the possible reasons for these differences.
To carry out my analysis, I construct a new georeferenced cross-sectional dataset of hospitals and dispensaries, including hospital-level data on their 1901 revenue and expenditure sources. To deal with potential endogeneity issues, I follow Banerjee and Iyer (Reference Banerjee and Iyer2005) and use the districts conquered between 1820 and 1856 as an instrument for land tenure systems. Additionally, I employ a geographic regression discontinuity design that exploits variation in land tenure systems within the Brahmaputra valley, in the province of Assam.
I find that hospitals and dispensaries in non-landlord areas received more funds from district and local boards than in landlord areas. Conversely, healthcare facilities in landlord areas received more Indian private subscriptions and donations. While the first result can be explained by differences in land tax revenue, I suggest that higher private support for healthcare facilities in landlord areas could be associated with landlords using these donations and subscriptions to show allegiance, as many of them were involved in the 1857 revolt against the EIC. My OLS and IV results indicate that facilities in non-landlord areas were better funded than those in landlord areas. The RD results confirm the OLS and IV results on funding from district boards and private subscriptions and donations, but I find no statistically significant results for total spending. This could be because the Assamese provincial government spent more on healthcare facilities in landlord districts, offsetting the lower funds these facilities received from district and local boards.
My paper contributes to several strands of literature. First, I contribute to research on landed elites and the funding of public goods. Much has been written on the impact of landed elites on public education provision (Andersson and Berger Reference Andersson and Berger2019; Chaudhary et al. Reference Chaudhary, Musacchio, Nafziger and Yan2012; Galor, Moav, and Vollrath Reference Galor, Moav and Vollrath2009; Cvrcek and Zajicek Reference Cvrcek and Zajicek2019; Goñi Reference Goñi2023). For example, Goñi (Reference Goñi2023) finds that land concentration reduced local boards’ funding of elementary schools in nineteenth-century England, while Andersson and Berger (Reference Andersson and Berger2019) find that landed elites promoted local government spending on primary schools in Sweden. I show that institutions shaping landownership can also affect the funding of healthcare facilities, a relatively understudied public good in this literature.
Second, my paper provides valuable insights into research on the determinants of public goods provision in colonial India. Caste fragmentation in a district reduced spending on primary education (Chaudhary Reference Chaudhary2009, Reference Chaudhary2010). In the case of healthcare, some historians have studied the provision of Western medicine in colonial India (Arnold Reference Arnold1993; Pati and Harrison Reference Pati and Harrison2009). However, my paper is, to the best of my knowledge, the first to quantitatively analyze the determinants of healthcare funding during the Raj.
Third, my dataset is also one of the first, along with some recent contributions (Fenske, Kala, and Wei Reference Fenske, Kala and Wei2023), to provide new data for colonial India below the district level. In particular, it is the first to provide geo-coded data on publicly and privately funded hospitals and dispensaries in colonial India.
Finally, I contribute to the literature explaining current health outcomes through colonial healthcare services. Recent research has found persistent effects of colonial healthcare provision on trust and contemporary health indicators in Africa and India (Lowes and Montero Reference Lowes and Montero2021; Calvi and Mantovanelli Reference Calvi and Mantovanelli2018). In that context, my results show some persistence, as today’s per capita government health expenditure is much lower in Indian states that spent less on healthcare facilities during colonial times.Footnote 2
HISTORICAL CONTEXT
Hospitals and dispensaries were centers of sanitary education, research, and contact with Western medicine in colonial India (Pati and Harrison Reference Pati and Harrison2009, p. 6). Curing sickness, performing surgical operations, and reporting data on mortality were basic functions of these healthcare facilities. Over time, the number of surgical operations in healthcare facilities rose throughout India as surgery was neglected by Indian practitioners but highly demanded by the population (Arnold Reference Arnold1993, p. 251). The most common surgical operation was the extraction of abscesses, although the removal of teeth and parasites, setting broken bones, and reducing dislocations were also common procedures. Hospitals were also used to research, train medical students, sell medicines, and perform smallpox vaccinations.Footnote 3 Vaccinations were given in dispensaries as well as in public places within the town/city (James Reference James1909, pp. 26, 29–31). By the 1870s, vaccinations in dispensaries were an important part of the vaccination systems in Bengal, Central Provinces, Punjab, and Assam. The relevance of dispensary vaccinations diminished over timeFootnote 4; although by 1901, they were still being done in Assam (representing 9.6 percent of total vaccinations in the province), Bengal (5.8 percent), and Central Provinces (4 percent).
Hospitals and dispensaries began to be established in colonial India during the late seventeenth and early eighteenth centuries, with around ninety facilities founded during EIC rule (Arnold Reference Arnold1993, p. 248). The provision of healthcare facilities was mainly constrained by the EIC’s reluctance—and sometimes inability—to commit significant financial resources to that end. The EIC justified its limited financial commitment by pointing to the prejudice of the Indian population toward hospitals and Western medicine. This prejudice appears to have been greatly exaggerated (Arnold Reference Arnold1993; Ramasubban Reference Ramasubban, Milton and Kerrie2008). Hence, the EIC established very few and underfunded healthcare facilities for Indians, primarily in large cities, military cantonments, and prisons (Arnold Reference Arnold1993, p. 61). Even in these locations, Indians’ healthcare was of comparatively lower quality. In military cantonments, hospitals for Indian troops were significantly less equipped than those for their British counterparts (Commission 1864, pp. 324–32).
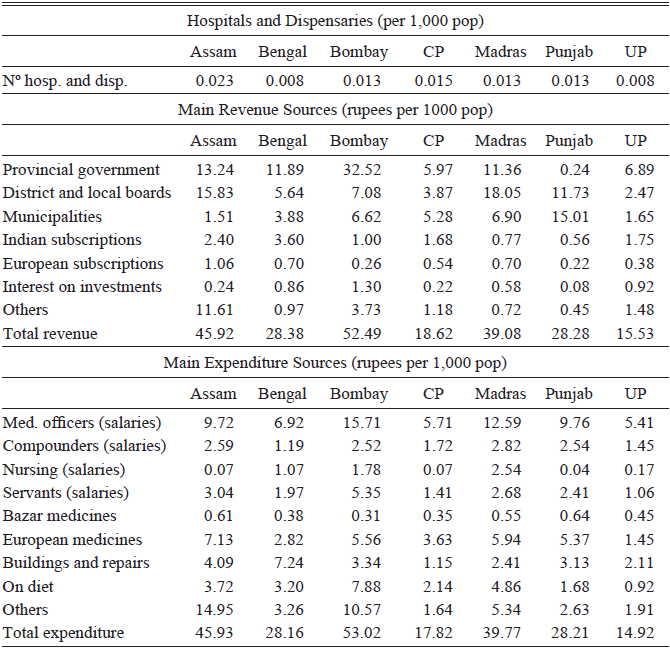
This extremely limited provision of healthcare facilities changed when the Crown gained control of India. By then, British officials recognized the need for a healthy civilian population to avoid disease outbreaks in military cantonments (Commission 1864, p. 338). Under the Crown’s rule, public health became part of the “civilizing mission” of British rule (Arnold Reference Arnold1993, p. 97) and was relevant to the political and economic power of the Empire (Berger Reference Berger2013, pp. 52–55). Berger (Reference Berger2013, p. 52) argues that the Government’s rising concern about public health was the direct consequence of its increasing worries concerning the security of British rule in the subcontinent. Even after this shift in the Government’s assessment of healthcare, its provision remained somewhat limited—see Table 1. However, the Crown’s administration managed to significantly expand the funding and number of healthcare facilities, resulting in over two thousand hospitals and dispensaries operating in colonial India by 1901.Footnote 5
PROVINCIAL SUMMARY FOR 1901 HOSPITALS AND DISPENSARIES

Notes: This table includes healthcare facilities that were not georeferenced. Punjab only includes its eastern districts, for which the non-landlord proportion is available.
Sources: BL & IOR, RHD, 1902, IOR/V/24/676, IOR/V/24/700, IOR/V/24/713, IOR/V/24/725, IOR/V/24/748, IOR/V/24/768, IOR/V/24/788.
District and local boards financed most of this expansion. They were established after Viceroy Lord Ripon’s 1882 resolution, which aimed to decentralize public services—education, local infrastructures, and healthcare (Chand Reference Chand1947; Tinker Reference Tinker1967)—and train the Indian middle class in the administration of representative institutions (Tinker Reference Tinker1967, p. 44). Despite the establishment of district or local boards in all provinces, Indian representation and non-official chairmanship were not as widespread as envisioned. Non-official members—or board members who were not civil servants—were mainly Indian landowners and lawyers. By the 1900s, and especially after 1920, these boards saw greater representation of elected Indians and non-official members. This change extended to chairmanship positions, increasing the influence of Indians within these boards (Tinker Reference Tinker1967, pp. 106–14). The boards were mainly funded through a land tax surcharge and provincial grants. The land tax surcharge was levied at a rate of 6.25 percent of the land revenues (Chaudhary Reference Chaudhary2010, p. 281). In practice, there were substantial differences in available funds across district and local boards, which were exacerbated by the different financial capabilities of provincial governments (Kumar Reference Kumar, Kumar and Desai1989, pp. 908–10).Footnote 6
These differences in the available funds of district and local boards led to a remarkably heterogeneous distribution of hospitals and dispensaries. For example, the province of Assam had three times as many healthcare facilities per person as the United Provinces. Funding available to healthcare facilities was also heterogeneous: in certain provinces, healthcare facilities had more than three times as much revenue per capita as in other provinces. Table 1 provides a provincial-level summary of the number of healthcare facilities (per 1,000 population) as well as of the revenue and expenditure sources of these facilities by 1901.Footnote 7
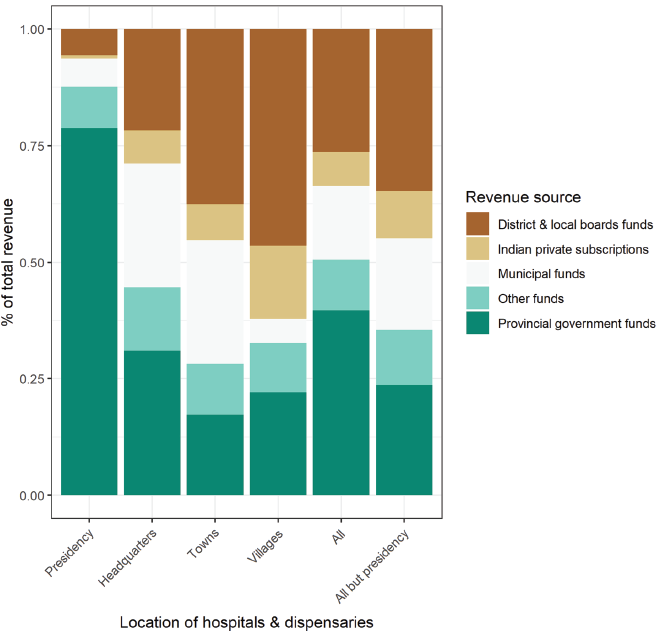
The distribution and funding of hospitals and dispensaries were also heterogeneous between urban and rural areas—see Figure 2. Most hospitals were located within cities and towns, while dispensaries were usually located in villages. Healthcare facilities in the presidency cities of Bombay, Calcutta, and Madras—which were almost entirely established during EIC ruleFootnote 8—were mostly funded by provincial governments. In district headquarters, revenue from municipalities and district boards represented 26.6 percent and 21.7 percent of the total revenue of healthcare facilities, respectively.Footnote 9 In towns other than presidency cities and district headquarters, district and local boards were the main source of revenue for hospitals and dispensaries, representing 37.6 percent of the facilities’ total revenue. In villages, this percentage jumped to 46.5 percent. Indeed, district and local boards were the main revenue source for over 40 percent of hospitals and dispensaries.
REVENUE SHARES BY LOCATION OF HEALTHCARE FACILITY
Notes: District headquarters identified using the Imperial Gazetteer of India (Cotton, Burn, and Meyer Reference Cotton, Burn and Meyer1909).
Sources: Data on settlements classified as towns available at the various volumes of the 1901 Census of India. All settlements not classified as towns by the 1901 Census of India are categorized as villages. Data on the revenue sources from the various BL & IOR, RHD, 1902.

Hospitals and dispensaries were also funded by recurrent private subscriptions and one-time or exceptional donations that Indians made to healthcare facilities. These represented 7.7 percent of the total revenue of healthcare facilities in towns and 15.7 percent in villages.
A possible explanation for the heterogeneous funding of hospitals and dispensaries is land tenure systems. By 1789, the British introduced their first land tenure system in Bengal (Baden-Powell Reference Baden-Powell1892a, pp. 284, 391). This was the zamindari or landlord system, in which zamindars—former Mughal tax collectors—became landlords (Banerjee and Iyer Reference Banerjee and Iyer2005, p. 1193).
By contrast, in most of Madras, Assam, and all of Bombay, the ryotwari or non-landlord system was introduced. Under this system, ownership was granted to cultivators. Finally, Punjab and the United Provinces adopted the mahalwari system, wherein village bodies jointly owned the land.Footnote 10
Districts with non-landlord tenure systems collected more revenue from the land tax, and district and local boards in these districts were able to get more funds from their surcharge on the land tax (Chaudhary Reference Chaudhary2010; Lee Reference Lee2018). Thus, healthcare facilities in non-landlord districts could have received more funds from these boards. In landlord districts, many landlords took up arms against British rule during the 1857 revolt. After the revolt was crushed, these landlords had their lands expropriated and only got them back if they pledged allegiance to the British (Metcalf Reference Metcalf1964; Nevill Reference Nevill1903, Reference Nevill1921).Footnote 11 This made many landlords eager to demonstrate their loyalty to the British. Granting subscriptions and donations to healthcare facilities became a way to show loyalty, solidify landownership rights, and receive honors. As a result, healthcare facilities in landlord districts may have received more funds from Indian private subscriptions and donations.
In sum, despite the expansion of healthcare facilities in the last half of the nineteenth century, there were differences in their funding across the subcontinent.
DATA
I construct a new hospital-level dataset for 1901 to explore the effect of land tenure systems on the revenue available to hospitals and dispensaries. My new dataset uses information from the provincial Reports on Hospitals and Dispensaries (RHD), the various volumes of the 1901 Census of India, the 1909 Imperial Gazetteer of India, the 1903 Agricultural Statistics of India, and secondary sources, such as Banerjee and Iyer (Reference Banerjee and Iyer2005).
Healthcare Facilities
The various provincial RHD report the funds every hospital and dispensary received from different revenue sources.Footnote 12 I collect this data and use these reports to also create dummy variables identifying the type of facility (hospital or dispensary and female or mixed). Bombay and Madras’ provincial RHD explicitly stated whether the facility was a hospital or a dispensary. According to these two reports, one of the main differences between the categories was the presence of indoor beds. Therefore, for provinces in which this classification was not explicit, I define hospitals as all healthcare facilities with indoor beds. However, if “dispensary” or “hospital” were included in the facility’s name, I would classify them accordingly. Provincial RHD also report the name of the district and city, town, or village where the facility is located. I use this, together with Google Maps and India Place Finder, to georeference 1,717 hospitals and dispensaries—representing 85.3 percent of all healthcare facilities reported in the provincial RHD.Footnote 13 I compute the latitude and longitude of these healthcare facilities and use the shapefile from Fenske, Kala, and Wei (Reference Fenske, Kala and Wei2023) to calculate their distance to the nearest railway line. I also create dummy variables to identify facilities located in district headquarters—using the Imperial Gazetteer of India (Cotton, Burn, and Meyer Reference Cotton, Burn and Meyer1909)—and in towns and cities—using the 1901 Census of India. Finally, I control for altitude using SRTM data and for the type of soil on which each facility is located using dummy variables for the four most common soils in the subcontinent following FAO’s soil classification.
Land Tenure Systems
To estimate the presence of different land tenure systems, I use the non-landlord proportion from Banerjee and Iyer (Reference Banerjee and Iyer2005). This is the share of land, estates, or villages under a non-landlord system in each district. For districts not included in Banerjee and Iyer (Reference Banerjee and Iyer2005), I estimate the share of land under non-landlord systems using Agricultural Statistics of India (Government of India, Department of Revenue and Agriculture 1903) whenever possible.Footnote 14 Alternatively, I use the non-landlord proportion estimates of Iversen, Palmer-Jones, and Sen (Reference Iversen, Palmer-Jones and Sen2013) as a robustness check—see Column (2) in Table 7.Footnote 15
District-Level Characteristics
I create a large set of variables to control for district-level characteristics. I collect data on district population to account for the number of people who could potentially benefit from healthcare facilities in each district. I control for the urbanization rate, as richer districts tend to be more urbanized, and that could affect the funds available to healthcare facilities. I also control for caste and religious fragmentation (CRFI) following Banerjee and Somanathan (Reference Banerjee and Somanathan2007) and for the share of elite caste groups (Brahmins) and minorities (Muslims), which could influence public goods provision (Chaudhary Reference Chaudhary2009). Upper-caste elites could have provided more donations to healthcare facilities while local public bodies may have been more willing to invest in healthcare facilities located in districts with a larger presence of Muslims. These data are taken from the various volumes of the 1901 Census of India.
To control for district-level geographic characteristics, I create a dummy for coastal districts and collect average rainfall data from the Imperial Gazetteer of India (Cotton, Burn, and Meyer Reference Cotton, Burn and Meyer1909). Finally, I control for the date of British conquest recorded by Banerjee and Iyer (Reference Banerjee and Iyer2005). Districts conquered earlier may have had more developed trade and credit markets or could have been better districts for cultivation (Banerjee and Iyer Reference Banerjee and Iyer2005, p. 1204). Such features could have affected the public and private funding of healthcare facilities.
EMPIRICAL STRATEGY AND RESULTS
In this section, I first discuss the empirical method. Then I report the OLS correlations between several revenue sources of healthcare facilities and some potential explanatory factors, including land tenure systems. Third, I introduce the instrument for the land tenure systems and present the IV results. Next, I present the analysis based on regression discontinuity. Finally, I discuss the robustness checks.
Baseline Regression: OLS
Equation (1) represents my OLS baseline regression:

where RevExp δ,i,r represents revenue or expenditure δ for healthcare facility i in district r. Revenue or expenditure δ can be any revenue source, total revenue, or total expenditure. Unless otherwise stated, revenues and expenditures have been transformed using the inverse hyperbolic sine (IHS) function. The IHS transformation corrects for right-skewed distributions of variables and residuals, similar to the natural logarithm transformation, but without dropping observations with a value of zero. Most revenue and expenditure sources had right-skewed distributions due to frequent zeros—53 percent of hospitals and dispensaries received no funds from Indian private subscriptions and donations, which clearly skewed their distribution and that of the residuals.Footnote 16
NonLandlordr is the non-landlord proportion for district r, Xi,r is a vector including the controls for hospital characteristics described in the previous section, and Γr is another vector including the controls for district-level characteristics also described in the previous section. Last but not least, all standard errors are clustered at the district level (r) unless otherwise stated. This is because the non-landlord proportion and all variables in Γr change at the district level.
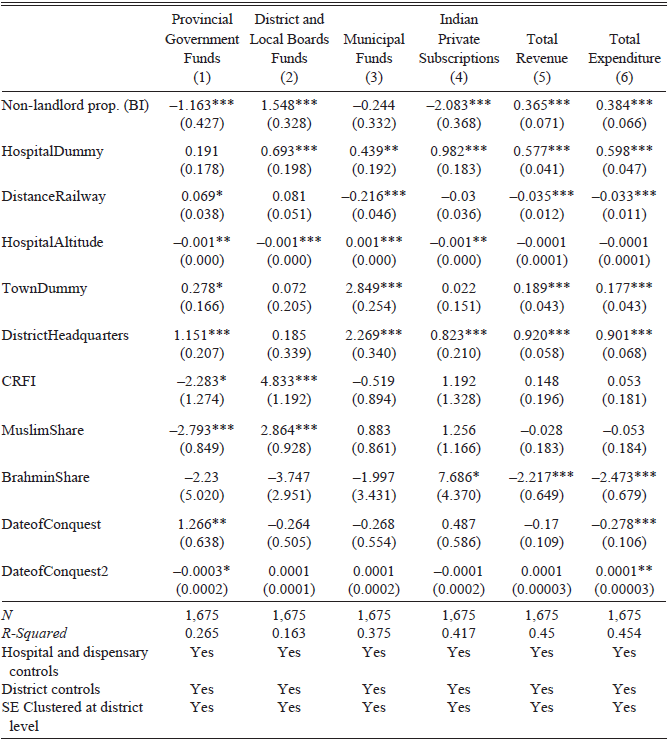
Table 2 shows the OLS estimates for every revenue source, as well as total revenue and expenditure. Unsurprisingly, hospitals received more funds and were able to spend more than dispensaries. In particular, hospitals received more funds from district boards, municipalities, and Indian private subscriptions than dispensaries.Footnote 17
OLS ESTIMATES BY SOURCE OF REVENUE, TOTAL REVENUE, AND EXPENDITURE

Notes: Revenue sources, total revenue, and expenditure transformed using the inverse hyperbolic sine function. Column (1) shows how the non-landlord proportion and other variables correlate with the funds hospitals and dispensaries received from provincial governments. Columns (2), (3), (4), (5), and (6) present the same estimation but use revenue from district and local boards, municipalities, Indian private subscriptions, total revenue, and total expenditure.
Sources: See text.
Healthcare facilities in towns and district headquarters received more funds from municipalities and provincial governments, while only those in district headquarters received more private Indian subscriptions and donations. This suggests that provincial governments invested more in facilities located in urban areas, especially in colonial administrative centers.
Hospitals and dispensaries in districts with more caste fragmentation and a larger share of Muslims received less funds from provincial governments, but more from district and local boards. In line with Chaudhary’s (2009) results for primary schools, this suggests that district boards prioritized the provision of healthcare facilities in districts populated by Muslims. Provincial governments may have sought to offset the lack of resources hospitals and dispensaries received from district and local boards in landlord districts and in districts with less caste fragmentation and Muslims—Column (1) in Table 2. Finally, the presence of upper-caste elites—such as Brahmins—correlates positively and significantly with Indian private subscriptions, suggesting that caste elites could have incentivized or granted some of these subscriptions and donations. This is consistent with Arnold’s (1993, pp. 148–49, 270) argument that the British tried to use local elites to foster and legitimize Western medicine in colonial India.
Most importantly, Table 2 shows how the revenue sources of healthcare facilities correlate with the non-landlord proportion. A healthcare facility in a non-landlord district—or a district with only non-landlord systems—received 0.50 standard deviations more from district and local boards than a facility in a landlord district—Column (2).Footnote 18 On the other hand, facilities in non-landlord districts received 0.67 standard deviations less from Indian private subscriptions and donations compared to facilities in landlord districts—Column (4). Finally, healthcare facilities in non-landlord districts had more revenue and spent more.
IV and RD
When estimating the effect of land tenure systems on the funding of hospitals and dispensaries, OLS estimates might be biased due to the omission of variables such as the demand for these facilities. District population might proxy for such demand, but it is not a perfect proxy. The demand for healthcare services could differ between districts with similar population levels. This could be due to a larger presence of traditional medicine, pre-colonial patterns of medical consumption and techniques (Berger Reference Berger2013, p. 50) or the link between Western medicine and foreign rule (Arnold Reference Arnold1993, p. 156). To mitigate this concern and provide some evidence on causality, I introduce two complementary identification strategies: an IV and a geographic RD.
INSTRUMENTAL VARIABLE (IV)
For the IV estimation, I use Banerjee and Iyer’s (2005) instrument: a dummy variable that takes a value of one for districts that were conquered between 1820 and 1856. There are several exogenous channels explaining the introduction of non-landlord systems during those years. First, by 1820, the EIC had a more effective and developed body of tax collectors who could assess tax liability for individual cultivators (Baden-Powell Reference Baden-Powell1892a, pp. 394–98, 401–07).
Most importantly, Banerjee and Iyer (Reference Banerjee and Iyer2005) highlight the importance of British officials’ ideology to explain the introduction of non-landlord systems between 1820 and 1856. Before 1820, most British officials had a Whig bias and advocated for the introduction of large landowners who provided a natural elite and social order. After 1820, utilitarian ideas gained momentum in India and England, making British officials more sympathetic to introducing non-landlord systems (Banerjee and Iyer Reference Banerjee and Iyer2005, p. 1196). Finally, after the 1857 revolt, the Government of India acknowledged landlords as key allies and began granting them landownership rights again.Footnote 19
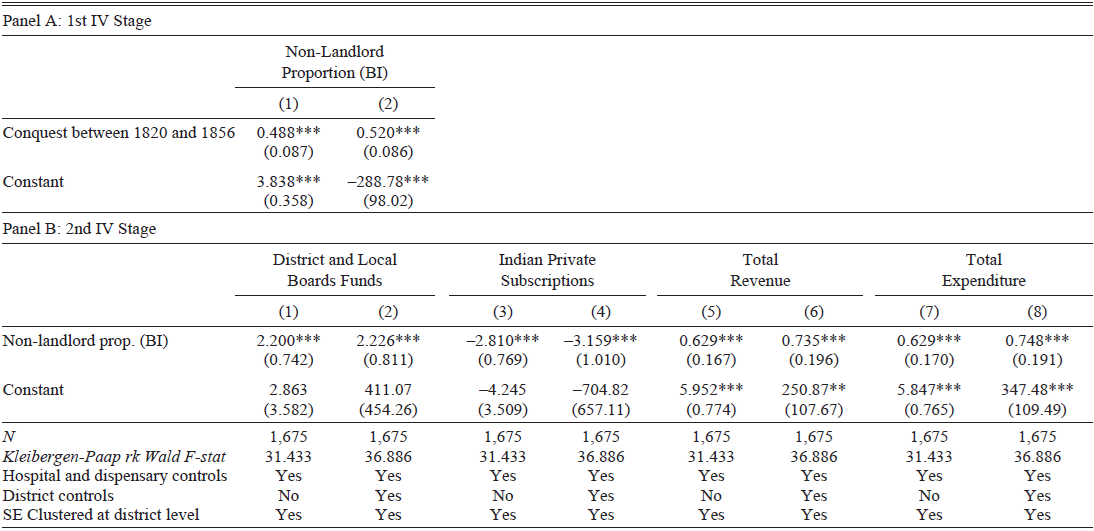
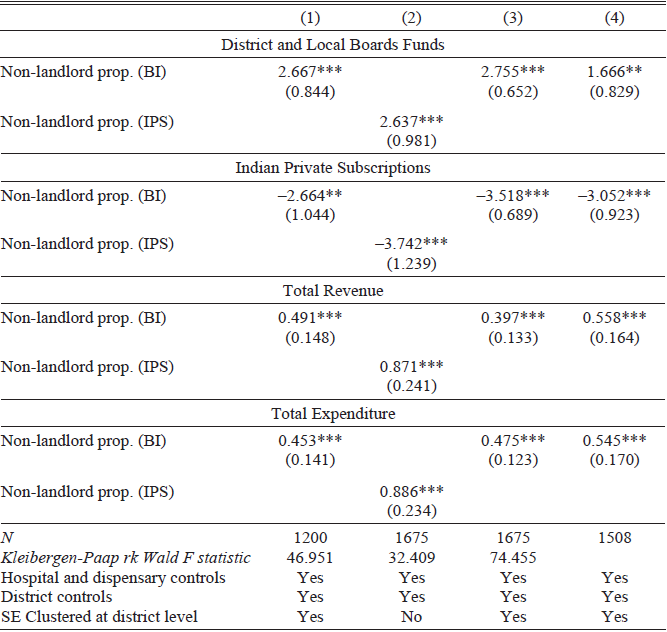
Table 3 presents the IV results. These confirm the OLS results, and the large F-statistic for all estimations suggests that being conquered between 1820 and 1856 is a strong instrument for the non-landlord proportion. Column (2) in Panel B implies that a healthcare facility in a non-landlord district received 0.72 standard deviations more from district and local boards than a facility in a district with only landlord systems. Conversely, a facility in a non-landlord district received one standard deviation less from Indian private subscriptions and donations than a facility in a landlord district. Finally, total revenue and total expenditure of healthcare facilities in non-landlord districts were, respectively, 0.80 and 0.81 standard deviations larger than those of facilities in landlord districts.Footnote 20
IV ESTIMATES BY SOURCE OF REVENUE, TOTAL REVENUE, AND EXPENDITURE

Notes: Revenue sources, total revenue, and expenditure were transformed using the inverse hyperbolic sine function to avoid biased results from right-skewed distribution of residuals, and observations with a value of 0 were dropped. Panel A shows the first-stage results. Columns (1) and (2) in Panel B show the effect of non-landlord proportion on the funds healthcare facilities received from district and local boards; Columns (3) and (4) show the funds received from Indian private subscriptions and donations; Columns (5) and (6) show their total revenue; and Columns (7) and (8) show their total expenditure.
Sources: See text.
These estimates are larger than the OLS estimates. The IV estimates are local average treatment effects, meaning that they capture the effect of a larger non-landlord proportion for those districts conquered between 1820 and 1856. By this time, the British had already introduced non-landlord systems in a few districts. This probably helped them maximize the land revenue in non-landlord districts acquired after 1820. As a result, healthcare facilities in these districts may have received more funds from district boards than healthcare facilities in other non-landlord districts. Previous experiences introducing non-landlord systems could also have helped the British avoid revolts when implementing this system in districts acquired between 1820 and 1856. This may translate into non-landlord systems further discouraging private donations to healthcare facilities in these districts.
REGRESSION DISCONTINUITY (RD)
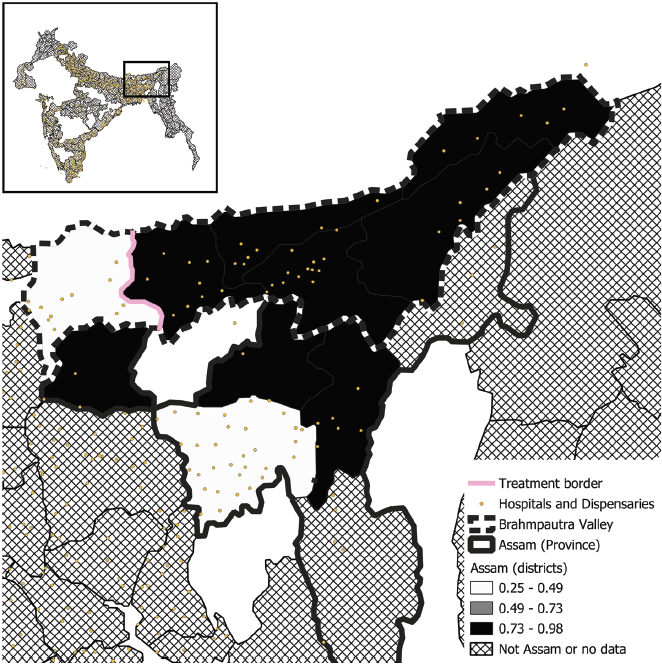
Despite the reassuring IV results, one may be concerned that they might be exclusively driven by variation across provinces, which could be explained by factors other than land tenure systems. This is because there is little to no within-province variation in land tenure systems. To address this concern, I explore a geographic RD that exploits variation across the Brahmaputra Valley in the province of Assam. For the RD to cleanly identify the effect of land tenure systems, the only significant difference between the treated and untreated regions should be the presence of different land tenure systems. Also, healthcare facilities should not have been self-selected into treatment.
Most of the Brahmaputra Valley had a large non-landlord proportion—see Figure 3—and was conquered by the EIC from the Ahom kingdom in 1824.Footnote 21 At that time, British officials widely embraced utilitarianism and introduced non-landlord systems throughout the former Ahom territories. However, the district of Goalpara (the western part of the valley) had been conquered from Mughal Bengal much earlier, in 1765. As described previously, at that time, Whig ideology was still predominant among British officials. Moreover, the EIC had very limited administrative capacity, which favored the introduction of a landlord system. Hence, a landlord system was introduced in Goalpara, making it the only district in the Brahmaputra Valley with this type of land tenure.
DISCONTINUITY IN THE BRAHMAPUTRA VALLEY
Notes: The Brahmaputra Valley (dotted border), the border between Goalpara and the rest of the valley (thick light line), and the non-landlord proportion at the district level for all Assam districts.
Sources: Author’s illustration. See text.

Even though the pre-colonial polities of the landlord and non-landlord sides of the Brahmaputra Valley were different, their administration, land rights, and social stratification were similar.Footnote 22
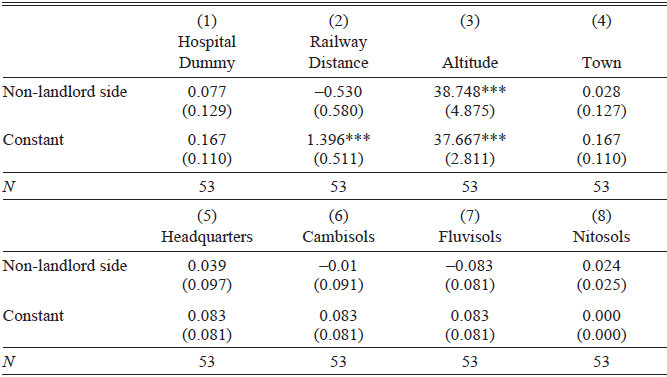
Table 4 shows that most differences in healthcare facilities and geographic characteristics across the treatment boundary were insignificant. Both non-landlord and landlord regions had a similar ratio of hospitals and dispensaries—see Column (1). There were no hospitals only for women anywhere in the valley, and healthcare facilities were in towns, district headquarters, and over different types of soils in similar proportions—Columns (4), (5), (6), (7), and (8). Nonetheless, facilities on the non-landlord side were placed on average at a higher altitude—Column (3). This difference might introduce some noise into the RD results. As shown in Table 2, facilities at higher altitudes tended to receive significantly less funding from district and local boards, as well as fewer Indian private subscriptions. These two factors might bias the RD results, although in different directions. While the former would play against the confirmation of the IV results, the latter would have the opposite effect.
BALANCE TESTS FOR GEOGRAPHIC AND HEALTHCARE FACILITIES CHARACTERISTICS

Sources: See text.
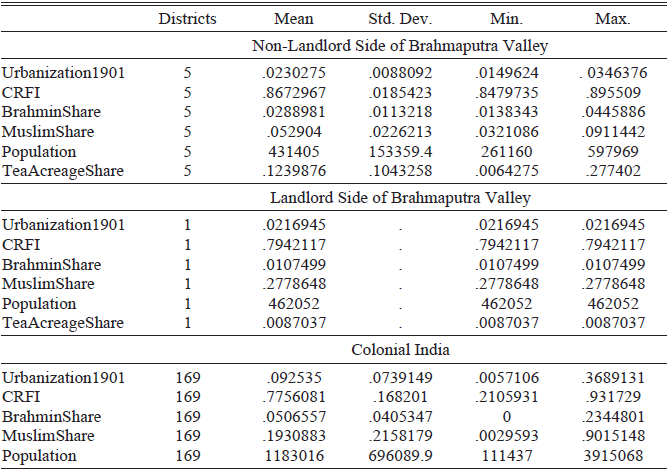
Social, demographic, and agricultural data for the Brahmaputra Valley are only available at the district level. Given that the RD only includes six districts,Footnote 23 in Table 5, I provide the summary statistics for district-level variables instead of conducting balance tests. The summary statistics show that both sides had almost identical urbanization rates and average district populations, a CRFI above the Indian average, and a Brahmin share below it. However, there were some important differences. First, the non-landlord side had a larger share of tea acreage. Tea was mostly cultivated in British-owned plantations (Gupta and Swamy Reference Gupta and Swamy2017, p. 432). Hence, a larger share of tea acreage might proxy for a lower share of Indian landowners. This could have led to healthcare facilities receiving fewer private subscriptions and donations from Indians. To mitigate this concern, in Online Appendix 8 (Table 21), I provide the results of the estimation of the RD, including only hospitals and dispensaries in districts with a small share of tea acreage (less than 6 percent), and show that most coefficients are significant and have magnitudes comparable to those in the baseline RD. Second, the landlord side of the valley had a larger share of Muslims. That should not be concerning, as the share of Muslims is positively and significantly correlated with the funds healthcare facilities received from districts and local boards—see Column (2) in Table 2. Therefore, having more Muslims on the landlord side of the Valley should bias the RD results against the confirmation of the IV results.
SUMMARY STATISTICS FOR SOCIAL AND DEMOGRAPHIC VARIABLES IN NON-LANDLORD AND LANDLORD SIDES OF THE BRAHMAPUTRA VALLEY

Sources: See text.
The acceptance of Western medicine seems also to have been rather homogeneous across the valley, according to some anecdotal evidence. Colonial officials reported that Indians had a prejudice against vaccination in the Brahmaputra Valley as a whole and broadly in the Assamese plains where inoculation was practiced. Officials also identified certain religious groups (Vaishnavites and Muslims) as being particularly opposed to vaccination in Assam (Goswami Reference Goswami2011, p. 981). These groups represented similar shares of the population in the non-landlord (54.3 percent) and landlord (60.5 percent) sides of the valley.
Overall, I argue that treatment variation was exogenous and that there were no significant differences in most pre-colonial, geographic, social, demographic, and healthcare features across the Brahmaputra Valley. While some differences existed, suggesting a degree of compound treatment, these should not systematically bias the RD results in favor of my hypotheses.
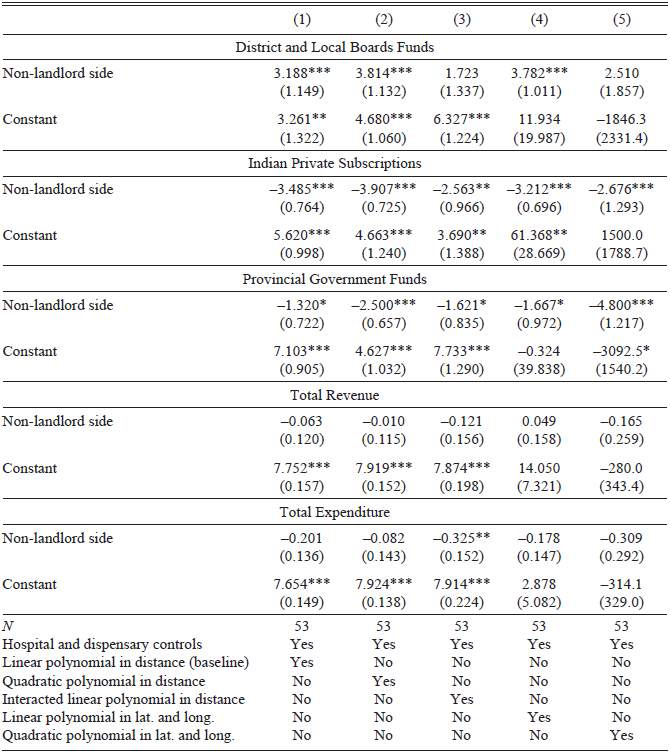
Following Dell (Reference Dell2010) and Becker et al. (Reference Becker, Boeckh, Hainz and Woessmann2016), I specify the RD using a dummy variable for healthcare facilities on the non-landlord side of the border (NonLandlordSide i), the set of hospital-level controls from Table 4 (X i), and a linear polynomial function controlling for the distance to the boundary (baseline) or other functions of geographic location:

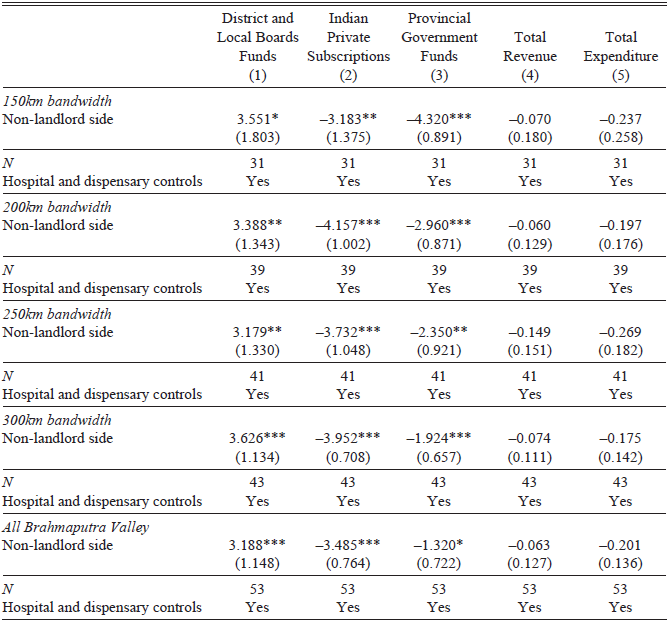
RD results are shown in Table 6. Consistent with the IV results, hospitals and dispensaries on the non-landlord side of the Brahmaputra Valley received significantly more funds from district and local boards and significantly fewer funds from Indian private subscriptions and donations. These results hold even after dropping facilities more than 300, 250, 200, and 150 kilometers away from the treatment border, drastically reducing the number of observations.
RD ESTIMATES BY SOURCE OF REVENUE, TOTAL REVENUE, AND EXPENDITURE WITH DIFFERENT BANDWIDTHS

Notes: All specifications control for the hospital and dispensary level features from Table 4 and for distance to the boundary. Standard errors are at the hospital level.
Sources: See text.
However, my RD results indicate that the land tenure systems had no significant effect on the total revenue and expenditure of healthcare facilities—see Columns (4) and (5). This is, at least partially, due to healthcare facilities on the non-landlord side of the valley receiving significantly fewer funds from the provincial government—see Column (3). The Assamese provincial government may have aimed to offset the lack of funds healthcare facilities on the landlord side received from districts and local boards. This is in line with Table 2 and the argument by Chaudhary (Reference Chaudhary2010, p. 281) and Chand (Reference Chand1947, pp. 192–94) that over time, some provincial governments provided larger grants to poorer districts.
The IV and RD estimates confirm that hospitals and dispensaries in non-landlord districts received more funds from districts and local boards and fewer funds from Indian private subscriptions. The IV also shows how healthcare facilities in non-landlord districts received more funds and spent more. Although this is not true for the RD, the difference can be explained by the policies followed by the Assamese provincial government.Footnote 24
Robustness Checks
I have carried out several robustness checks for the IV and RD results. Table 7 shows the main robustness checks for the IV. First, I drop all hospitals and dispensaries in Bengal from my sample—see Column (1). Bengal was the first province conquered by the EIC and was completely dominated by the landlord system. Ruling out the possibility that my main results are driven by healthcare facilities in this region, coefficients in Column (1) remain significant in all estimations with similar magnitudes to those in the IV baseline estimates—see Column (3) in Table 3.
IV ROBUSTNESS CHECKS BY SOURCE OF REVENUE, TOTAL REVENUE, AND EXPENDITURE

Notes: Revenue sources, total revenue, and expenditure were transformed using the inverse hyperbolic sine function to avoid biased results from right-skewed distribution of residuals, and observations with a value of 0 were dropped. Column (1) shows the IV estimates dropping all hospitals and dispensaries from Bengal. Column (2) shows the IV estimates using Iversen, Palmer-Jones, and Sen (Reference Iversen, Palmer-Jones and Sen2013) as an alternative to estimate the non-landlord proportion. Column (3) uses the distance to Plassey as an alternative instrument. Finally, Column (4) shows the IV estimates dropping the highest decile observations.
Sources: See text.
Second, I estimate the IV specification using the non-landlord proportion estimated by Iversen, Palmer-Jones, and Sen (Reference Iversen, Palmer-Jones and Sen2013) as an alternative explanatory variable. Using their non-landlord estimates does not change the IV results—see Column (2).
Third, I use the distance to the Plassey battle site as an alternative instrument for the non-landlord proportion. The battle of Plassey (1757) is widely regarded as the beginning of British rule in the subcontinent, marking the EIC’s first conquest of a large region of India. From Bengal, the EIC expanded its dominions.Footnote 25 As previously discussed, the EIC introduced a landlord system during its initial conquests, which means that the distance to the Plassey battle site and the non-landlord proportion are expected to be correlated. The F-statistic in Column (3) of Table 7 is sufficiently large to consider the distance to the Plassey battle site a strong instrument. When using this alternative instrument, all coefficients remain significant, with magnitudes similar to those obtained using the dummy for districts conquered between 1820 and 1856.
Fourth, I present the IV estimates dropping all observations within the highest decile of each revenue source, total revenue, and total expenditure. This tests the robustness of the IV results by dropping potential outliers. The IV coefficients remain significant in all cases—see Column (4).Footnote 26
Finally, I check the robustness of the RD results using alternative specifications that include different polynomials to control for the distance to the border and geographic location—see Table 8. I follow Becker et al. (Reference Becker, Boeckh, Hainz and Woessmann2016) and Dell (Reference Dell2010) and include (1) a linear polynomial in distance, (2) a quadratic polynomial in distance, (3) an interacted linear polynomial in distance, (4) a linear polynomial in latitude and longitude, and (5) a quadratic polynomial in latitude and longitude. The non-landlord side coefficients remain significant in almost all specifications. Thus, my RD results seem to be robust to different controls for the location of healthcare facilities.Footnote 27
RD ESTIMATES BY SOURCE OF REVENUE, TOTAL REVENUE, AND EXPENDITURE INCLUDING ALTERNATIVE POLYNOMIALS IN DISTANCE TO BORDER AND IN GEOGRAPHIC LOCATION

Notes: RD results including Column (1) a linear polynomial in distance (Baseline), Column (2) a quadratic polynomial in distance, Column (3) an interacted linear polynomial in distance, Column (4) a linear polynomial in latitude and longitude and, Column (5) a quadratic polynomial in latitude and longitude. All specifications control for hospital and dispensary level features in Table 4. Standard errors are at the hospital level.
Sources: See text.
MECHANISMS
Landlords’ Influence on Land Revenue
Landlords’ influence on the assessment and collection of the land tax—known as the land revenue—may explain why hospitals and dispensaries in non-landlord districts received more funds from district and local boards. District and local boards were mainly financed through provincial grants and a land tax surcharge, mostly dependent on the amount of land revenue collected. Therefore, provinces and districts collecting more land revenue could provide more funds to district and local boards, which could then be spent on healthcare facilities.Footnote 28
In this context, land tenure systems were closely related to the assessment and collection of land revenue, and landlord (non-landlord) districts collected less (more) land revenue for several reasons.
First, there were fewer village officials in landlord areas. These officials—who were paid by the colonial government—were crucial for land revenue operations (Baden-Powell Reference Baden-Powell1892a, 1892b, 1892c). Village accountants were responsible for compiling the data used by British officials to assess the land tax. In turn, village headmen were responsible for the collection of land revenue among village landowners and its delivery to British officials. Because land was more concentrated in the landlord areas (Banerjee and Iyer Reference Banerjee and Iyer2005, p. 1197), the colonial government needed fewer village officials (Lee Reference Lee2018, p. 13). This made it easier for landlords to influence land revenue assessment and collection.
Second, landlords’ influence on the assessment and collection of land revenue was enhanced by their central role in the appointment of village officials. For example, in some districts of the United Provinces, landlords nominated all village accountants—subject to final approval by British officials—while in other districts, landlords directly appointed them and fixed their remunerations (Baden-Powell Reference Baden-Powell1892b, pp. 268–83). In the Central Provinces, British officials appointed the village headman—usually a landlord paying land revenue—considering the landlords’ opinions (Governor General of India in Council 1906; Baden-Powell Reference Baden-Powell1892b). Finally, village officials in Bengal were appointed and paid directly by landlords (Baden-Powell Reference Baden-Powell1892a, pp. 675–78). In contrast, in non-landlord provinces, village officials were usually appointed directly by British officials (Baden-Powell Reference Baden-Powell1892c; Lee Reference Lee2018).Footnote 29
Third, the frequency of land tax assessments in landlord and non-landlord districts could have also affected the funds that healthcare facilities received from district boards. Many landlord districts had their land tax fixed in perpetuity, never to be updated. On the other hand, all non-landlord districts had their land tax regularly updated every 20–30 years.Footnote 30 All these resulted in less land revenue collected in districts that did not update their land tax, reducing the funds that healthcare facilities received from district and local boards in many landlord districts.
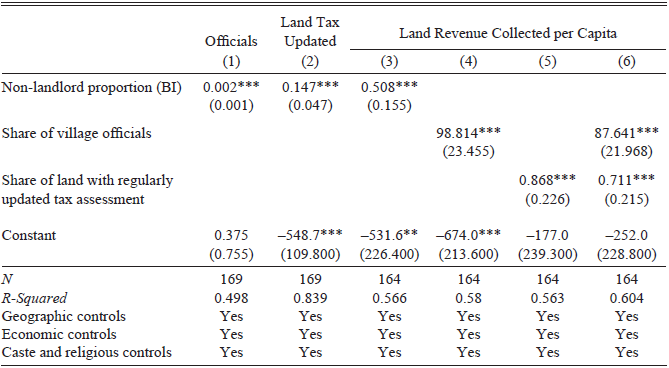
In Table 9, I provide evidence that landlord districts collected less land revenue due to having smaller shares of village officials and of land with regularly updated tax assessments. I find a positive and significant correlation between the 1911 share of male village officials over total male agricultural workers and the non-landlord proportion—see Column (1).Footnote 31 I also find a positive and significant correlation between the non-landlord proportion and the share of land with regularly updated tax assessments.Footnote 32 Finally, Table 9 also shows that districts with larger shares of village officials and of land with regularly updated tax assessments collected more land revenue per capita—see Column (6).Footnote 33 Increasing the share of village officials by 2.49 officials per 1,000 male agricultural workers (the standard deviation) increases the land revenue per capita by 24.4 percent. Similarly, increasing the share of land with regularly updated tax assessments by 40.6 percent (the standard deviation) increases the land revenue per capita by 33.4 percent.
OLS ESTIMATES OF THE SHARE OF VILLAGE OFFICIALS AND THE SHARE OF LAND WITH THE LAND TAX REGULARLY UPDATED CORRELATE WITH THE NON-LANDLORD PROPORTION AND LAND REVENUE COLLECTED

Notes: OLS estimates show how the non-landlord proportion correlates with Column (1) the share of village officials, Column (2) the share of land with the land tax regularly updated, and Column (3) land revenue per capita in ln. Column (4) shows how land revenue per capita in ln correlates with the share of village officials. Column (5) is the same as Column (4) but uses the share of land with the land tax regularly updated. Column (6) presents a regression that includes both shares. Geographic controls include district longitude, latitude, mean altitude, maximum altitude, rainfall, and a coastal dummy. Economic controls include kilometers of railway line in each district, urbanization rate, and date of conquest as well as its squared term. Finally, caste and religious controls include the CRFI, share of Brahmins. and share of Muslims.
Sources: See text. To calculate the kilometers of railway lines in each district, I use the shapefile from Fenske, Kala, and Wei (Reference Fenske, Kala and Wei2023).
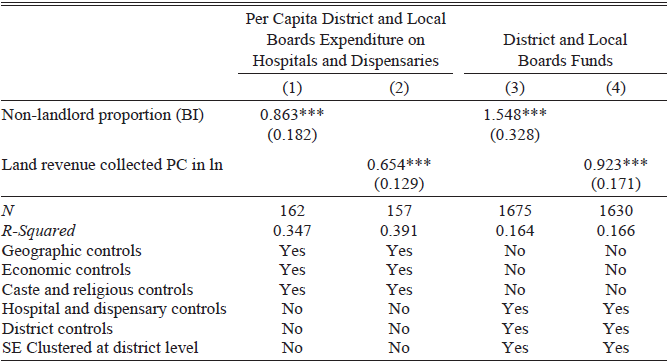
As expected, I find that district and local boards in districts collecting more land revenue had a larger per capita expenditure on healthcare facilities. Also, facilities in these districts received more funds from district and local boards—see Columns (2) and (4) in Table 10.Footnote 34
1901 LAND REVENUE PER CAPITA, DISTRICT BOARDS’ PER CAPITA EXPENDITURE ON HEALTHCARE FACILITIES, AND HEALTHCARE FACILITIES’ FUNDS FROM DISTRICT BOARDS

Notes: 1901/02 per capita district and local boards expenditure on hospitals and dispensaries is in ln. District and local boards funds represent the funds healthcare facilities received from district and local boards in 1901—transformed using the IHS function. For a complete list of controls see Table 9. See Online Appendix 11 for notes on the district and local boards expenditure data.
Sources: District and local boards expenditure on hospitals and dispensaries from BL & IOR, DB, 1902, IOR/V/24/308, IOR/V/24/318, IOR/V/24/327, IOR/V/24/332, IOR/V/24/348, IOR/V/24/353, IOR/V/24/368. See text.
Apart from the landlords’ influence on the assessment and collection of land revenue, landlords could also have affected hospitals and dispensaries’ funds from district and local boards through their representation in these boards. Landlords and their servants were the largest group of non-officials in the district boards of the landlord province of Bengal,Footnote 35 and their opinions were considered in the boards’ decisions (Royal Commission upon Decentralization 1908, p. 266). This allowed landlords to push for public spending that favored their interests, resulting in more funding for secondary schools and roads near their estates rather than for healthcare facilities (Tinker Reference Tinker1967; Chaudhary Reference Chaudhary2009). As pointed out by the Commissioner of the Presidency Division in the landlord province of Bengal: “The interests of the higher classes in such matters as roads and superior schools are strongly championed in the Boards […].”Footnote 36 Similarly, in the Central Provinces—another landlord province—it was clear that the interest of non-official board members was: “[…] rather in education than in sanitation or public works.”Footnote 37 On the other hand, non-official members in non-landlord regions showed more interest in district boards’ healthcare spending. For instance, in the non-landlord province of Punjab, some non-official members were actively involved in supervising the construction of dispensaries.Footnote 38 This suggests that non-official board members in landlord districts—which were mostly landlords—were less supportive of funding hospitals and dispensaries through district boards than non-officials in non-landlord districts.
Landlords could also have influenced district and local boards’ tax rates. When increases in the land tax surcharge for district boards were proposed, landlords opposed them vigorously and managed to reach compromises that limited them (Tinker Reference Tinker1967, p. 132). Landlords’ influence on district boards’ spending and their resistance to tax increases could have reduced the spending of district and local boards on healthcare facilities in landlord districts—see Columns (1) and (3) in Table 10.
Landlords Showing Allegiance
The influence of landlords on land revenue and district boards can explain the lower funding healthcare facilities received from district and local boards in landlord areas, but it cannot explain the larger resources these facilities received from private Indian subscriptions and donations. I argue that landlords used these subscriptions and donations to show their allegiance to the British. In return, landlords received honors and solidified their landownership rights. This was occurring mainly in landlord areas, where most insurrectional activity took place during the 1857 revolt—also known as the Mutiny or First War of Independence.
For landlords to use donations and subscriptions to showcase allegiance, the British had to clearly identify them. To do so, they cited the names and amounts of the largest contributors in some reports. In the RHD for BengalFootnote 39 it is stated how the Maharani of Tajhat donated 12,000 rupees to the Rangpur Hospital, how two Muhammadan noblemen—Syed Mahammad Mehdi Khan and Syed Shah Mahammad Kamal—granted donations of 5,000 and 2,000 rupees to the Bankipore Hospital, and how the Maharani of Hathwa donated 500 rupees to the dispensary in Kurseong. Similarly, the RHD for PunjabFootnote 40 states the names of subscribers paying over 50 rupees. Most importantly, British officials invited the largest donors to official receptions.Footnote 41 There, top-tier officials—from the viceroy to governors—granted honors and medals to Indian notables who had performed acts of loyalty and charity (Cohn Reference Cohn, Hobsbawm and Ranger2012, pp. 167, 181). Those invited were added to lists, which were distributed among British officials so they could be aware of the district and provincial leading individuals supporting British rule and contributing to public services like hospitals and dispensaries (Cohn Reference Cohn, Hobsbawm and Ranger2012; Yang Reference Yang1992).
Hence, Indian notables granting large donations to colonial public services were signaled and rewarded with medals and honors such as memberships in the Order of the Star of India, the Order of the Indian Empire, or Kaisar-i-HindFootnote 42 medals (Harper Reference Harper2018; Arnold Reference Arnold1993). Most of these honors and medals were created precisely to signal loyalty. For example, the Order of the Star of India was created in 1861—just after the 1857 revolt—to “[…] reward conspicuous merit and loyalty.”Footnote 43
Landlords granting large donations to hospitals and dispensaries were usually rewarded and signaled with these honors. The already mentioned Maharani of Hathwa—a prominent landlord—made various donations to healthcare facilities and was awarded a Kaisar-i-Hind Gold Medal for her philanthropy while multiple members of her family attended official receptions (Yang Reference Yang1992, pp. 73, 123). Similarly, the Maharaja of Darbhanga—one of the wealthiest landlords in India—received his Kaisar-i-Hind Gold Medal (1900) and membership in the Order of the Indian Empire (1902) while being vice-patron of the Dufferin Fund, an association funding female hospitals.Footnote 44 In 1906, the same Maharaja donated 10,000 rupees to the Bengal branch of the association “[…] to commemorate the visit of their Royal Highnesses the Prince and Princess of Wales” (The Countess of Dufferin’s Fund 1907, p. 18). Their Royal Highnesses decided to use the donation to construct a new ward for the Victoria Hospital. Thus, massive donations were specifically granted to be signaled and celebrate British rule, while their practical end was vague and probably less relevant to the donor.Footnote 45
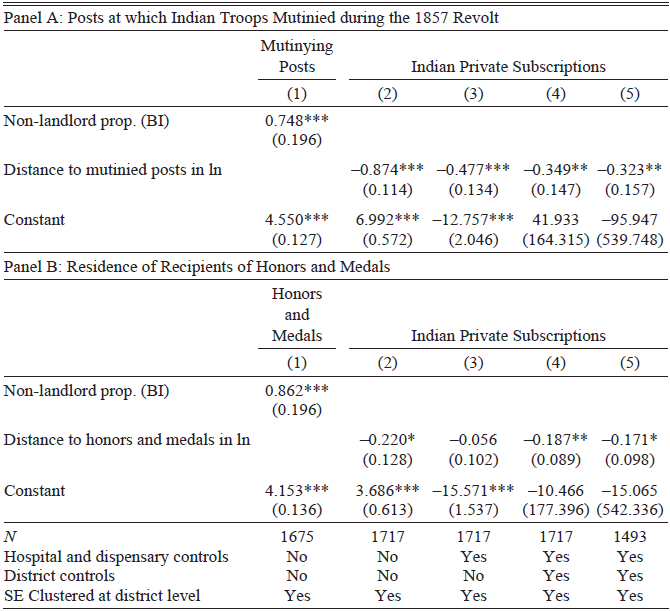
To test the role of allegiance driving larger private subscriptions and donations in landlord areas, I use hospitals and dispensaries’ distances to the closest post where Indian troops mutinied during the 1857 revolt, as well as their distances to the closest residence of an honor and medal recipient. Data on 1857 mutinying posts come from Schwartzberg’s (1992) map of the 1857 revolt.Footnote 46 Data on honors and medals come from The Indian List and Indian Office List for 1901 (Secretary of State for India 1901). I collected data on membership to the Order of the Star of India, the Order of the Indian Empire, and Kaisar-i-Hind Gold Medals. The residence of Indian recipients comes from Lethbridge (Reference Lethbridge1900). I matched 87.3 percent of Indian recipients using Secretary of State for India (1901) with their respective entries in Lethbridge (Reference Lethbridge1900)—excluding Indians residing in Princely States.
Table 11 shows how hospitals and dispensaries in landlord districts were closer to mutinying posts from the 1857 revolt (Panel A) and to residences of honors and medals’ recipients (Panel B) than facilities in non-landlord districts—see Column (1). Importantly, healthcare facilities that were further away from either the 1857 mutinying posts or from the residences of recipients of honors and medals received less private subscriptions and donations from Indians—see Columns (2) to (5). Finally, it may be argued that facilities in landlord districts received more private subscriptions and donations simply because landlord systems led to a larger concentration of agricultural income. Controlling for the urbanization rate could capture this, as most rich landowners lived in urban areas. However, Column (5) also controls for 1916 wage/income ratios (W/I).Footnote 47 Results do not change when including this control. Overall, my results suggest that landowners’ need to show allegiance can explain the differences in private Indian donations and subscriptions between healthcare facilities in landlord and non-landlord districts.
OLS ESTIMATES TESTING THE ALLEGIANCE MECHANISM: PRIVATE SUBSCRIPTIONS AND HONORS

Notes: Indian private subscriptions revenue transformed using the inverse hyperbolic sine function to avoid biased results from right-skewed distribution of residuals, and observations with a value of 0 being dropped. In Panel A, Column (1) estimates the relation between the distance, for each hospital and dispensary, to the nearest 1857 mutinying post (in natural logarithms) and its non-landlord proportion. Columns (2), (3), and (4) show how the distance to 1857 mutinying posts correlates with the revenue from Indian private subscriptions for each hospital and dispensary. Column (5) adds district-level wage/income ratios (W/I) for 1916 from Caum-Julio (Reference Caum-Julio2024) to control for agricultural incomes being more concentrated in landlord areas. Panel B presents the same regressions as Panel A but uses the distance to the nearest residence of a recipient of any medal connected to the Order of the Star of India, the Order of the Indian Empire, and the Kaisar-i-Hind Gold Medal.
Sources: See text.
SHORT-RUN IMPACT OF HEALTHCARE FACILITIES ON HEALTH OUTCOMES
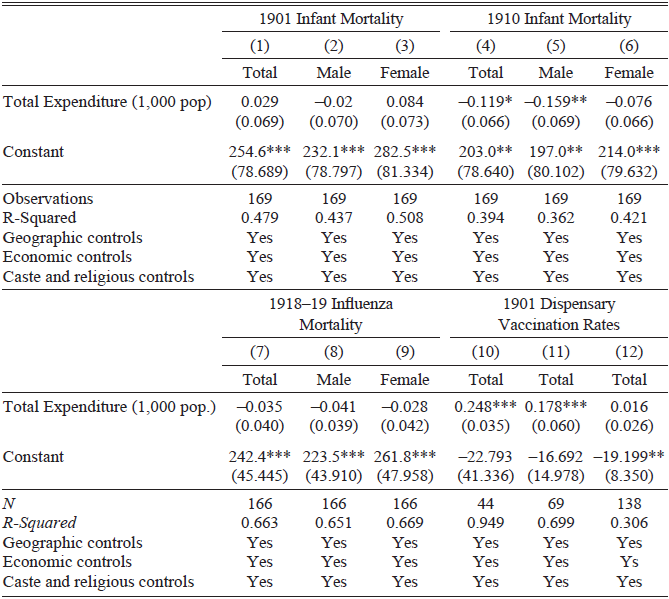
Different land tenure systems led to differences in the funding of healthcare facilities. However, did these differences significantly affect short-run health outcomes? Table 12 shows the relationship between district-level hospitals and dispensaries’ total expenditure (per 1,000 population) and infant mortality in 1901 and 1910, influenza mortality in 1918/19, and dispensary vaccination rates in 1901. I find no significant correlations when using 1901 infant mortality, 1910 female infant mortality, or 1918/19 influenza mortality rates. Only 1910 total and male infant mortality correlate negatively and significantly with total expenditure of hospitals and dispensaries—see Columns (4) and (5). The 1901 dispensary vaccination rates correlate positively and significantly with hospitals and dispensaries’ total expenditures in Bengal, Assam, and Central Provinces—Columns (10) and (11). After including districts from all provinces,Footnote 48 the coefficient drops to zero. This suggests that having hospitals and dispensaries spending more did not systematically lead to lower mortality rates in the short term and only led to more vaccinations in certain provinces.
CORRELATIONS BETWEEN INFANT MORTALITY, INFLUENZA MORTALITY, DISPENSARY VACCINATION RATES, AND TOTAL EXPENDITURE OF HEALTHCARE FACILITIES

Notes: Infant mortality is estimated using deaths of children less than a year old. Column (10) shows the correlation between total expenditure per 1,000 population and dispensary vaccination rates in Bengal. Column (11) presents the same correlation including districts in Bengal, Assam, and Central Provinces. Finally, Column (12) includes districts from all provinces except Bombay (data are unavailable). For a complete list of controls see Table 9.
Sources: See text. Data on births and deaths of infants from BL & IOR, Annual Report of the Sanitary Commissioner for [Province] (RSC), 1902 and 1911. Data on influenza mortality from Fenske, Gupta, and Yuan (Reference Fenske, Gupta and Yuan2022). Data on dispensary vaccinations from National Library of Scotland, Medical History of British India (hereafter NLS & MHBI). Triennial Report of Vaccination in [province] During the years 1899–1900, 1900–1901 and 1901–02 (hereafter RV).
The limited effect on short-term mortality may not be surprising, given the lack of effective treatments for high-mortality diseases by 1901. The impact of hospitals and dispensaries on mortality was probably more noticeable as treatments and basic knowledge of diseases improved (Arnold Reference Arnold1993, pp. 194–5). Having healthcare facilities equipped with tools and professionals capable of conducting medical research likely facilitated the implementation of new medical treatments. Although early hospitals were not very effective in treating most high-mortality diseases, they became the cornerstone of most national healthcare systems, including Britain’s (Fox Reference Fox1986, p. 56).
Misreporting could also explain the limited effect of healthcare facilities on short-term mortality. In some provinces, the reporting of births and deaths outside healthcare facilities was compulsory only in urban areas (Fenske, Gupta, and Yuan Reference Fenske, Gupta and Yuan2022, pp. 887–88), while medical officers at these facilities always reported such occurrences. Hence, underreporting of births and deaths was likely more common in districts with fewer healthcare facilities. This should bias my findings against the hypothesis that healthcare facilities reduced influenza mortality. Infant mortality should only be affected by underreporting if births and deaths were underreported in different proportions.
Despite the limited impact of 1901 hospitals and dispensaries on short-term mortality and vaccinations, these facilities could still improve the health and quality of life of those attending them during the colonial period. In fact, most operations reported in healthcare facilities were connected to minor health issues, such as the removal of abscesses and teeth.Footnote 49
CONCLUSIONS
I use a new hospital-level georeferenced dataset, an instrumental variable, and a geographic regression discontinuity to understand the allocation of resources to healthcare. I find that hospitals and dispensaries in non-landlord districts received more funds—particularly from district and local boards—while those in landlord districts received more private subscriptions and donations from Indians. In landlord regions, landlords influenced land tax collection and the expenditure of district boards, reducing the funds allocated to healthcare facilities. Landlords also made donations and subscriptions to healthcare facilities to show allegiance, receiving honors and securing their landownership rights in return. This increased the funds healthcare facilities received from private sources in landlord areas.
These findings speak to recent research on the impact of landed elites on the provision of public goods. This paper suggests that institutional settings favoring land concentration can allow landowners to influence the revenue and spending of local public boards, reducing allocation to healthcare. At the same time, these institutional settings may increase the private funding of healthcare if landowners have incentives to give donations and if these are rewarded by the state.