
Introduction
With the development of industry and urbanization, organic pollutants in rivers and oceans have become a serious environmental problem.[Reference Turkar, Bharti and Gaikwad1–Reference Brostow and Lobland3] It is a challenge for human beings to develop the simple and effective methods to treat organic pollutants. Titanium oxide (TiO2) is a widely used photocatalyst to realize the degradation of organic matter for its optical and electrical properties, non-toxicity, chemical stability, and low production cost. However, TiO2 has relatively low photocatalysis efficiency, due to its wide band gap (E g: 3.0–3.2 eV) and low light absorption. Many researchers have been devoted to reducing the band gap and making it more active in the visible light spectrum by doping[Reference Zhang, Qin, Yu, Zhang, Xie, Sun, Shao, Guo, Hao, Zheng and Guo4–Reference Sene, Zeltner and Anderson14] but it is a challenge to fabricate TiO2-based photocatalyst with high light absorbance.
Carbon aerogels (CAs) are highly porous materials with three-dimensional (3D) microporous and mesoporous network.[Reference Du, Zhou, Zhang and Shen15] The CA had been extensively studied by researchers due to its many excellent properties, such as the large surface area, the tunable & unique property, and low bulk density.[Reference Schwan and Ratke16–Reference Xie, Sun, Liu, Du, Zhang, Wu and Fan20] The CAs are promising materials for hydrogen storage, electrode materials for supercapacitors and electrochemical double-layer capacitors, adsorption materials to remove poisonous gases, light absorb materials, and so on.[Reference Zubizarreta, Menéndez, Job, Marco-Lozar, Pirard, Pis, Linares-Solano, Cazorla-Amorós and Arenillas21–Reference Ran, Yang and Shao25] Recently, CA was found as one of the best super black materials that have high light absorptivity range from ultraviolet (UV) to infrared (IR).[Reference Meier, Korwi and Merzbacher26, Reference Merzbacher, Meier, Pierce and Korwin27] We studied the interaction between the subwavelength structure and the light-absorbing performance in super black CAs and improved the understanding of super black behaviors.[Reference Sun, Du, Feng, Shen, Huang, Tang and Zhou28] Moreover, the production of CAs had been industrialized and may be bought easily in the near future.
In this study, we fabricated CAs/TiO2 composite sheets by physical mixing method, using CA and TiO2 powder as the raw materials and polyvinylidene difluoride (PVDF) 1-methyl-2-pyrrolidinone (NMP) solution as the binder. In our previous study, we found that the structure smaller than 2 nm in CAs strongly enhanced their absorption of visible light.[Reference Sun, Du, Feng, Shen, Huang, Tang and Zhou28] The electron–electron interaction was regarded as the main factor increasing the light absorbing in the conductor with the size much smaller than the mean free path of electrons. That means CAs may have strong hot electron effect under illumination. Thus, we designed the simple composite to study whether the photocatalysis efficiency of TiO2 could be enhanced by the hot electrons on the surface of CA. Super black CA can block part of the light illuminated on TiO2 and are expected to decrease the photocatalysis performance if there is no energy transferred from CA to TiO2. But it was found that the photocatalysis efficiency of composite sheet was improved obviously, indicating the strong hot electrons coupling between super black CA and TiO2.
Experimental
All reagents, including resorcinol (99%), formaldehyde (37% in water), sodium carbonate, ethanol, PVDF, NMP, and TiO2 (99.8%, 25 nm) were purchased from Shanghai Chemical Reagent Company with their purity being of analytical grade and used without further purified.
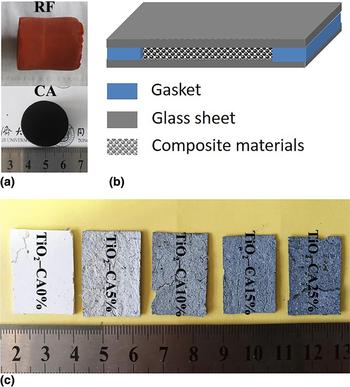
CAs in this study were derived from carbonization of resorcinol–formaldehyde (RF) aerogels, and the RF aerogels were prepared by the sol–gel polymerization of resorcinol and formaldehyde with sodium carbonate as the catalyst and deionized water as the solvent. The molar ratio of R:Catalyst and R:F was 500:1 and 2:1, respectively. Generally speaking, resorcinol (3.24 g) was dissolved in deionized water (91.21 mL), and formaldehyde (4.470 mL) was added. The solution was stirred for 10 min, and then sodium carbonate aqueous solution (1.175 mL, 0.05 molL−1) was added. After further stirring, the precursor solution was cured in a sealed glass vial (≈ 3.5 cm in diameter) at 85 °C for 72 h for generation. The gel was taken out from the vial and washed with ethanol for several times to completely remove residual water and solvents. Then, the wet gel was dried by supercritical CO2 to obtain RF aerogel. The RF aerogel was subsequently carbonized in a quartz tube furnace at 1000 °C for 3 h under N2 flowing at 300 mL min−1. After carbonization, the tube was allowed to cool down to room temperature and the low density (46 mg cm−3) CA was obtained. Photographs of R × F aerogel and CA were shown in Fig. 1(a).
(a) Photographs of RF aerogel and CA; (b) schematic diagram of molding fabrication of composite sheets; (c) photographs of super black carbon aerogel/TiO2 composite sheets with the size of 30 mm × 20 mm × 0.5 mm.
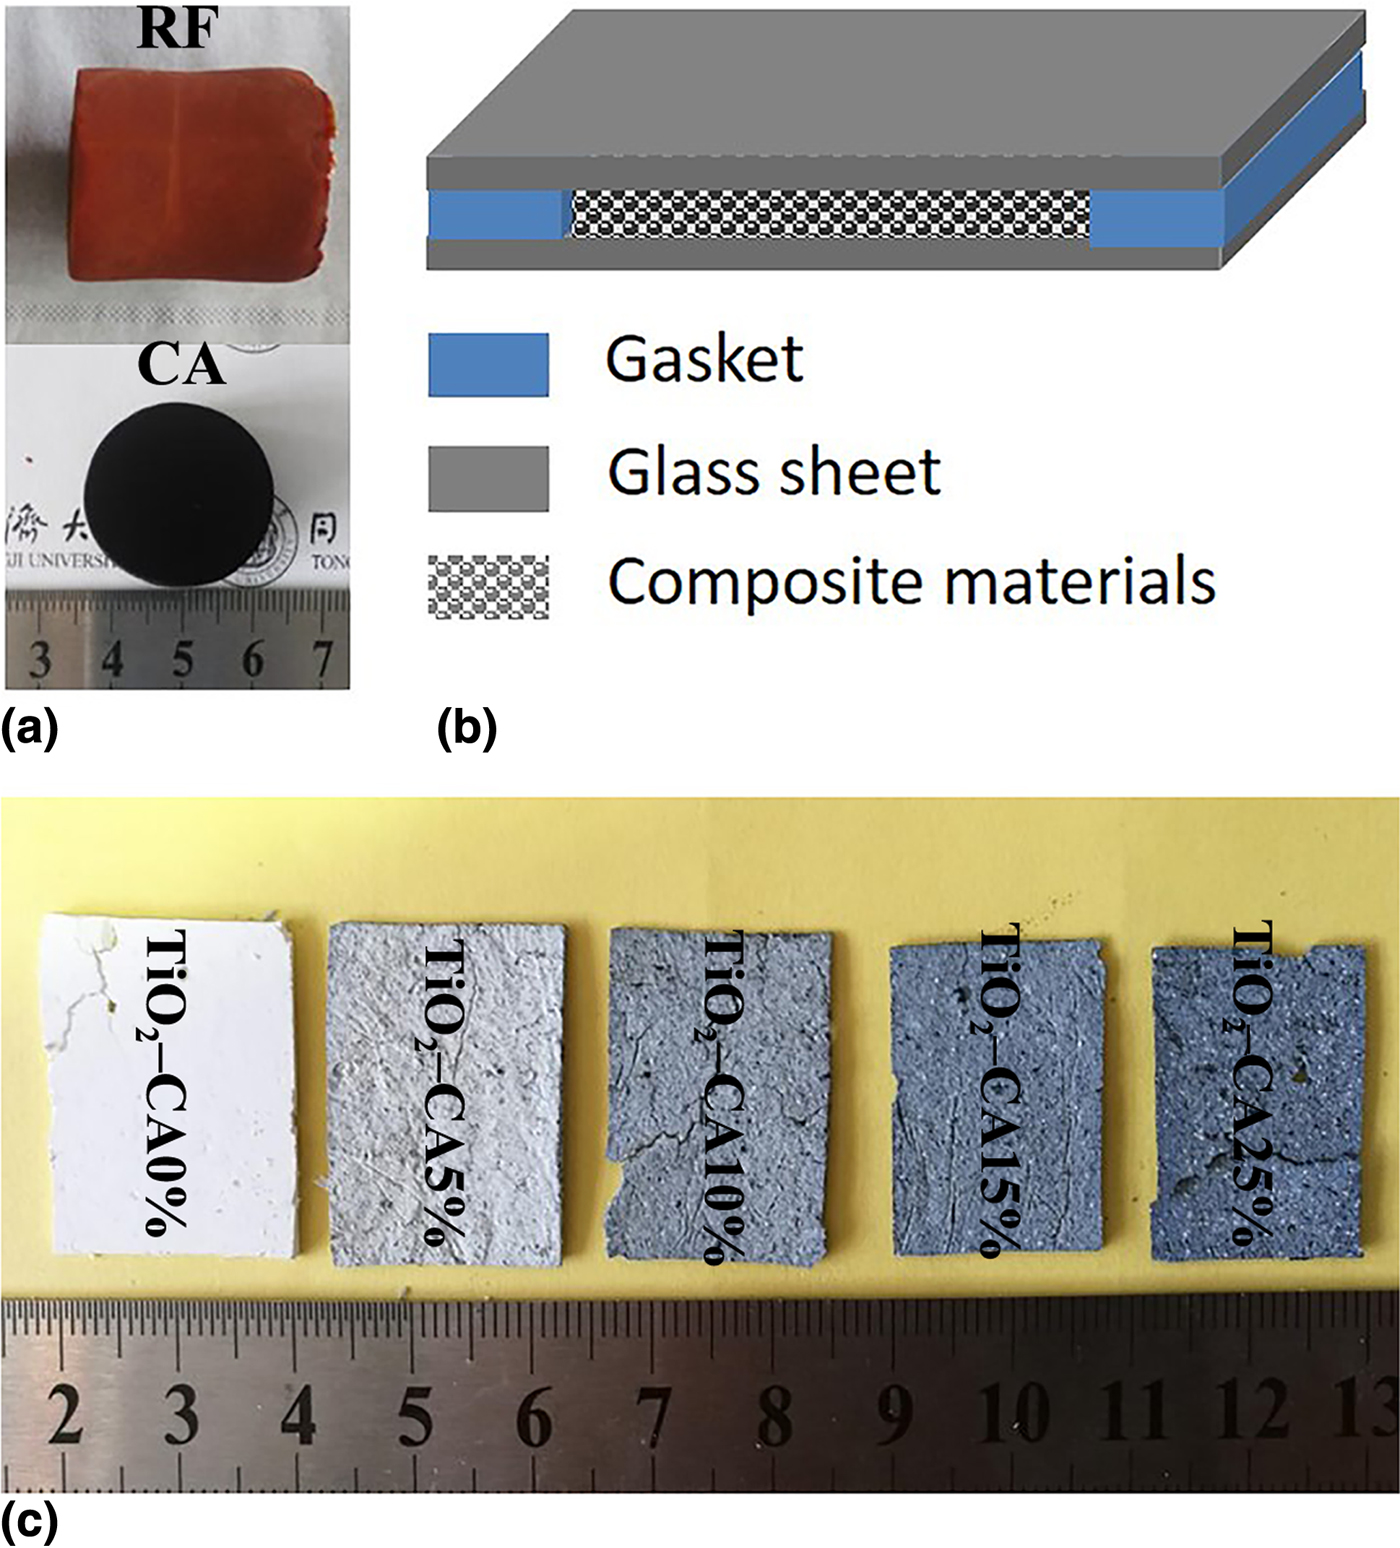
Super black CA/TiO2 composite sheets (30 × 20 × 0.5 mm3) were directly fabricated by physical mixing method, using CA and TiO2 powder as the raw materials and PVDF (8g, NMP (95 mL) solution as the binder. As shown in Fig. 1(b), all sheets were directly tableted in a mold. The samples were named by TiO2–CAwt%, where wt% was the percentage of the weight of CA account for CA and TiO2. Photographs of composite sheets were shown in Fig. 1(c).
The morphology of the samples was characterized by a scanning electron microscopy (SEM, Philips-XL30FEG). Nitrogen adsorption–desorption isotherms at 77.4 K were characterized by an N2 adsorption analyzer (Quantachrome Autosorb-1-MP) to measure the specific surface area and pore size distribution of CA. The absorption spectra were measured by a UV-vis-NIR spectrophotometer (HORIBA V-570, Japan). Raman spectra (HORIBA Jobin-Yvon HR800) were recorded in the range of 1000–2000 cm−1 using a 514 nm argon ion laser. Thermal gravimetric analysis (TGA, Perkin Elmer TGA-7) was performed from 30 to 1000 °C at air atmosphere to calculate the actual mass of CA and TiO2, with heating rate of 10 °C/min. The photocatalytic activities of the samples were evaluated by the photodegradation of methylene blue in aqueous solution (10 mg/L, 80 mL). Before irradiation, samples were standing in dark environment for 12 h to reach the adsorption–desorption equilibrium. Then, samples were exposed to UV light irradiation with a 50 W lamp to provide UV light (365 nm). The light was normal incident on the surface of samples, and the surface area of the light radiation was only 30 mm × 20 mm. Every 2 h, 2 mL solution was taken from each test tube to test the absorbance by UV–vis–NIR spectrophotometer (HITACHI, U-3900H, Japan).
Results and discussion
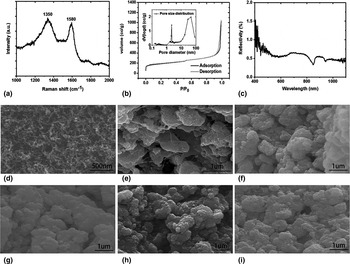
Figure 2(a) represents the Raman spectra of CA. Two main peaks are observed at ~1350 and ~1580 cm−1 corresponding to the D and G bands of CA.[Reference Zhu, Murali, Cai, Li, Suk, Potts and Ruoff29] D band corresponds to the defects while G band relates to graphite properties. The relative intensity ratio of I D/I G is 1.06, representing that CA is a disordered structure material. The textural parameters of CA were investigated by nitrogen adsorption/desorption technique [Fig. 2(b)]. According to the IUPAC classification,[Reference Merzbacher, Meier, Pierce and Korwin27] CA exhibits type I curve shape with high adsorption volume at low relative pressure and nearly invisible hysteresis loop, which implies the dominance of microspores in the sample. High adsorption volume also arises at high relative pressure, which implies the dominance of macropores in the sample. The BJH pore size distribution of CA indicates that CA has extensive pore distribution ranging 0.15–100 nm; and the feature peaks are 0.29, 2.18, and 45.75 nm [Fig. 2(b), insert]. The extensive pore distribution ensured the high specific surface area (594.8 m2/g), micropore surface area (230.9 m2/g), pore volume (1.615 cm3/g), and micropore volume (0.131 cm3/g) of CA, which might contribute to the adsorption and catalysis. We had studied the effect of subwavelength structure to the light absorption performance in super black CAs that contained randomly abundant subwavelength structure. As shown in Fig. 2(c), the obtained CA is an ideal light absorption material (average reflectivity is ~ 0.59%, ranging from 400 to 1100 nm), which contributes to the high light absorption of CA/TiO2 composite.
(a) Raman spectra of CA; (b) nitrogen sorption isotherm and pore size distribution (insert) of CA; (c) reflectance spectra of CA; (d)–(i) SEM images of CA, TiO2–CA0%, TiO2–CA5%, TiO2–CA10%, TiO2–CA15%, and TiO2–CA25%, respectively.

Figure 2(d) shows the SEM morphology of CA, the structure of CA is supported by dendritic carbon skeletons which are made by primary carbon nanoparticles. Figure 2(e)–(i) show the SEM morphology of super black CA/TiO2 composite sheets. TiO2 were tightly adhered to the surface of CA, which supports the transport possibility of hot electron energy from super black CA to TiO2 via tunneling or coupling effect.
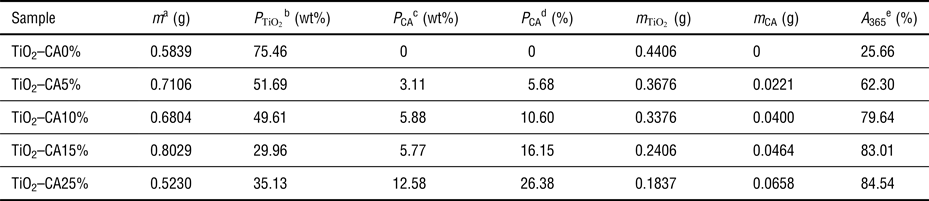
TGA were performed in the air atmosphere to calculate the actual content of CA and TiO2 in different samples. Pure CA [Fig. S1(a)] could be oxidized and rapidly oxidized when the temperature reached 500 and 620 °C, respectively. The composite materials show multiple weight loss process [Fig. S1(b)–(f)]. The multiple weight loss process could be divided into four stages: (i) stage I ranging 30–160 °C, the evaporation of water and solvent. (ii) Stage II ranging 160–490 °C, the evaporation and decomposition of PVDF. (iii) Stage III ranging 490–660 °C, the oxidation of CA. (iv) Stage IV ranging 660–1000 °C, the residual and pure TiO2. We can calculate the weight loss ratio in stage III and weight remain ratio in stage IV, which represents the actual content of CA and TiO2 in the composite materials, respectively. Calculated data were listed in Table I.
Detailed parameters of the composite sheets.

a The mass of composite sheet.
b The calculated weight proportion from TGA of TiO2 in sheet.
c The calculated weight proportion from TGA of CA in sheet.
d The actual percentage of the weight of CA account for CA and TiO2.
e The light absorptivity at 365 nm.
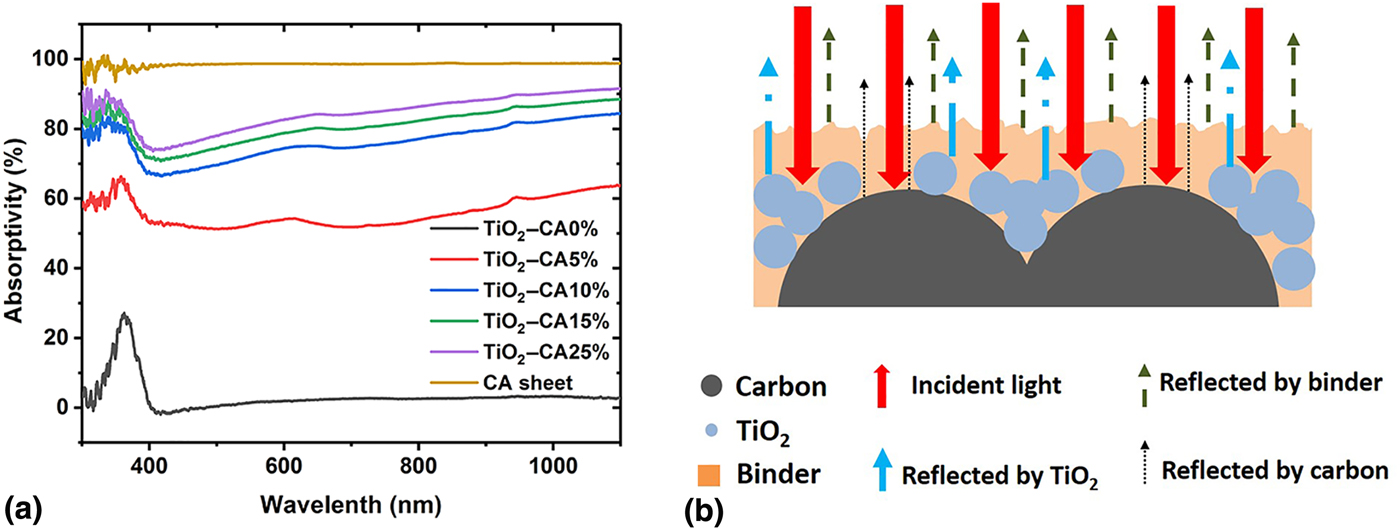
Absorption spectra [Fig. 3(a)] of different composite sheets were measured to calculate the actual light absorption of CA and TiO2. Pure TiO2 showed an absorption peak in 363 nm, which was close to the central wavelength (365 nm) of lamp. However, the absorptivity of pure TiO2 was only 25.66% in the central wavelength, which reduced the light utilization and actual photolysis efficiency in a great extent. For TiO2–CA5%, the light absorptivity reached 62.30% in the central wavelength, which was 2.43 times of pure TiO2. It is worth mentioning that the absorption of TiO2–CA5% exceeds 50% ranging from 300 to 1100 nm. The more the content of CA, the higher the absorptivity.
(a) Absorption spectra of different composite sheets; (b) the light reflection behavior in composite sheets.
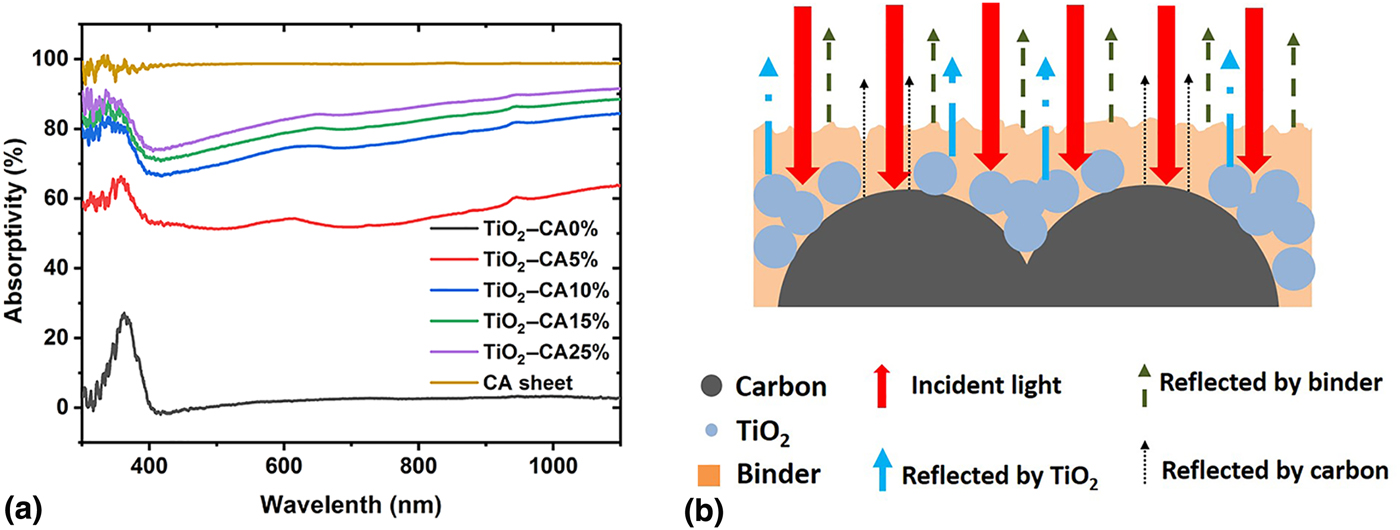
Obviously, the light absorptivity of composite materials could not use simple linear superposition of pure CA and pure TiO2 to calculate. The photocatalysis efficiency is also not proportional to the light absorptivity for composite materials. As shown in Fig. 3(b) and Fig. 4(b), light absorption in composite sheets could be calculated by formula (1).
 $$A = 100\% - R,$$
where A and R are the absorptivity and reflectivity of sheets, respectively. Ignoring the multiple reflections of interface, the reflectivity could be determined by three parts including the lights reflected by binder (R b), TiO2  $(R_{{\rm TiO}_2} ),$ and CA (R CA). The total reflectivity of sheets should be determined by formula (2).
 $$R = R_{\rm b} + (1 - R_{\rm b} )(r_{{\rm CA}} R_{{\rm CA}} + r_{{\rm TiO}_2} R_{{\rm TiO}_2} ),$$
 $$r_{{\rm CA}} + r_{{\rm TiO}_{2}} = 100\%, $$
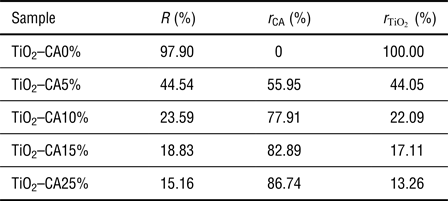
where r CA and  $r_{{\rm TiO}_2} $ are the actual light distribution ratio (LDR) of CA and TiO2, respectively. The calculated data were listed in Table II. The detailed calculation steps were introduced in supporting information.
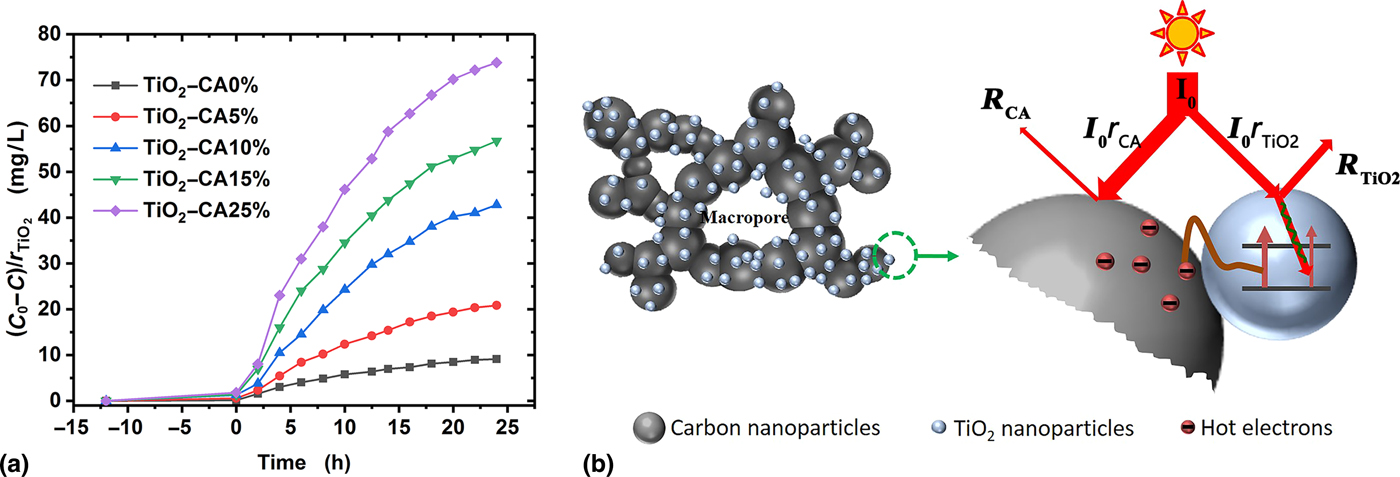
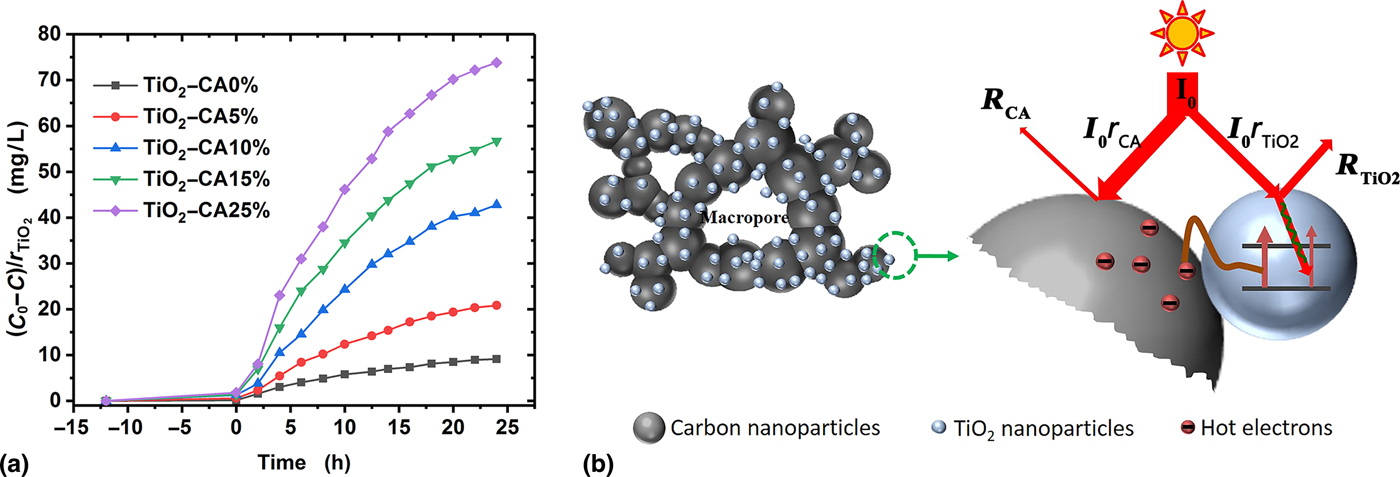
(a) The curves of the exposure time versus concentration changes of methylene blue for per unit LDR of TiO2; (b) the schematic diagram showing that direct light absorption of TiO2 and indirect energy transfer from super black CA enhance the photocatalysis efficiency of composite sheet.
Average reflectivity (300–1100 nm) of sheets, and actual light distribution ratio of CA and TiO2.

The photocatalytic activities of the samples were evaluated by the photodegradation of methylene blue. As shown in Fig. 4(a), we calculated the results of concentration changes (versus time) of methylene blue for per unit LDR of TiO2. Before irradiation, samples were maintained in dark environment for 12 h to reach the adsorption–desorption equilibrium. Obviously, there is nearly no concentration changes after the adsorption–desorption equilibrium. The more the content of CA, the better the photocatalysis efficiency of TiO2. In other words, higher energy absorption will lead to better performance of photocatalysis. For per unit LDR of TiO2, composite materials show obviously higher photocatalysis efficiency than pure TiO2. The highest photocatalysis efficiency of composite sheet is 8.08 times of that of pure TiO2 sheet.
We attribute this phenomenon to the hot electrons coupling in super black CA composite TiO2. As shown in Fig. 4(b), many TiO2 nanoparticles adhere to the surface of carbon skeletons, and TiO2 has smaller effective area than CA. Furthermore, the reflectivity of TiO2 is relatively high, leading to the low effective absorption of the light. That is the reason why pure TiO2 exhibiting relatively low photocatalysis efficiency. For the composite sheets, the light is mainly absorbed by CA. Different from novel metal nanoparticles, CA is super black and cannot emit the electromagnetic wave of the same frequency after absorbing the light. If there is no coupling effect between CA and TiO2, the energy deposited on CA cannot transfer to TiO2 and facilitate the photocatalysis of TiO2. However, the results show that there is significant improvement of the photocatalysis efficiency of the composite sheets, indicating the strong coupling effect between super black CA and TiO2. It is worth noting that physical mixing was used in order to decrease the direct contact between CA and TiO2, avoiding the possible enhancement derived from the separation effect of electron–hole pairs. In our previous study, we found that the electron–electron interaction might be the main factor increasing the light absorbing in the subwavelength structure of super black CAs.[Reference Sun, Du, Feng, Shen, Huang, Tang and Zhou28] That meant CAs may have strong hot electron effect under illumination. The absorbed energy of CA could be delivered to TiO2 via coupling or tunneling effect of hot electrons. The energy delivered from CA to TiO2 was the main energy source which ensured the high photocatalytic efficiency of composite sheets. The direct light absorption of TiO2 and indirect energy transfer from super black CA both contribute the high photocatalysis efficiency of composite sheets.
Conclusions
In summary, we fabricated super black CA composite TiO2 sheets by physical mixing method, using CA and TiO2 powder as the raw materials and PVDF NMP solution as the binder. Besides the direct light absorption of TiO2, the hot electrons coupling and indirect energy transfer from super black CA to TiO2 enhance the photocatalysis efficiency of TiO2, so that the composite sheets show significantly higher photocatalysis efficiency than pure TiO2. There may be a great potential that the super black CA can be used to enhance photo-induced reactions in others field.
Supplementary material
The supplementary material for this article can be found at https://doi.org/10.1557/mrc.2018.73
Acknowledgments
This work was support by the National Key Research and Development Program of China (grant no. 2017YFA0204600) and Sheng Feiyun Science and Technology Innovation Fund of Tongji University. The authors thank Professor Chuanwei Cheng for light absorption tests of methylene blue aqueous solution.