

Election observers have long contended that “money is the lifeblood of politics.” Political donations provide resources that help candidates win elections, but they also matter in nonmaterial ways. Donations suggest candidates have electoral support, and this signaling can influence voter evaluations of a campaign's credibility and viability (Burrell Reference Burrell2014; Feigenbaum and Shelton Reference Feigenbaum and Shelton2012). In addition, candidates and parties may be more attentive or sympathetic to the concerns or interests of donors, which can affect political discourse and policy outcomes (Canes-Wrone and Gibson Reference Canes-Wrone and Gibson2019; Francia et al. Reference Francia, Green, Herrnson, Powell and Wilcox2003). In this way, donations are not just an act of political participation; they help us understand representation.
Even so, there is limited scholarship on political contributions and even less on gendered patterns that might underpin them. The latter gap is surprising because donations influence both the descriptive and the substantive facets of representation that are a central preoccupation in the women and politics literature (Cowell-Meyers and Langbein Reference Cowell-Meyers and Langbein2009; Pitkin Reference Pitkin1972). However, explanations of women's representation typically look to other measures of engagement, such as voting and party membership (Coffé and Bolzendahl Reference Coffé and Bolzendahl2010; Schlozman et al. Reference Schlozman, Burns, Verba and Donahue1995), policy priorities (Gidengil Reference Gidengil1995), and running for and holding elected office (Lawless and Fox Reference Lawless and Fox2010; Sevi, Arel-Bundock, and Blais Reference Sevi, Arel-Bundock and Blais2018). There is much less attention to donations despite their link to electoral and policy representation.
The absence of high-quality data on political donations has constrained research in this area, but most existing studies conclude there is no gender penalty in fundraising: regardless of gender, men and women candidates raise roughly equivalent amounts of money (Hogan Reference Hogan2007; but see also Anastasopoulos Reference Anastasopoulos2016; Barber, Butler, and Preece Reference Barber, Butler and Preece2016; Burrell Reference Burrell1985, Reference Burrell2014; Kitchens and Swers Reference Kitchens and Swers2016). Studies further suggest there is more gender variation among contributors than recipients. In terms of amounts and frequency, women donors seem to give less than their male counterparts (Burrell Reference Burrell2014; Francia et al. Reference Francia, Green, Herrnson, Powell and Wilcox2005; Grant and Rudolph Reference Grant and Rudolph2002; Thomsen and Swers Reference Thomsen and Swers2017; Verba, Schlozman, and Brady Reference Verba, Schlozman and Brady1995).
This literature largely examines the American context, in which campaign donations comprise contributions from individual donors as well as those from well-resourced political action committees (PACs). Women candidates in the United States benefit from PACs such as EMILY's List, the Wish List, and the Susan B. Anthony List, which target individual women donors and direct their contributions to promising women candidates (Crespin and Deitz Reference Crespin and Deitz2010). These donor networks have had a positive effect on the electoral outcomes of Democratic women, in particular, where the infrastructure is particularly robust (Crespin and Deitz Reference Crespin and Deitz2010; Crowder-Meyer and Cooperman Reference Crowder-Meyer and Cooperman2018; Francia Reference Francia2001; Thomsen and Swers Reference Thomsen and Swers2017). In political systems in which donor networks are less institutionalized, different fundraising patterns may emerge.
In this study, we focus on a basic but important research question: are political donations gendered? We answer this question by looking at nearly five million donations made to Canadian federal candidates and parties between 1993 and 2018. The scope of the data set alone is impressive, but our focus on Canada is also advantageous. This is a country that tightened its political finance regime in 2003, a shift that saw prohibitions on union and corporate donations, and reductions in the total amounts that individuals could contribute. These changes shifted the fundraising strategies employed by candidates and parties.
Our approach allows us to identify whether gendered donation patterns persist despite differing political finance regimes within the country under study and between countries with different political systems and infrastructure. Canada differs from the United States in a number of ways, including the absence of women's PACs but also the presence of more registered parties, less polarization, and more flexible partisanship (Anderson and Stephenson Reference Anderson and Stephenson2010). Party membership is more limited, less committed, and more diffuse than in the United States (Young and Jansen Reference Young and Jansen2011). Despite these weaker partisan attachments, the Canadian system is less candidate-centric than in the United States, and vote choice tends to be dictated by party preference (Blais et al. Reference Blais, Gidengil, Dobrzynska, Nevitte and Nadeau2003; Stevens et al. Reference Stevens, Islam, de Geus, Goldberg, McAndrews, Mierke-Zatwarnicki, Loewen and Rubenson2019). Finally, the Canadian literature finds less evidence of gender affinity in vote choice than elsewhere: party preference largely overrides whatever preference there may be for same-gender candidates (Goodyear-Grant and Croskill Reference Goodyear-Grant and Croskill2011). Unlike ballots, however, donations may be distributed among multiple candidates and parties. As a result, donors can make contributions that serve different purposes whether those are strategic or more symbolic. This donation-specific characteristic could dampen strict partisan considerations, and gender affinity effects might emerge.
To observe actual donor behavior, we leverage Canada's administrative database of political contributions to federal candidates and political parties and use automated coding to predict the gender of each donor. A similar approach has been used to estimate the ethnic background of large numbers of donors in the United States (Cho Reference Cho2001, Reference Cho2002; Grumbach and Sahn Reference Grumbach and Sahn2020) and to predict the gender of donors over two electoral cycles (Thomsen and Swers Reference Thomsen and Swers2017). This methodological innovation is advantageous because donation rates derived from self-reported survey data may be susceptible to social desirability bias and could lead to inflated estimates,Footnote 1 while the scenarios used in experimental designs to understand donor motivations might not reflect real-world behavior (Eckel and Grossman Reference Eckel and Grossman2001). We merge data on donor gender with data on candidate demographics to draw conclusions about the characteristics of both donors and recipients over a 25-year period and multiple election cycles.
We find a gendered donations gap, with men contributing more money to candidates and political parties. This gap has narrowed but remains large, and it has persisted over the two and a half decades that we examine. This pattern is apparent despite changes to electoral finance laws, which were in part intended to even out inequalities among political donors, and even as other gender gaps have shrunk, including those related to wages and electoral representation. When women do give money, they are more likely than men to donate to parties on the left and to the national party rather than to local candidates. These patterns may reflect ideological preferences, outreach efforts, and gendered differences in political networks.
Finally, in contrast to the large body of literature on affinity voting, which in Canada suggests that women voters are no more likely than men to support women candidates, we observe clear gender affinity effects among women donors. Women donors support women candidates, and this affinity occurs even though Canada lacks the gendered PACs that in the United States encourage women donors to support women candidates. Our research suggests that gender affinity in donations is not simply a function of a gendered donor infrastructure. With respect to the practical implications of our research, we demonstrate that although women candidates can find support in women donors, they are disadvantaged by the fact that their most likely donors—women—are less likely to give money to any candidate. Because our findings suggest that the gendered donations gap is durable, this could have consequences for women's political representation. Efforts to increase women's presence in elected office should focus on the participation of women not only as candidates but also as donors.
OVERVIEW OF EXISTING RESEARCH AND EXPECTATIONS
The normative underpinning of research on political participation is that democracies require equality of participation (Dahl Reference Dahl2006). When participation is unequal and that inequality is persistently linked to sociodemographic traits such as gender, race, or income, equality norms are violated, but variations in political participation have been found in a number of domains. In the realm of political finance, research shows that socioeconomic status, networks, and political engagement all influence propensity to give. Those with financial resources give more frequently and more generously to political parties and candidates, as do those with stronger social networks, higher levels of political interest, and stronger levels of partisan attachment (Brady, Schlozman, and Verba Reference Brady, Schlozman and Verba1999; Francia et al. Reference Francia, Green, Herrnson, Powell and Wilcox2005; Grant and Rudolph Reference Grant and Rudolph2002; Verba, Schlozman, and Brady Reference Verba, Schlozman and Brady1995).
When it comes to gender gaps in political finance, most research looks not at who gives but instead who receives. This literature counters perceptions of women candidates as inferior fundraisers; it concludes that if women candidates raise less money, it is because they are less likely than men to be incumbents, and incumbents have an edge when soliciting contributions (Uhlaner and Schlozman Reference Uhlaner and Schlozman1986). More recent research finds little evidence of gender differences in political fundraising. Under some conditions, the advantage in fact goes to women candidates (Hassell and Visalvanich Reference Hassell and Visalvanich2019; Kitchens and Swers Reference Kitchens and Swers2016), although there is some indication that women candidates have to work harder than their male counterparts to raise those funds (Crespin and Deitz Reference Crespin and Deitz2010). Indeed, women consistently cite fundraising as a barrier, noting that they are disadvantaged by male-dominated social networks that help generate campaign contributions (Barber, Butler, and Preece Reference Barber, Butler and Preece2016; Lawless and Fox Reference Lawless and Fox2010). Women's PACs have helped circumvent this fundraising barrier by actively soliciting donations for viable women candidates early in the electoral process (Pimlott Reference Pimlott2010).
The limited research on contributors suggests much higher levels of gendered inequality than is evident in the literature on recipients. Administrative data reveal that women in the United States are a small proportion of all donors and contributions (as little as one-quarter) in federal elections (Burrell Reference Burrell2014; Thomsen and Swers Reference Thomsen and Swers2017); inferences derived from survey data similarly suggest that women donate less often and in smaller amounts than men (Francia et al. Reference Francia, Green, Herrnson, Powell and Wilcox2005; Grant and Rudolph Reference Grant and Rudolph2002; Verba, Schlozman, and Brady Reference Verba, Schlozman and Brady1995). However, the literature on contributors is mostly confined to the American context. To extend the literature on donors, we test six hypotheses.
To begin, if donations are perceived as just another form of political engagement, then even outside the United States, we should expect the basic correlates of political participation to exert the same influence on donations as they do for other forms of involvement. Here, the standard resource-based theories of political participation are persuasive, and gender differences in donations would reflect the unequal distribution of the resources associated with political participation. These differences are typically attributed to women's more limited socioeconomic resources, smaller political networks, and the fact that they are less likely to be asked to donate (Francia et al. Reference Francia, Green, Herrnson, Powell and Wilcox2005; Grant and Rudolph Reference Grant and Rudolph2002; Verba, Schlozman, and Brady Reference Verba, Schlozman and Brady1995). The absence of any gendered donor infrastructure in Canada, akin to the networks that exist in the United States, would only intensify these differences.
H1: Compared to men, women will donate less often and in smaller amounts.
Although we expect to find a persistent gender gap in donations, we hypothesize that women's donations in relation to men's have increased over time. Since 1993, women's economic position relative to men has improved, and although a wage gap persists, women's earnings make up a larger proportion of family income than ever before (Statistics Canada 2018). The proportion of women with university degrees has surpassed that of men over the past 25 years (Statistics Canada 2018), and women have increased their presence in professions that have long been associated with political involvement, including law and business (Catalyst 2018; Statistics Canada 2018). Moreover, between 1998 to 2018, the gender gap in wages decreased by 5.5 percentage points (Pelletier, Patterson, and Moyser Reference Pelletier, Patterson and Moyser2019), meaning that women are now better resourced to donate to political candidates. Beyond these material circumstances, when women look to the political arena, there is also evidence of narrowing gender gaps: since 1993, the proportion of women members of Parliament has increased from 18% to 26%, while the proportion of women candidates has gone from 22% to 29% (CBC News 2015; Sevi, Arel-Bundock, and Blais Reference Sevi, Arel-Bundock and Blais2018; Trimble and Arscott Reference Trimble and Arscott2003). The very presence of women as political role models has been shown to boost women's political participation (Campbell and Wolbrecht Reference Campbell and Wolbrecht2006); it is reasonable to assume that this positive effect could extend to prospective donors.
Changes in the political finance regime may have also shifted the donation landscape. Amendments introduced in 2003 tightened restrictions on corporate and union donations, and they are now prohibited entirely. Caps on the maximum amount that donors could contribute were also introduced (see Appendix A in the supplementary materials online for a detailed overview). These changes, as well as the termination of a publicly funded quarterly allowance to the major political parties, mean that parties and candidates now rely on a larger number of donations in smaller amounts. The precise effect of these shifts is unclear. At the macro level, parties may feel compelled to appeal to a broader donor base, which could include targeting more women. At the micro level, households may opt to make two smaller donations instead of a single large one, a behavioral change that might generate an increased number of donations from women.
H2: The gender gap in donations will decrease over time as women donate more.
In addition to examining how much money donors give, we look at gendered differences in the targeting of their donations. There is evidence that women are more often political outsiders, underrepresented in the occupations from which candidates typically emerge, and have less access to the professional networks that underpin political engagement (Barber, Butler, and Preece Reference Barber, Butler and Preece2016; Crespin and Deitz Reference Crespin and Deitz2010; Lawless and Fox Reference Lawless and Fox2010; Sanbonmatsu Reference Sanbonmatsu2006). Women are less embedded in nearly every aspect of local party life, confined largely to less visible “pink-collar” clerical tasks, and make up only about one-quarter of local party presidents (Bashevkin Reference Bashevkin1993; Cheng and Tavits Reference Cheng and Tavits2011). Because of this and because the majority of electoral candidates are still men, local candidate outreach remains male dominated. This sort of gender skew is also evident in the infrastructure of the central party organization, in which men hold many of the key positions, but, in contrast to local donor appeals that may center personal relationships and connections, national party appeals are typically based on platform promises. These are increasingly targeted to narrow segments of the voting population, including a number that explicitly seek the “women's vote” (Goodyear-Grant Reference Goodyear-Grant, Bittner and Koop2013). As a result, we expect more of women's donations to go to the national party than to local candidates, especially in the Canadian context, which is more party-centric and lacks the gendered donor networks that help direct women's donations to women candidates.
H3: A higher proportion of women donors’ contributions will go to the national party than to local candidates.
Of course, donors may view political contributions as a way of showing solidarity with a particular candidate (Besco and Tolley Reference Besco and Tolley2020). This expectation builds on the literature on affinity effects in voting, which suggests that voters are more likely to support candidates whose demographic backgrounds mirror their own (Besco Reference Besco2015; Dabin, Daoust, and Papillon Reference Dabin, Daoust and Papillon2018; Goodyear-Grant and Tolley Reference Goodyear-Grant and Tolley2019, McConnaughy et al. Reference McConnaughy, White, Leal and Casellas2010; McDermott Reference McDermott1998; Philpot and Walton Reference Philpot and Walton2007). In the United States, evidence of gender affinity effects in voting is somewhat mixed and moderated by partisan identification (Campbell and Heath Reference Campbell and Heath2017; Dolan Reference Dolan2008; Fulton Reference Fulton2014).
When it comes to gender affinity in donations, the literature is again suggestive but not conclusive, and partisan identification appears to be an important moderator. One study of congressional fundraising finds that among Democrats, women donors give more to women candidates, and men give more to men, but there is no evidence of gender affinity among Republicans (Thomsen and Swers Reference Thomsen and Swers2017). Meanwhile, a study of close state legislative races finds that male donors are more generous to male legislators, while women donors give equally regardless of the legislator's gender (Barber, Butler, and Preece Reference Barber, Butler and Preece2016). Women's PACs—which lean Democratic more than Republican—are a key source of support for women candidates in the United States and are a presumed driver of gender affinity effects among donors (Thomsen and Swers Reference Thomsen and Swers2017). In other contexts, and especially those without a formalized infrastructure of gendered donor networks, do women donors still support women?
In Canada, there is little evidence of gender affinity in voting, but this null finding probably reflects the predominance of partisan affiliation as the basis for vote choice, rather than being an indicator of women's nonpreference for women candidates (Bird et al. Reference Bird, Jackson, Michael McGregor, Moore and Stephenson2016; Goodyear-Grant and Croskill Reference Goodyear-Grant and Croskill2011; Goodyear-Grant and Tolley Reference Goodyear-Grant and Tolley2019). Therefore, we expect donors to behave somewhat differently than voters. One basis for this expectation is that the characteristics of voters and donors differ. For example, although voters must be citizens, donors need only be residents of Canada; this could allow candidates to draw on additional bases of support. Donors may also be more politically interested, knowledgeable, or partisan, and therefore they may be more motivated to target their donations in ways that extend beyond partisan affiliation. Strategic giving is possible because donations are not an entirely fixed resource. Although electors have but a single vote, donors can support more than one candidate so long as the total amount of their donations is under the legislated maximum. Donations can therefore be distributed at different times in the campaign, and to more than one candidate or party. Moreover, whereas voters’ options are restricted to the candidates running in their own electoral district, donors can give to any candidate. As a result, women donors may use their donations as a way of supporting women candidates, whether for symbolic reasons (e.g., “girl power”) or because the candidate's gender serves as a heuristic for inferring policy preferences. As an expression of this affinity, women donors may even choose to support women candidates outside their own district.
H4: The proportion of donations to women candidates from women donors will be higher than the proportion of donations to male candidates from women donors.
Donors may also be motivated by partisanship or by a set of policy preferences (Francia et al. Reference Francia, Green, Herrnson, Powell and Wilcox2003), and these considerations may themselves be gendered. For example, most research shows that women prefer parties on the left and those that champion social issues (Erickson and O'Neill Reference Erickson and O'Neill2002; Thomsen and Swers Reference Thomsen and Swers2017). Consequently, we expect women donors to give more to the New Democratic Party (NDP) and its candidates, which are more left-leaning than the other mainstream parties.
H5: Women will donate more money and more often to parties and candidates on the left than to parties and candidates on the right.
Finally, consistent with the American research, we expect partisanship to condition gender affinity (Thomsen and Swers Reference Thomsen and Swers2017). This is because perceptions of group identity and norms are different on the right and the left: in parties on the left, women candidates are rewarded, but on the right, they may be punished because their political presence conflicts with traditional gender stereotypes or an antifeminist policy stance (King and Matland Reference King and Matland2003; Klar Reference Klar2018). Although there is no research of this kind on gender in Canada, this dynamic does occur for nonwhite candidates (Besco Reference Besco2018). More generally, if the cause of these effects is feminist identity rather than one's identity as a woman (Huddy and Willmann Reference Huddy and Willmann2017), these effects are likely to be stronger on the left than on the right. We thus expect women donors’ affinity for women candidates to be especially high when we look at donations to the NDP, but Conservative women donors will exhibit much less affinity for women candidates.
H6: The gender affinity effect will be larger for candidates from left-leaning parties than for candidates from right-leaning parties.
DATA AND MEASURES
To track donations, we use the administrative records that parties and candidates are required to provide to Elections Canada, which is the agency responsible for administering federal elections in Canada. Each record includes the amount of the donation, the name of the donor (and, after 2004, their postal code), the political entity to which the donation was directed (e.g., party, candidate, local constituency association), and the date of the donation. The data are provided in multiple files, and the format is not standardized.Footnote 2 Party names are listed in different ways (e.g., Liberals, Liberal Party), and the presentation of donor names and formatting of district names are inconsistent across files. The data were cleaned, harmonized, and merged into a single file of donations from 1993 to 2018. We restrict our analysis to major parties (Liberal, New Democrat, Bloc Québécois, and Conservative, as well as its predecessors, the Progressive Conservatives, Canadian Alliance, and Reform Party). We include any donation to the party itself, to a candidate running for that party, or to any of the party's local constituency associations. In total, there are approximately five million observations.
Legal requirements for disclosing donations changed during the period under study, and not all information is available for all donations across all years. For example, in earlier records, the donation date is recorded in terms of the day on which it was reported to Elections Canada (often by quarter or year), while the later records report the precise date on which the donation was made. For consistency, we use the year of donation in all analyses. Further, the database includes donations to nomination contestants and leadership candidates, but we exclude these because they were only recorded after 2003.Footnote 3
Since corporations, unions, and other third-party organizations have been prohibited from making political donations since 2004, we only include donations from individuals in our analyses. The donation limits have also changed, such as the reduction from $5,000 to $1,000 in 2006 and then the increase to $1,500 in 2015 (see Appendix A for a detailed overview of these changes). These changes do not seem to have substantive effects on our analysis, likely because the vast majority of donations are under the limits (see Appendix B), so we use the whole range of data. Although political entities are only required to disclose donations in excess of $100, many smaller donations are reported with no apparent pattern. We thus include donations of all amounts in the analysis.
Since we do not have exact addresses for any donors and therefore cannot say with certainty whether donors with the same names are the same donor, we analyze donations, not unique donors. The need to use the donation, rather than the donor, as the unit of analysis does limit the analysis in some respects. Some donors donate many times, either to the same party or candidate, or to multiple recipients, often from different parties. We have no way of aggregating these donations to understand the pattern or motivation behind such a strategy, which may or may not be gendered. Moreover, descriptive statistics, such as those on the “average donation,” conceal disparities between those donors who make a few moderately sized donations, those who make a single large donation, or those who make several small donations including ones that are well below the threshold for reporting. However, without exact addresses, it is impossible to overcome these limitations (Giraud-Carrier et al. Reference Giraud-Carrier, Goodliffe, Jones and Cueva2015). That said, in more recent years, the records do include postal codes (although not exact addresses), so we replicate some key analyses using name/postal code/year combinations as a pseudo-unique identifier. This method is imperfect since the population of inhabitants in a single postal code can still be quite large, but even with that caveat, there is little change in results (see Appendix B).
We combine the donations data with candidate and electoral data from federal elections held between 1993 and 2015, thus incorporating some 9,000 major-party candidates who ran for office in the period under study. This part of the data set provides the gender of all candidates, their incumbency status, ministerial positions, and electoral results (namely, whether they were elected or defeated). Because there are variations in the reporting of candidate names in the donations data set and candidate data set (e.g., nicknames, initials, misspellings), not all candidate names were automatically matched, but combined with manual methods, we were able to resolve most of these cases and thus matched 94% of candidate donations in the donation data set to the candidates in the candidate data set.
The gender of candidates is derived from an existing data set (for details, see Sevi, Arel-Bundock, and Blais Reference Sevi, Arel-Bundock and Blais2018).Footnote 4 The gender of donors, meanwhile, is inferred using the genderizeR package (Wais Reference Wais2016). GenderizeR is based on the genderize.io API, which is a web scraping tool (https://genderize.io). The API extracts social media user profiles that include both the user's name and gender and generates a probabilistic estimate that a given name belongs to a man or woman. The API has been used in a range of applications (https://store.genderize.io/usecases), including several scholarly papers (Dion, Sumner, and Mitchell Reference Dion, Sumner and Mitchell2018; Fell and König Reference Fell and König2016; Gardiner Reference Gardiner2018). We used genderizeR to analyze donors’ first names. For each name, it provides a likely gender and probability score, which is expressed as a percentage (i.e., of certainty). Some names are ambiguously gendered and return lower probability scores, while many names (e.g., John, Susan) return probability scores of 100%. We only used names with probability scores of 90% or higher; those that fell below this threshold are coded as missing data. Even this relatively high bar leaves 87% of the donors on the list.Footnote 5
As a check on this automated coding procedure, we drew a sample of 15,000 donor names from donations to candidates in the 2015 election. These were manually coded by research assistants who were trained to deduce gender using name analysis and genealogical methods. We then calculated an intercoder reliability statistic for the manual and automated coding procedures using Krippendorff's alpha, a measure of reliability that adjusts for agreement based on chance. When we compare results from the two coding procedures, Krippendorff's alpha 0.87, which exceeds conventionally accepted standards of reliability (Krippendorff Reference Krippendorff2004). We thus have confidence in the reliability and validity of the automated coding.
ANALYSIS
Number and Size of Donations
We first examine the ratio of women to men donors by year. We expect that women will donate less often than men but that the percentage of women will rise over time. Since the total number of donations varies widely from year to year, we focus on the relative number of donations by gender, which is operationalized as the probability that a given donor is a man or a woman.
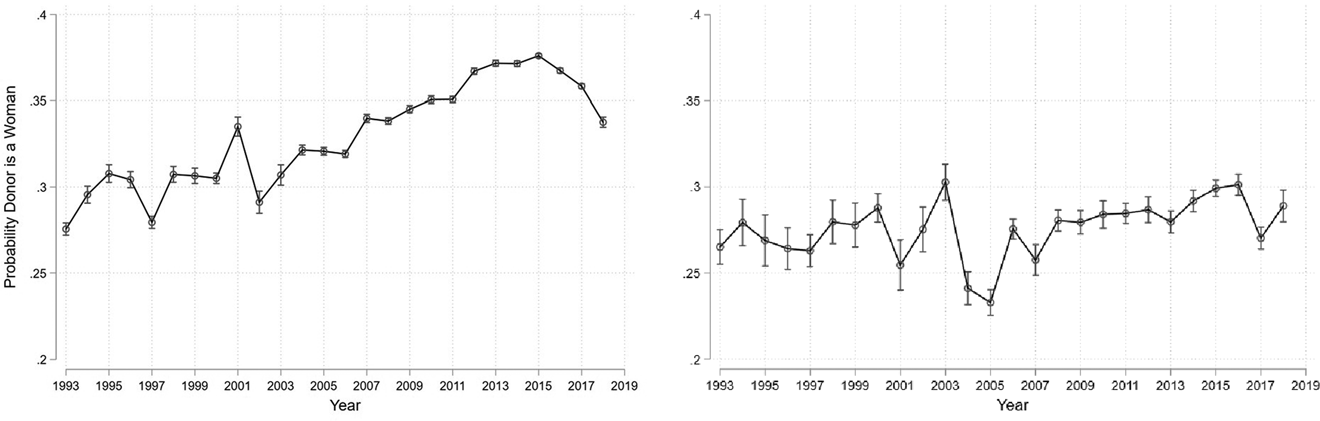
Figure 1 shows the proportion of donations by men to women for each year. For ease of figure construction and to generate confidence intervals, we use a logistic regression model with the gender of the donor as the dependent variable and the year of the donation as the independent variable (as a set of dummies rather than a continuous variable). The predicted values are then equivalent to the proportion: for example, in 1993, the probability of a donation being from a woman is .27, and the percentage of donations from women is 27%. The left side of Figure 1 shows the results for all donations, the right for large donations only ($500+).Footnote 6 Given the size of our sample, most of the coefficients reach statistical significance (Lin, Lucas, and Shmueli Reference Lin, Lucas and Shmueli2013), so we concentrate instead on the magnitude of the effect. Recall that our data capture all contributions to national parties, local party organizations, and candidates, and the figure shows the proportion of donors that are women in each year.
Donor gender. Predicted probabilities shown, for the ratio of men to women. Left panel is all donations (n = 4,455,928), and right panel is large donations only ($500+, n = 332,691).

Across the 25 years under study, roughly two-thirds of donations came from men and one-third from women. There is a slight trend toward an increasing proportion of women donors over time. In 1993, 27% of donors were women; the highest peak was in 2016, when 38% of donors were women. This is a substantial increase of 11 percentage points, but then there was a subsequent drop, with 34% of donations coming from women in 2018. Clearly, despite some growth in the proportion of donors that are women, there is still a very large gender disparity.
For large donations, the results are even more striking: there is no meaningful increase of donations by women at all. Although women make up a growing proportion of donors over the 25-year period we examine, this growth is clearly concentrated among smaller donors. Despite some fluctuations over time, the gender composition of the large donor class barely budged between 1993 and 2018. Figure 1 shows that in 1993, 27% of large donations were from women. Twenty-five years later, that proportion remained largely unchanged at 28%.
There is little evidence that the increase in women donors was a direct response to changes in the political finance regime. Donation limits came into effect in 2004, going from a previous policy of no limits and then increasing to the current ceiling of $1,500 per donor. This policy change might level the donation playing field, and it could also contribute to more donations in women's names. This is because households, who may have previously made a large single donation in the man's name, could respond to the changes by making two smaller donations, one in the name of the male head of the household and one in the name of the female head of the household. The effect of this adjustment would be to increase the number of donations from women donors. Instead, we find there are some small increases in the proportion of women's donors around 2003–04, but this is no larger than increases during many other periods, and much smaller than the general increase in women donors over the time period.
If regulatory changes to donation limits did have an effect on donor behavior in terms of partner donations, the effect was substantively small or blunted by other considerations. For example, because donations to political entities are tax deductible, it is possible that even prior to 2004, households wanting to maximize that advantage were already dividing their contributions between spouses. New donation limits would likely not alter that strategy. In addition, the most stringent donation limit of $1,000 came into effect in 2007, but even prior to that, the vast majority of donations (94%) were less than $1,000, so only a relatively small number of donors would be likely to operationalize this household strategy.
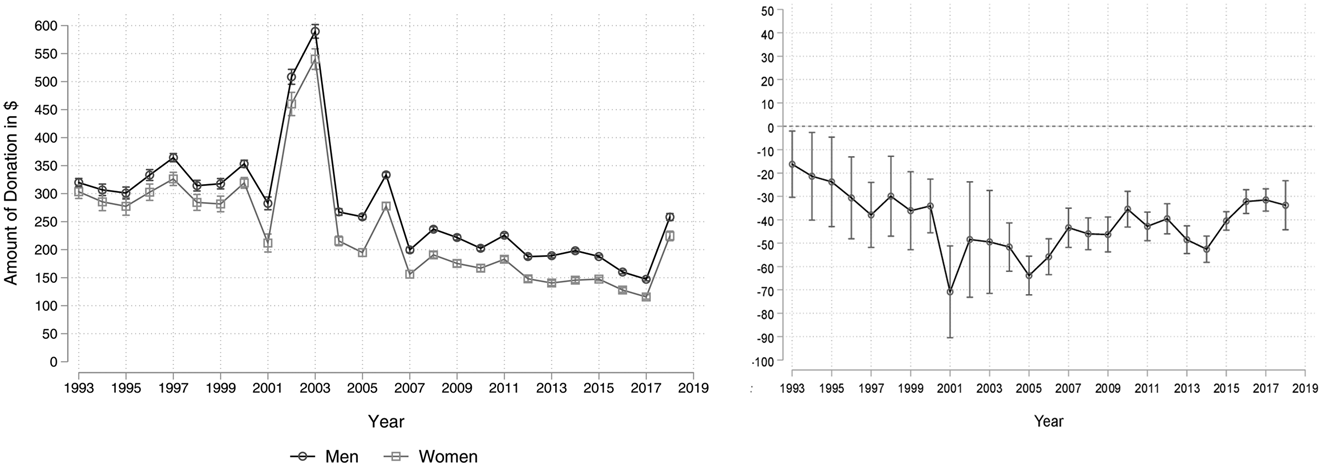
The amount of donations is examined in Figure 2. We expect that women will donate in smaller amounts than men, but that this difference will shrink over time. This model uses ordinary least squares regression, and the dependent variable is the amount of monetary donations in dollars. Gender of the donor is the main independent variable, as well as year of donations, and an interaction term between the two. Figure 2 shows the predicted values for the size of donations, by gender and year: the left panel shows the mean amount for men and for women, and the right panel the difference between the two. In all periods, men donate more than women, and the difference is statistically significant in all years. On average, donations from men are $48 more than those for women across the whole time period, which is a considerable amount given the mean donation size is $204. Notably, there is a large increase in the size of donations for both men and women in 2002–03, around the time that new donation limits were being discussed in Parliament; these came into effect in 2004. However, the relative amount of donations by men and women changes very little over the entire 25-year time period. Interestingly, the time period where the size of men's and women's donations are most equal is the early 1990s, prior to the introduction of smaller donation limits. This finding runs counter to arguments that donation limits favor more equal participation.
Amount of donations by gender and difference between men and women. Amount of donations in dollars. Left panel shows mean amounts for men and women. Right panel shows difference between men and women, with lower values meaning donations by women are smaller. n = 4,455,928.

This period of donor gender equality immediately preceded Kim Campbell's tenure as Canada's first (and only) woman prime minister. Although somewhat speculative since there are no donations data available prior to Campbell's selection at prime minister in 1992, it is possible that her presence in the country's highest executive motivated women donors, and her departure (and subsequent lack of women prime ministers since) has eroded that effect. In the United States, in 2016, the bulk of individual donations to Hillary Clinton (52%) came from women; in the modern landscape of mandatory reporting of financial contributions, this is the first major-party presidential campaign to achieve this milestone (Bryner and Weber Reference Bryner and Weber2018). Fundraising reports generated in November 2019, when most Democratic presidential candidates remained in the race, show that four candidates—Elizabeth Warren, Kamala Harris, Beto O'Rourke, and Julian Castro—received a majority of their individual donations from women donors, suggesting that the Hillary effect on women's donor participation perhaps had some longevity (Haley Reference Haley2019).
Donations by men are larger for all parties, but the gender gap is the largest for the Liberals, where men's donations outpace those of women by a larger margin than in the other parties. It is considerably smaller for the NDP (see Appendix B). This differential seems to be because the NDP received fewer large donations in general, and it is in the large donation category that the gender gap is most pronounced.
Partisan Differences in Donation Patterns
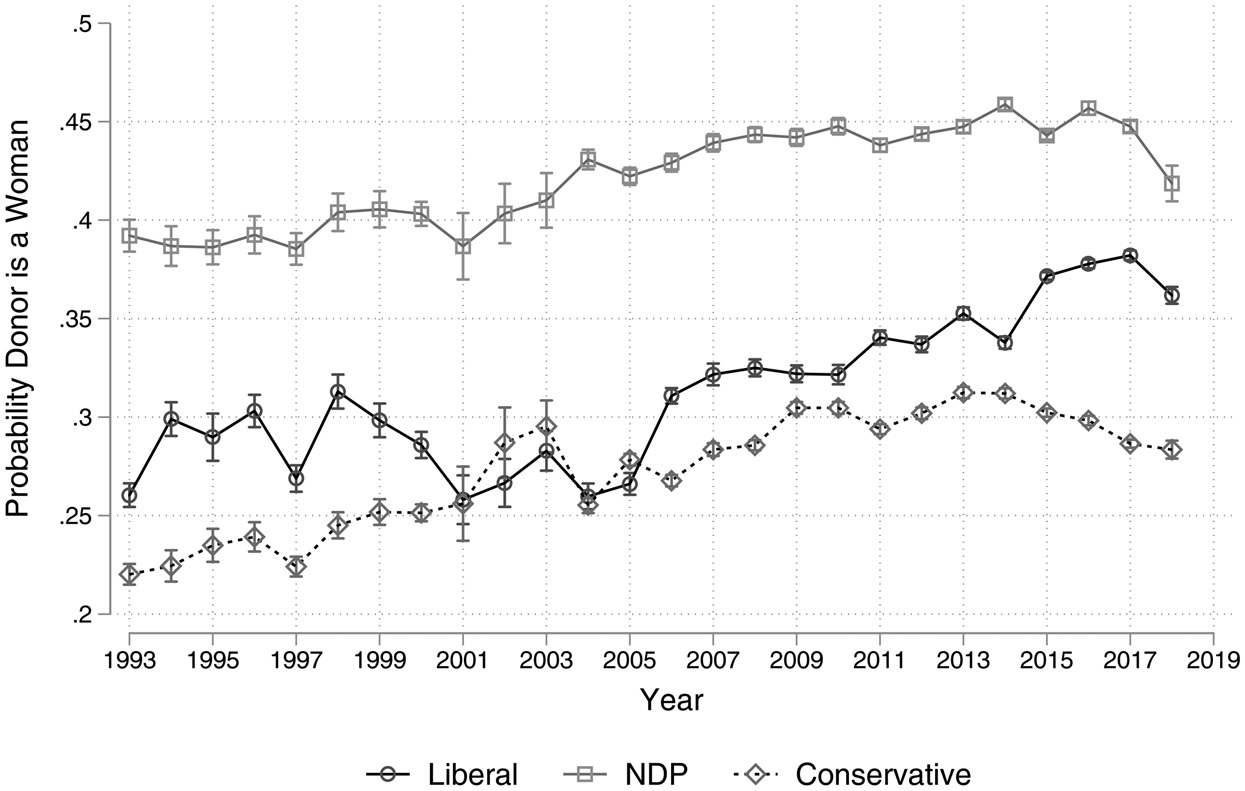
Next, we examine results by party. We expect parties on the left will receive higher numbers of donations from women than parties on the right. We use the same model as in Figure 1, but with an additional variable for the receiving party (or the party of the receiving candidate) and an interaction with year. Figure 3 depicts the proportion of women by party and year. The NDP does indeed get a greater percentage of its donations from women: overall, 43% of NDP donors are women, compared to 35% of Liberals and 29% of Conservative donors (here the Conservative Party of Canada, Reform Party, Canadian Alliance, and Progressive Conservatives are merged).Footnote 7 In 2015, Justin Trudeau, the leader of the Liberal Party, ran on a feminist platform, proposing a number of pro-women policies, including a promise to appoint a gender-balanced cabinet. When we look at donations data, these gendered appeals do seem to have had an effect. By a substantial margin, the smallest gender gap in the Liberal Party's donations is after his government won a majority in 2015. The NDP saw a sharp drop in its proportion of women donors in 2018 and had its lowest proportion of women donors in 15 years. Nonetheless, the NDP still maintains its advantage among women, as it has over the entire 25 years covered in our analysis.
Gender of donors by party. Predicted probabilities shown. n = 4,425,748.

Gendered Targeting of Donations
We hypothesized there may be gendered differences in the targeting of donations, with women giving more to the party than to candidates given that they are less embedded in the local networks that underpin contributions to candidates. To assess this, we employ the model used earlier to examine the proportion of women donors across the three categories: candidates, local party associations, and national parties. We add election type (i.e., election years when there is considerable attention to politics, compared to nonelection years when there is less) as an independent variable, interacted with donation gender, to rule out explanations based on political interest. If gendered donation patterns persist during and outside elections, this would suggest women's propensity to give to the national party is not simply a function of increased attention to parties during the campaign period.
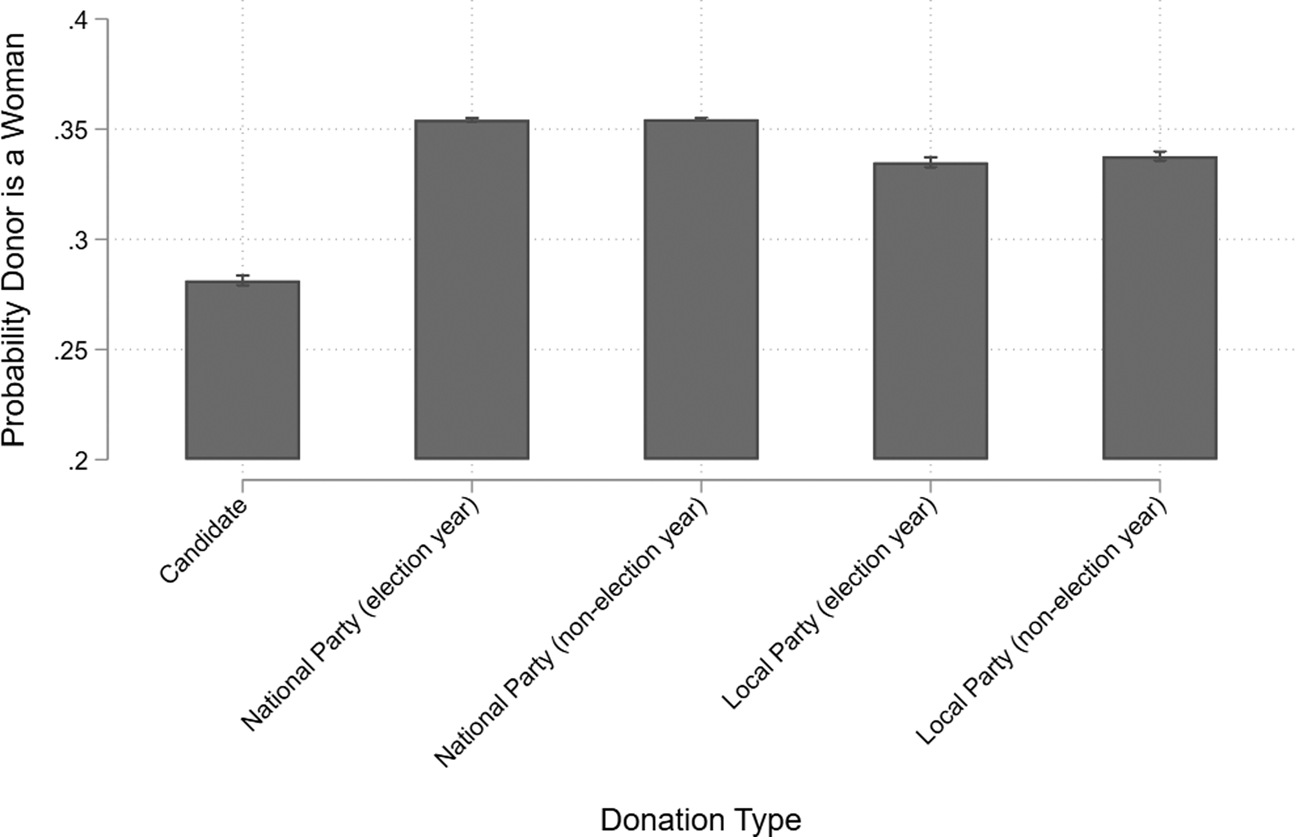
As Figure 4 shows, donations to candidates are 7 percentage points less likely to come from women donors, relative to donations to the national party. Women are also less likely to donate to the local party association than the national party, although the difference (1.4 percentage points) is not nearly as large as that related to candidates. Informal gendered networks could be driving this pattern. The network of local political activists and power brokers is male dominated. Moreover, candidates, most of whom are men, focus considerable donor outreach on electors whom they know either socially or professionally; these homophilous networks are often skewed to the candidates’ own gender.
Gender of donors by donation type. Predicted probabilities shown. n = 4,455,918.

Parties can appeal to a wider swath of donors, and this strategy may encourage more donations from women. Because there is almost no difference in women's donations to parties between election and nonelection years, we do not think that women donate more to parties simply because parties receive more attention during electoral campaigns. Moreover, since women also donate more to local party organizations than to local candidates, it is difficult to conclude that women are simply less involved in on-the-ground politics. If that were the case, the gender gaps in donations to candidates and to local party associations would be very similar. Rather, there appears to be something specific to candidates that makes women donors less likely to give to them.
Gender Affinity in Donor Patterns
Do women donate more to women candidates? The evidence from the voter affinity literature suggests the answer may be no because, in Canada, women do not generally vote for women candidates at higher rates than men (Goodyear-Grant and Croskill Reference Goodyear-Grant and Croskill2011; Goodyear-Grant and Tolley Reference Goodyear-Grant and Tolley2019), but those patterns may not apply to donors where we expect to find gender affinity. To test this, we look at donations to candidates. One-quarter of candidates are women, and one-quarter of donations are directed to women candidates. However, 23% of donations from men go to women candidates, while 29% of donations from women go to women candidates. Although male donors show some preference for male candidates, the preference of women donors for women candidates is actually stronger. That said, this relationship might not be a direct effect of candidate gender, but rather reflect other advantages male candidates wield, including incumbency and cabinet experience. Therefore, we estimate a multivariate model.
As before, we use a logistic regression model with the gender of the donor as the dependent variable. The key independent variables are the gender of the receiving candidate, year, and an interaction term between the two. In addition, we include control variables for features that are likely to be correlated both with candidate gender and donations: ministerial status, incumbency, percentage of votes received, if the candidate won the election, and party. The figures that follow show predicted probabilities with these control variables set to their means (see detailed model results in Appendix A).
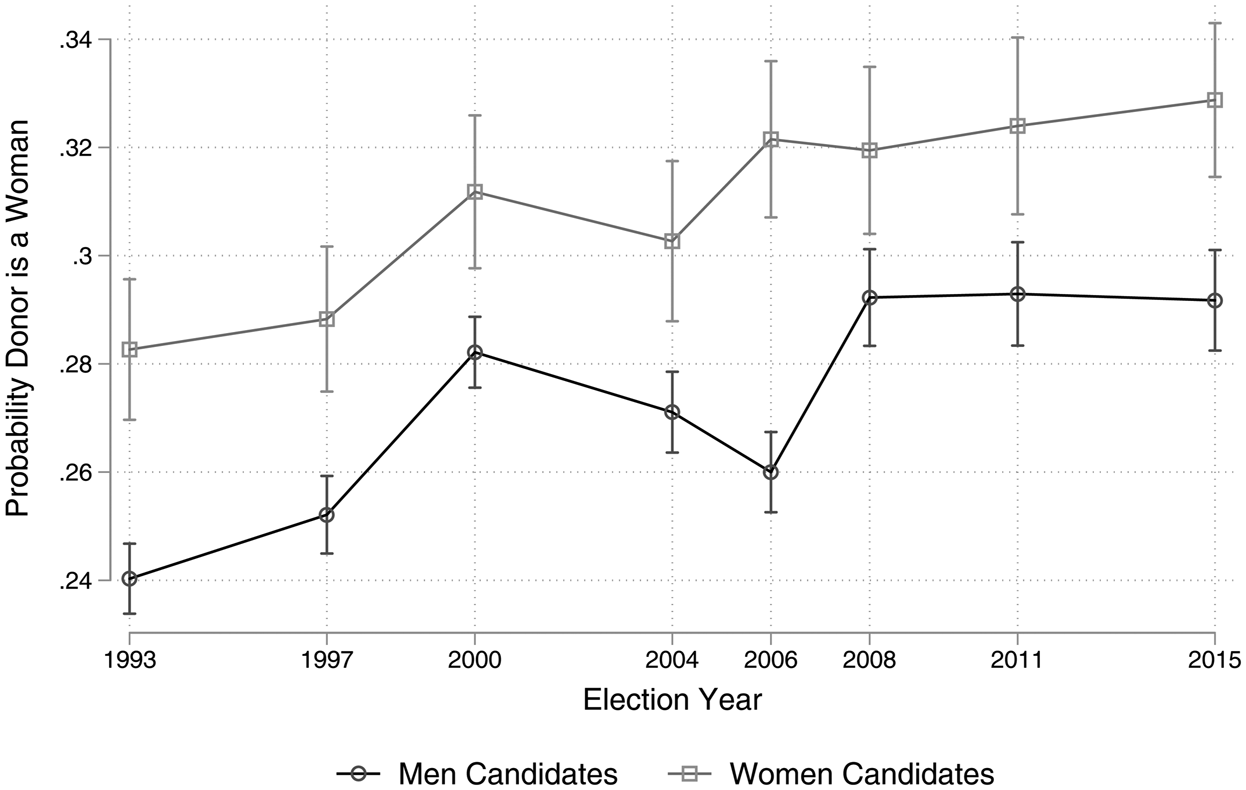
The first gender affinity model uses logistic regression, with the gender of the donor as the dependent variable, and the gender of the candidate as the main independent variable. As Figure 5 shows, there is a relationship between candidate and donor gender: compared to their male counterparts, women candidates receive a greater proportion of their donations from women donors. For example, in 2015, women candidates received 33% of their donations from women, while male candidates received 29% of their donations from women. The size of this effect is quite consistent over time: roughly 5% over the 25 years under study. Of course, since men are more likely to donate, women candidates still receive more donations from men than from women, but the gender affinity effect is clear: when women donate, they direct those contributions toward women candidates more so than to male candidates. This is in contrast to the null effects observed in research on gender affinities in vote choice.
Gender affinity by election year. The gender affinity effect is the difference between men and women. Predicted probabilities shown. n = 140,489.

There is some evidence that this result varies for donations to candidates in the district and outside the district. To test this, we use the Statistics Canada postal code conversion file to link donor postal codes to electoral districts and then compare donor and candidate electoral districts. This method leads to a loss of 27% of all cases, so the results should be interpreted with some caution, but they are nonetheless instructive.Footnote 8 Using a model similar to that used earlier, but with an interaction for the in/out-of-district variable, gender affinity appears stronger for donations to candidates outside the donor's own district and weaker for donations to local candidates. That is, for donations to candidates in the same district as the donor, 31% of donations to women candidates are from women, and 28% of donations to men candidates are from women: a difference of 3 percentage points. For donations to candidates outside their district, the gender affinity effect is more than double the size, at 7 percentage points (see Appendix B for details, figure not shown).
Finally, is gender affinity conditional on party? Again, we use a logistic regression model with gender of the donor as the dependent variable, but this time, we interact the gender of the candidate with their party instead of using party as a control. Election year is not included in this model because there are not enough candidates to produce reliable estimates of a three-way interaction (candidate gender/party/year). The same control variables are included: ministerial status, incumbency, percentage of votes received, and if the candidate won the election.
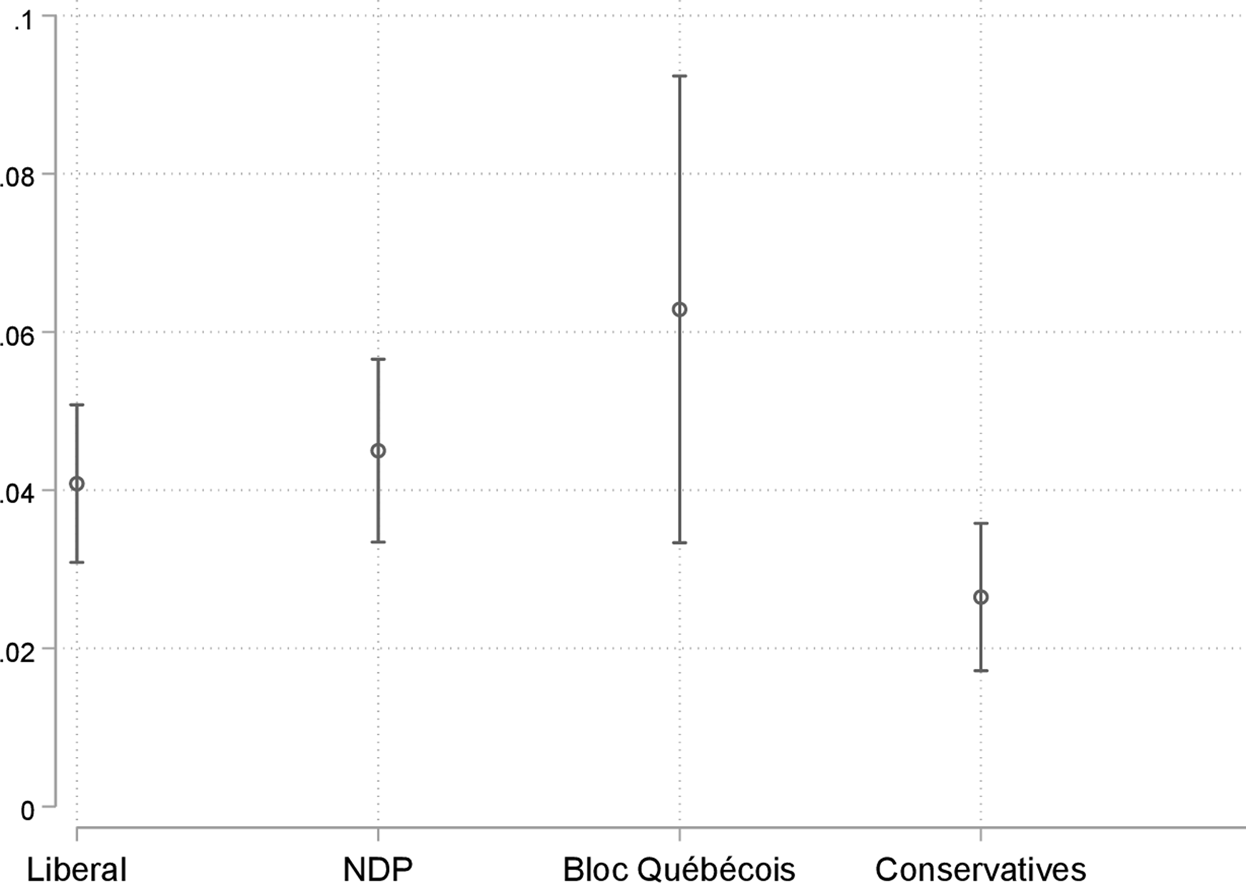
Figure 6 shows the predicted probabilities of gender affinity for each party. The results are partly in line with our expectations. There are gender affinity effects for Liberal, NDP, and Bloc Québécois candidates; there are approximately 5% more donations from women donors to women candidates than there are for men. While the Bloc Québécois has the largest point estimate, it also has large confidence intervals due to the substantially smaller number of donations (and a smaller number of candidates). As expected, there is a smaller gender affinity effect for Conservative candidates. However, NDP donors do not exhibit an especially high level of gender affinity, which is somewhat surprising given that NDP donors are disproportionately women.
Gender affinity by party. Predicted values shown: the difference in proportion of donations from women and men, between men and women candidates. n = 140,489.

CONCLUSION
We find a large and persistent gender gap in donor behavior over the past 25 years. In this period, some two-thirds of donors to federal candidates and parties are men, and only one-third are women. The percentage of women donors rose from 27% in 1993 to a high of 38% in 2015, but there is still a very large gender disparity, and it has been durable. Women remain in the minority as political donors despite their increased entry into the workforce, higher numbers of women in politics, a general push to court the “women's vote,” and the adoption of regulations intended to reduce the influence of money in politics and level the proverbial playing field.
Although there is little evidence of a short-term direct effect between donation limits and women donors, they do seem to have shifted the landscape toward smaller donations. It is difficult to isolate such an effect because there were several changes over this period, including the development of internet technologies that made small donations much easier. Nonetheless, because women are more likely to give in small amounts, legislative changes may have indirectly helped increase the proportion of women donors.
We find clear evidence that women candidates attract a greater percentage of women donors than their male competitors. These findings are consistent with donor evidence from the United States but run counter to Canadian research on gender affinity in vote choice. Whereas women are no more likely than men to vote for women candidates, women donors tend to support women candidates. Although the size of the difference is modest, it has been relatively constant over time and similar across parties, although smaller for Conservative candidates. This means that the very donors who are most likely to give to women candidates—women—give less money and less often. Were more women to run, the gender gap in donations might shift, and women's electoral prospects might also improve. We posited we would see gender affinity among donors and candidates because of differences between donating and voting, and that expectation holds. It is also noteworthy that we observe gender affinity effects among women donors in Canada even though there is a much less formalized set of gendered donor networks than in the United States. This finding suggests the affinity effect may be a reflection of individual rather than institutional factors.
Of course, the difference between voter and donor gender affinity patterns may be a function of our research design. Although most research on gender affinity relies on experimental or observational data, often with smaller sample sizes, we use a large data set of administrative data that captures donors’ actual behavior and therefore may be isolating small but potentially important effects that could be missed in other research designs. At the very least, our research suggests that gendered patterns of political participation can differ depending on the activity being examined; although women appear willing to support other women financially, when it is time to cast their ballot, those gender affinity effects disappear, and this could directly affect women candidates’ prospects.
There is also some evidence this gender affinity effect is larger for donations to candidates outside donors’ own districts, and smaller for donations to candidates in one's own district. If we think of donating to candidates in other districts as a kind of “national” rather than local action, this result mirrors our finding that women are more likely to donate to parties than to candidates, again suggesting there may be gender differences with respect to scale. One reason for higher levels of gender affinity in out-of-district donations may be that in some districts, there is not a single woman candidate, a fact that constrains in-district donors from contributing to women; however, no such limitation applies to donations outside their own district. If this is the case, the larger out-of-district effect might be a better estimate of the desire to donate to a woman candidate.
There are also clear partisan disparities in women's donation behavior: the NDP has the smallest gender gap in terms of the number of donations by men and women, and it has maintained this for the entire quarter century covered by this data. The gender gap in the size of donations is also smaller for the NDP than other parties, but compared to women donors in other parties, women donors in the NDP are only slightly more likely to give money to women candidates. This result is somewhat surprising, given NDP supporters are generally viewed as more feminist and the NDP party as a whole has by far the highest percentage of donations by women. Although the Liberals have a higher proportion of women donors than the Conservatives, this has varied widely. At times, the difference has been negligible, but since 2015, there has been a substantial increase in the proportion of women donors to the Liberals. This finding suggests that women donors may have responded positively to the Liberal Party's feminist policy stance, which was most apparent in the 2015 election.
Women are more likely to donate to the national party and less so to local candidates. In some respects, this finding is counterintuitive. Conventional wisdom might suggest that women's donations would be driven by friendships or a sense of personal connection. We find the opposite and speculate this might be a reflection of the strategies that candidates use to encourage donations. Local candidates are more likely than the national party to rely on personal networks as a source of donor support; these networks may be somewhat homogenous and reflect the types of people who tend to run for office. Even now, the profile of the political candidate is overwhelmingly male, and this might have implications for donor networks. An alternative explanation is that women are less likely than men to know who their local candidate is; as a result, when they donate, they do so to their preferred party, rather than to an individual candidate. However, given that donors are among the most politically informed and because we find little difference in women donors’ behavior in election and nonelection years (suggesting that they are tuned into politics even outside of the campaign period), we find the latter explanation less persuasive than explanations that center gendered networks and appeals.
There is also no clear evidence that changes to contribution limits have had a substantial effect on the gender gap in donations. We suspect this is largely because the vast majority of donations are smaller than even the lowest of these imposed donation ceilings, so any effect applies to a tiny percentage of donors. However, two possibilities merit further examination. First, even a small number of large donors could wield considerable influence particularly since their contributions are more noticeable—and possibly effectual—than a large number of small donations. Knowing more about donor influence and precisely how it operates would help us to untangle the effect of large and small donations. Second, the lowering of donation limits could motivate parties to pursue a longer-term, more general shift toward small donors, who are more likely to be women, a trend that would reduce the gender gap in donations. Our results are suggestive and although they do not allow us to rule out other explanations, it is worth looking further at the link between campaign finance regulations, party strategy, and donor behavior.
Our analysis also points to a number of fruitful avenues for further research. These include questions related to donor motivations but also applications beyond electoral candidates. Although there have only been a small number of women leadership candidates in the major parties and most have been longshots, this method could be used to understand the behavior of women donors to leadership candidates in a broad sense, with comparisons across parties or on the basis of the candidates’ policy promises, for example. At present, there is no systematic tracking of nomination contestants’ gender or other characteristics in Canada, but there is evidence from the United States that gendered donation gaps may be even larger at the nomination stage (Kitchens and Swers Reference Kitchens and Swers2016). Those differences may be a reflection of the emphasis that gendered donor networks put on raising early money for women candidates, which could help to encourage women's donations to women contestants early on in a way that might not happen in Canada. Future research should examine this.
The postal code of donors could also be leveraged to make additional inferences about the characteristics of donors, by matching neighborhood-level census data about income, education, occupation, and other features. Finally, there is an opportunity to look at gendered patterns in donations to incumbents, eventual winners, and out-of-district donations to “star” candidates to understand who is most and least likely to support long-shot candidates. The basis for these decisions will help us unpack the strategic and symbolic mechanisms that underpin donor behavior.
By reporting on political contributions made to parties and candidates over the last 25 years, our study provides an important foundation for future work. We not only identify a large and persistent gender gap in political donations, but also provide evidence that gender affinity among women donors is not simply a function of the gendered donor groups that characterize U.S. politics. We show that networks matter in other ways and likely influence whether, to whom, and how much women donate, a finding that sheds new light on women's political participation and electoral representation.
SUPPLEMENTARY MATERIAL
To view supplementary material for this article, please visit https://doi.org/10.1017/S1743923X20000276