Introduction
Many auxological surveys have shown that the growth and maturation pattern of children is modified by changes in their physical environmental and socioeconomic conditions (Tanner, Reference Tanner1962, 1982, Reference Tanner1992; Bielicki & Welon, Reference Bielicki and Welon1982; Eveleth & Tanner, Reference Eveleth and Tanner1990; Bodzsar, Reference Bodzsar1998; Bodzsar & Susanne, Reference Bodzsar and Susanne1998; Ellis, Reference Ellis2004; Bodzsar, Reference Bodzsar2006; Gluckman & Hanson, Reference Gluckman and Hanson2006). Poor growth and development is associated with inadequate food (both quality and quantity) and disease, as well as the absence of stress-inducing conditions (Cole, Reference Cole2003; Bodzsar, Reference Bodzsar2006; Koca Ozer, Reference Koca Ozer2007; Cardoso & Caninas, Reference Cardoso and Caninas2010; Hatton & Bray, Reference Hatton and Bray2010; Maria-Dolores & Martinez-Carrion, Reference Maria-Dolores and Martinez-Carrion2011; Bielicki et al., Reference Bielicki, Haasa and Hulanicka2012).
There is no doubt that the socioeconomic conditions within Hungary have changed significantly over the last 100 years. Until World War I Hungary was primarily an agrarian component of the Austro-Hungarian Empire with considerable ethnic diversity. Post World War I industrialization increased, albeit slowly, and the period up to World War II was characterized by a poorly paid industrial workforce. After World War II there was a considerable reduction in land mass as well as significant population mobility. Consequently, in interpreting the differences between growth and developmental patterns before and after World War II the important changes to the composition of the Hungarian population should be recognized together with the changes in socioeconomic conditions (Berend & Ranki, Reference Berend and Ranki1985; Kollega Tarsoly, Reference Kollega Tarsoly1997).
Industrialization and urbanization became much more intense between the 1950s and 1970s with an absolute loss in size of rural populations. Since the end of the 1970s nearly 60% of the country’s inhabitants live in towns or cities. In the 1970s there was a gradual improvement in public hygiene and medical care and basic education became compulsory up to 16 years of age for all; so this period is generally viewed as a period of improved living conditions (Berend & Ranki, Reference Berend and Ranki1985; Berend, Reference Berend1990; Marki-Zay, Reference Marki-Zay2005).
Together with most of the former socialist countries in Eastern and Central Europe, Hungary experienced a rapidly changing political, social and economic environment at the beginning of the 1990s. There was an abrupt shift from the totalitarian social order, with inhibited social mobility and stratification, centrally planned economy, the restriction on individual rights and an underdeveloped and closed financial market, to a democracy with free elections, the restoration of national sovereignty, market economy, free enterprise, state delivery of social welfare services and free social mobility (Tokes, Reference Tokes1996; Berend, 2000; Philipov & Dorbritz, Reference Philipov and Dorbritz2003; Marki-Zay, Reference Marki-Zay2005; Hungarian Central Statistical Office, 2010). The socioeconomic macro-level indicators describe this very complex transition very precisely: after the transition the rate of unemployment increased due to the collapse of state firms, the small private sector and the slow tempo of privatization (Brown et al., Reference Brown, Kulcsar, Kulcsar and Obadovics2005), impoverishment increased and GDP worsened in most of countries. However, besides changes in the political, economic and social structure of the countries, significant demographic changes occurred too, e.g. family structure, fertility, mortality and morbidity rates also changed.
The main purpose of this study was to investigate how these historical, political and economic changes occurring over the century impacted on the growth and maturation of Hungarian children using stature, body mass and body mass index (BMI) as measures of growth and the timing of menarche and spermarche of sexual maturation. The study’s hypothesis was that improvements in living conditions would be associated with faster somatic growth and earlier sexual maturation of children.
Methods
Economic status indicators
Economic status was assessed using (a) GDP per capita in the studied interval (USD; Trading Economics, 2013), and (b) income inequalities as measured by the Gini index. The Gini index (which varies between 0=equality and 100=maximum inequality) is used to assess how the distribution of income or consumption expenditure among individuals or households deviates from a perfectly equal distribution (Wilkinson & Pickett, Reference Wilkinson and Pickett2011; European Commission, 2013). The index value of a population can be calculated using a Lorenz curve of the cumulative percentages of total income received against the cumulative number of recipients, by starting with the poorest individual or household. The index measures the area between the Lorenz curve and a hypothetical line of absolute equality, expressed as a percentage of the maximum area under the line (Wilkinson & Pickett, Reference Wilkinson and Pickett2011; World Bank, 2011). The Gini index is available only from the 1960s onwards (European Commission, 2013).
Health status and food consumption indicators
The general health status of the Hungarian population was assessed by two demographic indicators: (a) life expectancy at birth (available for the period 1923–2012; Kincses, Reference Kincses2004; Hungarian Central Statistical Office, 2012) and (b) child mortality rate (under-5 mortality per 10,000 live births) (available for the period 1913–2010; Mitchell, Reference Mitchell2000; Hungarian Central Statistical Office, 2012). Secular changes in food consumption were estimated from changes in meat and fish, milk, eggs, flour and rice, sugar, potato and other vegetables and fruit consumption over the whole time period (Manyi Szabo & Goro, Reference Manyi Szabo and Goro1996; Hungarian Central Statistical Office, 2013).
National studies of growth and maturation pattern
Growth studies in Hungary have a relatively long history; the first records date back to the 1870s (Kezmarszky, Reference Kezmarszky1873). Since the second decade of the 20th century an increasing number of regional growth studies have been performed, but only three nationwide studies have been undertaken. The first national study was performed by Bartucz (Reference Bartucz1923) between 1910 and 1920. He collected height data from 36,646 schoolchildren aged between 6 and 18 years. The second representative national cross-sectional growth study was carried out in the first half of the 1980s (1983–86) by Eiben and associates, who sampled 1.5% of Hungarian children aged between 3 and 18 years (N=41,000; Eiben et al., Reference Eiben, Barabas and Panto1991). The third representative national cross-sectional growth study was carried out between 2003 and 2006 by Bodzsar and associates. They sampled a representative 2% sample of Hungarian children aged between 3 and 18 years (N=25,181; Bodzsar & Zsakai, Reference Bodzsar and Zsakai2012; Zsakai & Bodzsar, Reference Zsakai and Bodzsar2012).
These three national growth studies cannot provide information on the rate of change in growth and maturation over this 80-year period. To compensate for the lack of consistent data collection, Eiben & Panto (Reference Eiben and Panto1986) provided estimates of the rate of secular change in schoolchildren by gathering the available regional studies between the 1910s and 1970s and forming sample-size weighted means of stature, body mass and BMI (kg/m2) for every year of age over the respective decades. (The data for the 1920 series in the analysis were calculated by using the data of the first national growth study of Bartucz – data were available only between 6 and 18 years – and from the other regional studies in the 1920s.)
In the representative growth studies (1983–86, 2003–06) the anthropometric measurements (only body mass and stature, and the derived BMI were used in the present analysis) were performed by using standardized techniques and standard anthropometric measuring devices (IBP recommendations; Weiner & Lourie, Reference Weiner and Lourie1969). Permission for both studies had been obtained from the Office of the Hungarian Parliamentary Commissioner for Future Generations and the National Human Research Ethics Committee.
Sexual maturity status was estimated by the spermarcheal status in boys and menarcheal status in girls (data were collected by questionnaires and personal interviews). Data on male sexual maturation are very scarce in Hungary, especially data collected by national studies (data are available only from the 1980s). Some data on the mean age at menarche have been available since the 1960s. However, the older data were collected by the retrospective method, and are not as reliable as those gathered by the status quo method (recording the actually existing maturity status). Data on menarcheal or spermarcheal status were collected by the status quo method (subjects were asked whether they had had the first pollution or menstruation; the spermarcheal status was always rated only by considering the personal interviews and the ratings of other indicators of sexual maturity, i.e. Tanner developmental stages of external genitalia, pubic hair and axillary hair), and median ages at menarche/spermarche were estimated by probit analysis (Wilson & Sutherland, Reference Wilson and Sutherland1950; Weber, Reference Weber1969) in the two representative national cross-sectional growth studies (1983–86, 2003–06). Secular change in spermarcheal age and menarcheal age of Hungarian children are presented only from the relevant national studies from the 1940s (Frigyesi, 1948; Fekete, 1955; Bottyan et al., 1963 [studies made in 1959–61]; Eiben et al., 1991 [studies made in 1983–86].
Limitations of the analysis
Since only two national representative growth studies were carried out in the last 80 or so years, data on children’s body development were available only from regional studies between the 1910s and 1970s. Therefore the weighted means were calculated from the results of these studies. Data on menarcheal age (collected and analysed by the same methodology) were available from the 1950s, therefore the secular trend in sexual maturation was only described for this shorter interval. Since only two datasets were available for spermarcheal age, further investigations and data collections are needed to analyse the tempo and direction of secular changes in this indicator of sexual maturation. Data on the economic, demographic and health indicators were collected from different sources and over different time periods so the results should be treated with caution.
Results
Secular changes in the socioeconomic characteristics of Hungary
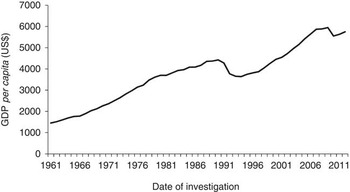
After World War II, a forced industrialization policy changed the economic character of the country: a centrally planned economy was introduced, and this policy reflected in the increase in GDP of the country. This economic modernization continued until the 1980s. After 1989, after a complex political, social and economic transition, Hungary restructured its foreign trade, but market competition led to further economic decline. By the mid-1990s the economy was again growing. The 2008 global financial crisis resulted in stagnation and a further decrease in the country’s GDP (Fig. 1).
GDP per capita in US$ in Hungary between 1961 and 2012 (source: Trading Economics, 2013).

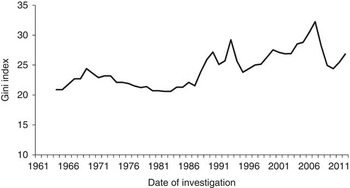
The changes in the Gini index, which reflects income and consumption inequalities, between 1964 and 2012 are presented in Fig. 2. There was low and stable inequality up to the mid-1980s. Thereafter inequality generally increased reflecting the change in political, social and economic systems up to 2006. Between 2006 and 2009 there was a steep decrease in the Gini index. Even so, between 1964 and 2012 the inequality trend is upward with a 6% increase between the two dates.
Gini index in Hungary between 1964 and 2012 (source: European Commission, 2013).

Secular changes in health status and food consumption in Hungary
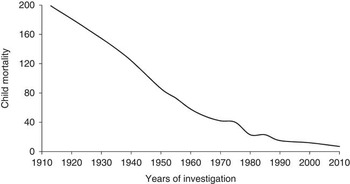
Child mortality decreased steeply until the 1970s, followed by a more moderate decrease until the end of the studied interval (Fig. 3). In 1910 there were about 200 deaths per 10,000 live births in under-5-year-olds while the rate decreased to less than 10 deaths per 10,000 live births for the most recent data.
Child mortality (under-5 mortality) per 10,000 live births in Hungary between 1913 and 2007 (sources: Mitchell, Reference Mitchell2000; Hungarian Central Statistical Office, 2012).

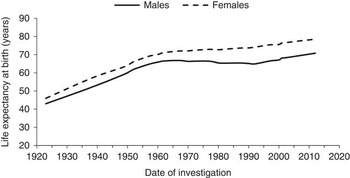
Life expectancy at birth of males and females varied (Fig. 4). In Hungarian women it increased from about 45 years of age to 70 years of age by 1960. Thereafter the increase in life expectancy was slower up to the current 78 years of age. Male life expectancy was lower than female life expectancy by about 3–4 years up to 1960 and thereafter the difference increased to 7–8 years. Male life expectancy reached a peak of about 65 years of age in 1960 and over the next 30 years life expectancy declined before there as an increase again from about 1990 reaching about 70 years of age currently.
Life expectancy at birth in Hungary between 1923 and 2012 (sources: Kincses, Reference Kincses2004; Hungarian Central Statistical Office, 2012).

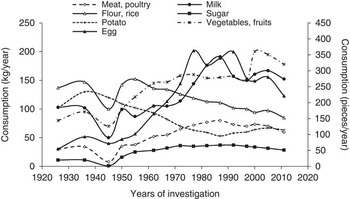
The changing pattern of food consumption is presented in Fig. 5. There was a general decline in consumption of inexpensive foods (potato, flour and rice) over the time period, except for during World War II when the consumption of these foods decreased. The opposite tendency was observed for the other studied non-poverty foods (meat, egg, milk, sugar, vegetables and fruits) as their consumption increased significantly between 1926 and 2011. The economic decline at the beginning of the 1990s was accompanied by a slowdown of consumption of these non-poverty foods (Fig. 5).
Food consumption trend in Hungary between 1926 and 2011. Consumption is expressed in kg/person/year with the exception of egg, which is expressed in pieces/person/year (right-hand y-axis); vegetables and fruit consumption excludes potato consumption (sources: Manyi & Goro, 1996; Hungarian Central Statistical Office, 2013).

Secular changes in the stature, body mass and BMI of Hungarian children
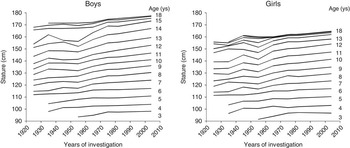
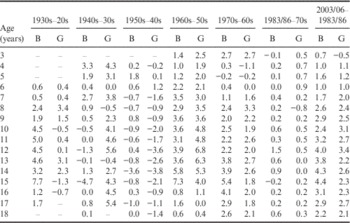
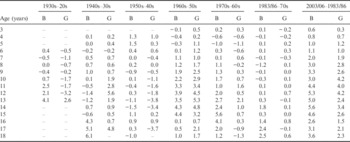
The mean stature of boys increased from the beginning of the studied interval until the mid-1930s and then showed a moderate decrease during World War II until the 1950s. Until the mid-1930s the mean stature of girls did not change (with the exception of a few age groups such as 13–14 years), and then increased until the mid-1940s and again had an increase until the mid-1950s. The stature means were found to have increased significantly since the 1950s, but the rate of increase has slowed down in both sexes since the 1970s (Fig. 6, Table 1).
Mean stature (cm) of Hungarian children (data until the 1970s were estimated by Eiben & Panto, Reference Eiben and Panto1986).

Secular changes in stature (cm) of boys (B) and girls (G) in Hungary between the 1920s and the beginning of the 2000s

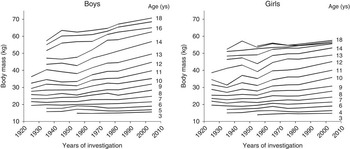
The same pattern characterized the secular changes in body mass as was found in stature until the mid-1950s. The only difference was in girls’ mean body mass, which decreased until the mid-1930s. Mean body mass increased from the mid-1950s in both sexes, and more slowly from the 1970s until the end of the studied interval (Fig. 7, Table 2).
Mean body mass (kg) of Hungarian children (data until the 1970s were estimated by Eiben & Panto, Reference Eiben and Panto1986).

Secular changes in body mass (kg) of boys (B) and girls (G) in Hungary between the 1920s and the beginning of the 2000s
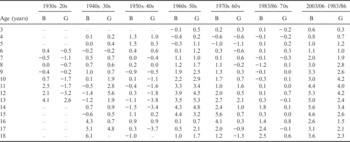
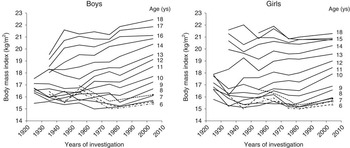
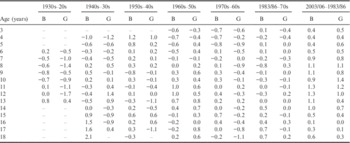
The mean BMI of boys generally increased over the 90-year study period although this increase was interrupted by stagnation between the 1940s and 1960s. As a summation of secular changes in stature and body mass, a wave pattern appeared in the children’s mean BMI between the mid-1930s and mid-1950s in girls in almost all age groups, and then a steep increase was found in girls’ mean BMI until the end of the studied interval (Fig. 8, Table 3).
Mean body mass index (kg/m2) of Hungarian children. Since the BMI curves between the age of 3 and 5 years cross each other in this interval, these are shown individually: 3, ●; 4, ∆; 5, □. Data until the 1970s were estimated by Eiben & Panto (Reference Eiben and Panto1986).

Secular changes in body mass index (kg/m2) of boys (B) and girls (G) in Hungary between the 1920s and the beginning of the 2000s

Considering the changes in the pattern of BMI curves the adiposity rebound (when BMI declines and reaches a minimum, on average, at 5–6 years of age before beginning a gradual increase through adolescence) shifted towards younger ages over time. The smallest BMI was found in the 6–7 year age groups until the 1960s and in the 4–5 year age groups from the 1970s. In girls older than 14 years mean BMIs did not change by age in contrast to boys’ mean BMI, which increased further after 14 years of age (Fig. 8).
Secular changes in sexual maturation
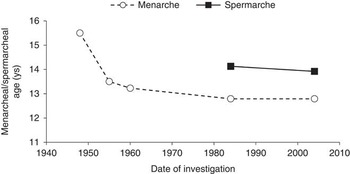
By comparing the available median ages of spermarcheal age estimated on the basis of the two national representative studies (1983–86 and 2003–06), age at spermarche was estimated to be 14.1 years in 1983–86 and 13.9 years in 2003–06 (Fig. 9). Age at menarche decreased very intensively after World War II until the middle of the 1950s (at a rate of 2.8 years per decade). Thereafter the rate slowed considerably and there has been very little change in age at first onset of menstruation over last two decades (Fig. 9).
Menarcheal and spermarcheal age in Hungary (sources: Frigyesi, 1948; Fekete, 1955; Bottyan et al., 1959–61; Eiben et al., 1983–86; all cited by Bodzsar, Reference Bodzsar1998).

Discussion
The observed changes in child growth and maturation in Hungary generally paralleled the changes in the country’s socioeconomic conditions. The largest acceleration in the growth rate of children was observed at the end of the 1970s and early 1980s. Thereafter the rate decreased, but the change of growth pattern was still positive. Sexual maturation in girls (data on spermarcheal age collected in national studies were available only from the 1980s) took place at a younger age but the rate declined from the 1960s to1980s and stagnated thereafter. The favourable changes of the last century involving the whole of the Hungarian population have not only manifested in the positive secular trends of growth and development, but also in the demographic indices, e.g. in a reduction of perinatal and postnatal child mortality and a markedly longer life expectancy from birth. In the first years of last century the latter was 39 years for the males and 40 years for females. By the end of the 1980s life expectancy had doubled to 65 and 73 years in males and females, respectively and has improved further since then.
The increase in GDP was accompanied by an increase in income and consumption inequalities (as measured by the Gini index) in the second part of the last century due to secular changes in the economic structure of Hungary. In the first few years after the fall of communism, the number of people living below the subsistence level doubled, but stabilized by the early 21st century. The growth pattern of children showed sensitivity to the negative socioeconomic changes of the country only in the very disadvantaged periods, i.e. during World War II and the post-war period: the increase in body dimensions slowed down or decreased during these adverse periods of the last century. The economic and political crisis starting in the early 1980s resulted in a chain reaction of collapse in the former Central and East European states and a more or less complete dissolution of the former regimes (Tokes, Reference Tokes1996; Philipov & Dorbritz, Reference Philipov and Dorbritz2003; Bodzsar & Zsakai, Reference Bodzsar and Zsakai2014). While gaining nearly complete political and social freedom, a very considerable part of the Hungarian population has suffered severe deterioration of economic conditions. By considering the analysed secular tendency of children’s body dimensions it can be concluded that these considerable negative changes in the socioeconomic conditions of Hungary during the transition period (at the beginning of the 1990s) was not reflected in the growth pattern of children.
At present the part of the Hungarian nation living at or below the minimum subsistence level is nearly 25%. Unemployment is still high (11–12%) with conspicuous regional differences. There are vast differences in socioeconomic conditions between the social strata. The repercussions of these adverse events on the pattern of children’s development and the health status of the adult population will be the topic of future research (Aassve et al., Reference Aassve, Billari and Speder2006; Bornhorst & Commander, Reference Bornhorst and Commander2006; Trading Economics, 2013).
Conclusions
This study demonstrates the parallelism in the secular changes in the socioeconomic conditions of the society and in children’s body development in the Hungarian population over the last nine decades. By considering the direction of secular growth changes in children, the results are in agreement with findings from other European countries from both Western and Eastern regions. The positive secular trend of children’s stature and body mass, as well as in sexual maturation, was very intensive in the 1970s, and then a decrease of this tendency has been seen in the last decades in the European countries (Vercauteren & Susanne, Reference Vercauteren and Susanne1985; Liestol & Rosenberg, Reference Liestol and Rosenberg1995; Hauspie et al., Reference Hauspie, Vercauteren and Susanne1997; Bielicki & Hulanicka, Reference Bielicki and Hulanicka1998; Godina, Reference Godina1998; Susanne & Bodzsar, Reference Susanne and Bodzsar1998; Vercauteren et al., Reference Vercauteren, Hauspie and Susanne1998; Cole, Reference Cole2003; Kobzova et al., Reference Kobzova, Vignerova, Blaha, Krejcovsky and Riedlova2004; Bielicki et al., Reference Bielicki, Szklarska, Koziel and Ulijaszek2005; Tutkuviene, Reference Tutkuviene2005; Larnkaer et al., 2006; Koca Ozer, Reference Koca Ozer2008; Webb et al., Reference Webb, Kuh, Pajak, Kubinova, Malyutina and Bobak2008; Gohlke & Woelfle, Reference Gohlke and Woelfle2009; Woronkowicz et al., Reference Woronkowicz, Cichocka, Kowal, Kryst and Sobiecki2012; Bodzsar & Zsakai, Reference Bodzsar and Zsakai2014). However, a difference between the Western and Eastern parts of Europe can be found in this secular tendency of children’s body structure, since the secular trend of these body dimensions slowed down in Western countries, while it still proceeded in Hungary and other Eastern European children’s stature at the beginning of the 21st century. These differences in children’s body structure between Western and Eastern European countries in the last decades, and the differences in these tendencies of stature and body mass, could have resulted from differences in nutritional status of children between the two regions of Europe: the prevalence of obese children is increasing in the Eastern region at the beginning of the 21st century, while it has not increased since the second part of the first decade of the 21st century (2008–10) in France (Peneau et al., Reference Peneau, Salanave, Maillard-Teyssier, Rolland-Cachera, Vergnaud and Mejean2009; Salanave et al., Reference Salanave, Peneau, Rolland-Cachera, Hercberg and Castetbon2009) or in Sweden (Sjoberg et al., Reference Sjoberg, Lissner, Albertsson-Wikland and Marild2008; Switzerland, Aeberli et al., Reference Aeberli, Henschen, Molinari and Zimmermann2010).
The influence of socioeconomic conditions on children’s development cannot be sufficiently emphasized. These analyses have made an attempt to describe this relation from the aspect of socioeconomic transition in an Eastern European society.
Acknowledgments
The 2nd Hungarian representative national growth study (2003–06) was supported by the Hungarian National Foundation for Science (OTKA grants 47073 and 76849). The work of Annamaria Zsakai was also supported by the Janos Bolyai Research Scholarship (2014-2017) of the Hungarian Academy of Sciences.