



1 Introduction
The leading-edge vortex (LEV) has been proved to be very relevant for the generation of unsteady forces and moment on heaving and pitching airfoils, especially at relatively low Reynolds numbers, being partly responsible for the excellent aerodynamic performance of flapping wings in insects and small birds (Ellington Reference Ellington1984; Dickinson & Götz Reference Dickinson and Götz1993; Ellington et al. Reference Ellington, van den Berg, Willmott and Thomas1996; Wang Reference Wang2000; Minotti Reference Minotti2002; Wang Reference Wang2005; Maxworthy Reference Maxworthy2007; Shyy & Liu Reference Shyy and Liu2007; Baik et al. Reference Baik, Bernal, Granlund and Ol2012; Pitt Ford & Babinsky Reference Pitt Ford and Babinsky2013). However, the unsteady linear potential theory of Theodorsen (Reference Theodorsen1935) and von Kármán and Sears (Reference von Kármán and Sears1938), which assumes small amplitude in the airfoil oscillations, with an almost flat wake vortex sheet and no LEV generation, is surprisingly quite accurate in predicting the unsteady lift force and moment of thin flapping airfoils (McGowan et al. Reference McGowan, Granlund, Ol, Gopalarathnam and Edwards2011; Baik et al. Reference Baik, Bernal, Granlund and Ol2012; Mackowski & Williamson Reference Mackowski and Williamson2015, Reference Mackowski and Williamson2017; Cordes et al. Reference Cordes, Kampers, Meissner, Tropea, Pinke and Hölling2017) and also the thrust force and propulsion efficiency when using the correct vortex impulse formulation (Fernandez-Feria Reference Fernandez-Feria2016, Reference Fernandez-Feria2017). This is so even for low Reynolds number and for not so small amplitude of the oscillations, when LEV generation and shedding constitutes a relevant feature of the actual fluid motion around the airfoil. Thus, it would be of interest to explore the possibility of including the formation of weak LEVs into the linear potential theory to improve its predictive capabilities when the angle of attack is not very small.
In the present paper, we analyse the interaction of arbitrary travelling point vortices with a heaving and pitching foil within the framework of the unsteady linear potential theory, and obtain general expressions for their contributions to the lift, thrust and moment on the foil by using a vortical impulse formulation (von Kármán & Sears Reference von Kármán and Sears1938; Wu Reference Wu1981; Fernandez-Feria Reference Fernandez-Feria2016). To that end, we solve the integral equation for the vortex-sheet strength of the bound vortex sheet around the foil which takes into account the effect of the point vortices in addition to the free wake vortex sheet. The resulting expressions for the forces and moment contain additional integral terms that depend on the temporal evolution of the point vortices and that, in general, have to be solved numerically.
As a difference from some previous related works, we maintain the continuous trailing vortex wake of the linearized potential theory and add the generation of an LEV during each half-stroke as a point vortex, instead of considering the generation and shedding of both LEVs and trailing-edge vortices (TEVs) as a succession of point vortices. For instance, Tchieu & Leonard (Reference Tchieu and Leonard2011) used a vortex theory formulation quite similar to the present one, but considering the trailing wake as a succession of point vortices instead of the continuous distribution of von Kármán & Sears (Reference von Kármán and Sears1938), and without considering the effect of the LEVs, to obtain the lift force and moment of an unsteady thin airfoil. Ramesh et al. (Reference Ramesh, Gopalarathnam, Edwards, Ol and Granlund2013) extended this approach to large amplitudes, combining the vortex formulation with standard potential theory. Xia & Mohseni (Reference Xia and Mohseni2013) employed conformal mapping and the unsteady Blasius equation to model the force on a pitching flat plate by considering the effect of the LEVs and TEVs as successive point vortices emanating from their respective edges. These authors validated their results against experiments for the starting plate problem and for a non-sinusoidal pitching motion for which our oscillating model is not valid. The starting plate problem, or Wagner problem, was also analysed by Li & Wu (Reference Li and Wu2015) in the presence of additional LEVs/TEVs using a vortical impulse formulation very similar to that developed here. These authors, who only computed the lift force, considered an unsteady developing TEV instead of the long-time infinite trailing vortex wake of an oscillating plate considered here. However, as discussed below in § 3, the general expression for the lift force of a point vortex in terms of the temporal evolution of its circulation and its position, as derived in more detail by Li, Bai & Wu (Reference Li, Bai and Wu2015), is equivalent to the general expression developed here. The results for the Wagner problem were generalized by the same authors (Li & Wu Reference Li and Wu2016) to account for high angles of attack, and for the residual vortex sheet at both the leading and trailing edges, representing vortices being shed yet not represented by point vortices. A similar general vortex force formulation, without the thin-airfoil assumption, and considering the vortex shedding from a general-shaped airfoil with non-sharp leading edge, was more recently considered by Xia & Mohseni (Reference Xia and Mohseni2017).
To simplify the problem and be able to obtain closed approximate expressions for the forces and moment, we introduce several approximations. First, we assume that the vortices remain sufficiently close to the foil, in accordance with the linearized approximation, and that the thin airfoil has a sharp leading edge, in addition to a sharp trailing edge (as in a flat plate). Then, knowing that the main contribution to the forces and moment is produced while the LEV is still developing close to the leading edge (Pullin & Wang Reference Pullin and Wang2004; Martín-Alcántara, Fernandez-Feria & Sanmiguel-Rojas Reference Martín-Alcántara, Fernandez-Feria and Sanmiguel-Rojas2015), we consider only the effect of a single developing LEV during each half-stroke, up to the point where it is shed. The last assumption constitutes a strong simplification of the problem, both because all the other already shed LEVs are not taken into account and because the effect of the growing LEV on the wake vorticity is negligible. As a consequence, closed simple expressions for the contribution of the LEV to the forces and moment on the flapping foil can be obtained, constituting a lowest-order correction to the analytical results of the linearized potential theory when the LEV is included in the formulation.
To model the developing LEV, we assume that vorticity is released at the sharp leading edge, with an unsteady Kutta condition to remove the singularity of the bound vortex-sheet strength at the leading edge, similar to the condition applied at the sharp trailing edge where the free wake vortex sheet is released. Then, we use the Brown–Michael model (Reference Brown and Michael1954), which ensures momentum conservation (Michelin & Llewellyn Smith Reference Michelin and Llewellyn Smith2009) and assumes that the vortex is shed when its circulation reaches an extremum value to avoid discontinuities in temporal forces. More realistic models for the growing and shedding of the vortices could have been used (Tchieu & Leonard Reference Tchieu and Leonard2011; Wang & Eldredge Reference Wang and Eldredge2013; Hemati, Eldredge & Speyer Reference Hemati, Eldredge and Speyer2014), but they need additional parameters and equations that would complicate the formulation. The present approximation is in accordance with the simplicity of the linear potential theory, providing closed-form expressions for the contributions of the LEV to the lift, thrust and moment that depend only on flapping kinematics parameters. These results are compared with available experimental data for slender airfoils with small-to-medium maximum angle of attack.
2 Formulation of the problem
We consider the two-dimensional (2D), incompressible and nearly inviscid flow over a heaving and pitching thin airfoil of chord length
 $c$
that moves with constant speed
 $U$
along the negative
 $x$
-axis (see figure 1). The vertical amplitudes of the heaving and pitching motions are both very small compared with
 $c$
, so that the airfoil and every point of the trail of vortices that it leaves behind may be considered to be on the
 $x$
-axis in first approximation. In addition to the continuous wake, we shall consider the effect of individual concentrated (point) vortices generated at the leading edge and moving downstream (only one such vortex is depicted in the sketch of figure 1).
Schematic of the problem.

For simplicity, we select
 $c=2$
, so that all lengths are scaled with the half-chord
 $c/2$
, and the plate, or slender airfoil with two sharp ends, extends from
 $x=-1$
to
 $x=1$
in a reference frame translating with it at speed
 $U$
along the
 $x$
-axis. In this reference frame, the motion of the airfoil is given by the vertical displacement of its mean-camber line (see the sketch in figure 2),
 $$\begin{eqnarray}\displaystyle z_{s}(x,t)=h(t)-(x-a)\unicode[STIX]{x1D6FC}(t),\quad -1\leqslant x\leqslant 1, & & \displaystyle\end{eqnarray}$$
with
 $$\begin{eqnarray}\displaystyle h(t)=\text{Re}[h_{0}\text{e}^{\text{i}\unicode[STIX]{x1D714}t}],\quad \unicode[STIX]{x1D6FC}(t)=\text{Re}[\unicode[STIX]{x1D6FC}_{0}\text{e}^{\text{i}\unicode[STIX]{x1D714}t}], & & \displaystyle\end{eqnarray}$$
where
 $\unicode[STIX]{x1D714}$
is the frequency of the oscillations of both the heaving motion,
 $h(t)$
, and the pitching rotation,
 $\unicode[STIX]{x1D6FC}(t)$
, around the horizontal axis
 $x=a$
(i.e. the dimensional pivoting distance from the leading edge is
 $s_{p}=(1+a)c/2$
), and
 $\text{Re}$
means real part. The amplitudes
 $h_{0}$
and
 $\unicode[STIX]{x1D6FC}_{0}$
are in general complex constants (to account for any phase shift between the two oscillations) satisfying
 $|h_{0}|\ll 1$
and
 $|\unicode[STIX]{x1D6FC}_{0}|\ll 1$
. For simplicity, we select
 $h_{0}$
real and
 $$\begin{eqnarray}\displaystyle \unicode[STIX]{x1D6FC}_{0}=a_{0}\text{e}^{\text{i}\unicode[STIX]{x1D719}}, & & \displaystyle\end{eqnarray}$$
with
 $\unicode[STIX]{x1D719}$
the phase shift between the plunging and pitching motions and
 $a_{0}$
the maximum pitching amplitude. In what follows, we shall work with the complex functions, knowing that we have to take the real part of the results. The vertical velocity of the rigid airfoil is
 $$\begin{eqnarray}\displaystyle v_{0}(x,t)={\dot{h}}-(x-a)\dot{\unicode[STIX]{x1D6FC}}-U\unicode[STIX]{x1D6FC}, & & \displaystyle\end{eqnarray}$$
where a dot denotes the time derivative.
Schematic of the oscillating airfoil with an LEV.

2.1 General expressions for the lift, drag or thrust, and moment
The vortical impulse theory for an incompressible and unbounded flow is used to obtain the forces and moment on the airfoil. Neglecting the volume (section) of the airfoil, one may write (Wu Reference Wu1981; Saffman Reference Saffman1992; Wu, Ma & Zhou Reference Wu, Ma and Zhou2006)
 $$\begin{eqnarray}\displaystyle \boldsymbol{F}\equiv D\boldsymbol{e}_{x}+L\boldsymbol{e}_{z}=-\unicode[STIX]{x1D70C}\frac{\text{d}\boldsymbol{I}}{\text{d}t}, & & \displaystyle\end{eqnarray}$$
where
 $D$
is the drag (or minus the thrust) force,
 $L$
is the lift force,
 $\unicode[STIX]{x1D70C}$
is the fluid density, and the vortical impulse (or vorticity moment)
 $\boldsymbol{I}$
is defined as
 $$\begin{eqnarray}\displaystyle \boldsymbol{I}=\int _{{\mathcal{V}}}\boldsymbol{x}\wedge \unicode[STIX]{x1D74E}\,\text{d}{\mathcal{V}}, & & \displaystyle\end{eqnarray}$$
where
 $\unicode[STIX]{x1D74E}=\unicode[STIX]{x1D735}\wedge \boldsymbol{v}$
is the vorticity field and
 ${\mathcal{V}}$
is the entire volume (plane in this case) occupied by the fluid plus the airfoil. In writing (2.5), it is assumed that
 ${\mathcal{V}}$
is unbounded and that the flow is potential far from the airfoil. In fact, we shall assume that the vorticity, which is directed along the normal
 $\boldsymbol{e}_{y}$
to the plane of the fluid motion, is concentrated at the airfoil surface, at the trailing wake, both considered as vortex sheets, and at the locations [
 $x_{j}(t),z_{j}(t)$
],
 $j=1,\ldots ,N$
, of the
 $N$
point vortices (e.g. LEVs) present in the flow at each instant of time. Thus,
 $$\begin{eqnarray}\displaystyle \boldsymbol{I}\simeq \mathop{\sum }_{j=1}^{N}\unicode[STIX]{x1D6E4}_{j}(-z_{j}\boldsymbol{e}_{x}+x_{j}\boldsymbol{e}_{z})+\int _{-1}^{1}(-z_{s}\unicode[STIX]{x1D71B}_{s}\boldsymbol{e}_{x}+x\unicode[STIX]{x1D71B}_{s}\boldsymbol{e}_{z})\,\text{d}x+\int _{1}^{\infty }(-z_{e}\unicode[STIX]{x1D71B}_{e}\boldsymbol{e}_{x}+x\unicode[STIX]{x1D71B}_{e}\boldsymbol{e}_{z})\,\text{d}x,\qquad & & \displaystyle\end{eqnarray}$$
where
 $\unicode[STIX]{x1D6E4}_{j}$
is the circulation (positive clockwise) of the
 $j$
th point vortex,
 $\unicode[STIX]{x1D71B}_{s}(x,t)$
,
 $-1\leqslant x\leqslant 1$
, is the vorticity density distribution on the airfoil,
 $\unicode[STIX]{x1D71B}_{e}(x,t)$
is the vorticity density distribution in the trailing wake and
 $z_{e}(x,t)$
is the vertical position of each point in this vortex wake. We consider the large-time behaviour in which the vortex wake sheet extends many chord lengths downstream of the airfoil, so that, in first approximation,
 $1\leqslant x\leqslant \infty$
for both
 $\unicode[STIX]{x1D71B}_{e}(x,t)$
and
 $z_{e}(x,t)$
, with
 $|z_{e}|\ll 1$
, as commented on above. Moreover, although the following derivations will be for arbitrary locations of the point vortices
 $(x_{j},z_{j})$
, we shall simplify them afterwards, retaining only the lowest-order approximations for
 $|z_{j}|\ll 1$
to be consistent with the present linearized approach.
Consequently, under the assumptions made, the drag (or minus the thrust) and lift forces on the airfoil are given by
 $$\begin{eqnarray}\displaystyle & \displaystyle D=\unicode[STIX]{x1D70C}\mathop{\sum }_{j=1}^{N}\frac{\text{d}}{\text{d}t}(z_{j}\unicode[STIX]{x1D6E4}_{j})+\unicode[STIX]{x1D70C}\frac{\text{d}}{\text{d}t}\int _{-1}^{1}z_{s}\unicode[STIX]{x1D71B}_{s}\,\text{d}x+\unicode[STIX]{x1D70C}\frac{\text{d}}{\text{d}t}\int _{1}^{\infty }z_{e}\unicode[STIX]{x1D71B}_{e}\,\text{d}x, & \displaystyle\end{eqnarray}$$
 $$\begin{eqnarray}\displaystyle & \displaystyle L=-\unicode[STIX]{x1D70C}\mathop{\sum }_{j=1}^{N}\frac{\text{d}}{\text{d}t}(x_{j}\unicode[STIX]{x1D6E4}_{j})-\unicode[STIX]{x1D70C}\frac{\text{d}}{\text{d}t}\int _{-1}^{1}x\unicode[STIX]{x1D71B}_{s}\,\text{d}x-\unicode[STIX]{x1D70C}\frac{\text{d}}{\text{d}t}\int _{1}^{\infty }x\unicode[STIX]{x1D71B}_{e}\,\text{d}x. & \displaystyle\end{eqnarray}$$
Similarly, the vortical impulse theory also provides the moment on the airfoil (Wu Reference Wu1981; Saffman Reference Saffman1992; Wu et al. Reference Wu, Ma and Zhou2006),
 $$\begin{eqnarray}\displaystyle \boldsymbol{M}=-M\boldsymbol{e}_{y}=-\unicode[STIX]{x1D70C}\frac{\text{d}\boldsymbol{A}}{\text{d}t}, & & \displaystyle\end{eqnarray}$$
where
 $$\begin{eqnarray}\displaystyle \boldsymbol{A}=-\frac{1}{2}\int _{{\mathcal{V}}}|\boldsymbol{x}-a\boldsymbol{e}_{x}|^{2}\unicode[STIX]{x1D74E}\,\text{d}{\mathcal{V}} & & \displaystyle\end{eqnarray}$$
is the angular impulse in relation to the pitching axis
 $x=a$
moving with speed
 $U$
along the
 $x$
-axis (it should be noted that the distance
 $Ut$
is also scaled with
 $c/2$
). Thus,
 $$\begin{eqnarray}\displaystyle M & \simeq & \displaystyle \frac{1}{2}\unicode[STIX]{x1D70C}\frac{\text{d}}{\text{d}t}\left[\mathop{\sum }_{j=1}^{N}(x_{j}-Ut+a_{i})^{2}\unicode[STIX]{x1D6E4}_{j}+\int _{-1}^{1}(x-Ut+a_{i})^{2}\unicode[STIX]{x1D71B}_{s}\,\text{d}x\right.\nonumber\\ \displaystyle & & \displaystyle +\left.\int _{1}^{\infty }(x-Ut+a_{i})^{2}\unicode[STIX]{x1D71B}_{e}\,\text{d}x\right],\end{eqnarray}$$
with
 $a=Ut-a_{i}$
in a stationary reference frame with the fluid at rest far from the airfoil.
Without considering the effect of the individual point vortices
 $\unicode[STIX]{x1D6E4}_{j}$
, the lift and moment were computed by von Kármán and Sears (Reference von Kármán and Sears1938) using similar expressions to (2.9) and (2.12), while the thrust/drag was recently computed using (2.8) in Fernandez-Feria (Reference Fernandez-Feria2016). Reference to these works will be made for some particular results needed in the following computations. It should be noted that the general expressions (2.5) and (2.10) were derived by Wu (Reference Wu1981) for any unsteady vorticity distribution in an incompressible flow, including unsteady point vortices. They have already been used for a distribution of unsteady point vortices by Tchieu & Leonard (Reference Tchieu and Leonard2011) and Li et al. (Reference Li, Bai and Wu2015), among others, in similar problems, and (2.5) has also been used for unsteady point vortices to estimate forces from experimental data by Graham, Pitt Ford & Babinsky (Reference Graham, Pitt Ford and Babinsky2017).
2.2 Vorticity distribution on the airfoil
Following von Kármán and Sears (Reference von Kármán and Sears1938) and invoking the linearity of the problem, we separate the contributions of the vortex-sheet wake and the
 $N$
point vortices to
 $\unicode[STIX]{x1D71B}_{s}$
from the bound circulation that would be produced by the motion of the airfoil as if the wake and the point vortices had no effect,
 $$\begin{eqnarray}\displaystyle \unicode[STIX]{x1D71B}_{s}(x,t)=\unicode[STIX]{x1D71B}_{0}(x,t)+\unicode[STIX]{x1D71B}_{1e}(x,t)+\mathop{\sum }_{j=1}^{N}\unicode[STIX]{x1D71B}_{1j}(x,t),\quad -1\leqslant x\leqslant 1, & & \displaystyle\end{eqnarray}$$
with
 $$\begin{eqnarray}\displaystyle \unicode[STIX]{x1D6E4}_{0}(t)=\int _{-1}^{1}\unicode[STIX]{x1D71B}_{0}(x,t)\,\text{d}x & & \displaystyle\end{eqnarray}$$
being the circulation that would be obtained from the quasisteady airfoil theory, without moving vortices or unsteady wake, such that the corresponding lift would be
 $\unicode[STIX]{x1D70C}U\unicode[STIX]{x1D6E4}_{0}$
. The vorticity density
 $\unicode[STIX]{x1D71B}_{1e}$
is the contribution to
 $\unicode[STIX]{x1D71B}_{s}$
induced by the wake vortex-sheet strength
 $\unicode[STIX]{x1D71B}_{e}$
, and
 $\unicode[STIX]{x1D71B}_{1j}$
is the contribution from the point vortex
 $j$
. Kelvin’s total-circulation conservation theorem requires that
 $$\begin{eqnarray}\displaystyle \unicode[STIX]{x1D6E4}_{0}+\unicode[STIX]{x1D6E4}_{1e}+\mathop{\sum }_{j=1}^{N}(\unicode[STIX]{x1D6E4}_{j}+\unicode[STIX]{x1D6E4}_{1j})+\int _{1}^{\infty }\unicode[STIX]{x1D71B}_{e}\,\text{d}x=0, & & \displaystyle\end{eqnarray}$$
with
 $$\begin{eqnarray}\displaystyle \unicode[STIX]{x1D6E4}_{1e}(t)=\int _{-1}^{1}\unicode[STIX]{x1D71B}_{1e}(x,t)\,\text{d}x\quad \text{and}\quad \unicode[STIX]{x1D6E4}_{1j}(t)=\int _{-1}^{1}\unicode[STIX]{x1D71B}_{1j}(x,t)\,\text{d}x. & & \displaystyle\end{eqnarray}$$
To obtain
 $\unicode[STIX]{x1D71B}_{0}$
,
 $\unicode[STIX]{x1D71B}_{1e}$
and
 $\unicode[STIX]{x1D71B}_{1j}$
, one has to apply the boundary condition of the vertical velocity (2.4) at
 $z=0$
,
 $-1\leqslant x\leqslant 1$
, induced by the whole distribution of vorticity. On separating the three sources, one is led to the following integral equations (e.g. Newman Reference Newman1977):
 $$\begin{eqnarray}\displaystyle & \displaystyle \frac{1}{2\unicode[STIX]{x03C0}}\unicode[STIX]{x2A0D}_{-1}^{1}\frac{\unicode[STIX]{x1D71B}_{0}(\unicode[STIX]{x1D709},t)}{\unicode[STIX]{x1D709}-x}\,\text{d}\unicode[STIX]{x1D709}=v_{0}(x,t), & \displaystyle\end{eqnarray}$$
 $$\begin{eqnarray}\displaystyle & \displaystyle \frac{1}{2\unicode[STIX]{x03C0}}\unicode[STIX]{x2A0D}_{-1}^{1}\frac{\unicode[STIX]{x1D71B}_{1e}(\unicode[STIX]{x1D709},t)}{\unicode[STIX]{x1D709}-x}\,\text{d}\unicode[STIX]{x1D709}=-\frac{1}{2\unicode[STIX]{x03C0}}\int _{1}^{\infty }\frac{\unicode[STIX]{x1D71B}_{e}(\unicode[STIX]{x1D709},t)}{\unicode[STIX]{x1D709}-x}\,\text{d}\unicode[STIX]{x1D709}, & \displaystyle\end{eqnarray}$$
 $$\begin{eqnarray}\displaystyle & \displaystyle \frac{1}{2\unicode[STIX]{x03C0}}\unicode[STIX]{x2A0D}_{-1}^{1}\frac{\unicode[STIX]{x1D71B}_{1j}(\unicode[STIX]{x1D709},t)}{\unicode[STIX]{x1D709}-x}\,\text{d}\unicode[STIX]{x1D709}=\frac{\unicode[STIX]{x1D6E4}_{j}}{2\unicode[STIX]{x03C0}}\frac{x-x_{j}}{(x-x_{j})^{2}+z_{j}^{2}},\quad j=1,\ldots ,N, & \displaystyle\end{eqnarray}$$
where
 $\unicode[STIX]{x2A0D}$
denotes Cauchy’s principal value of the integral. The contribution from the unsteady planar wake,
 $\unicode[STIX]{x1D71B}_{e}$
, was derived by von Kármán and Sears (Reference von Kármán and Sears1938) using the circle plane from Joukowski conformal mapping, instead of solving (2.18), to obtain, after applying the Kutta condition at the trailing edge,
 $x=1$
,
 $$\begin{eqnarray}\displaystyle \unicode[STIX]{x1D71B}_{1e}(x,t)=\frac{1}{\unicode[STIX]{x03C0}}\int _{1}^{\infty }\sqrt{\frac{\unicode[STIX]{x1D709}+1}{\unicode[STIX]{x1D709}-1}}\sqrt{\frac{1-x}{1+x}}\frac{\unicode[STIX]{x1D71B}_{e}(\unicode[STIX]{x1D709},t)}{(\unicode[STIX]{x1D709}-x)}\,\text{d}\unicode[STIX]{x1D709}, & & \displaystyle\end{eqnarray}$$
which, integrated between
 $x=-1$
and
 $x=1$
, yields
 $$\begin{eqnarray}\displaystyle \unicode[STIX]{x1D6E4}_{1e}(t)=\int _{1}^{\infty }\left(\sqrt{\frac{\unicode[STIX]{x1D709}+1}{\unicode[STIX]{x1D709}-1}}-1\right)\unicode[STIX]{x1D71B}_{e}(\unicode[STIX]{x1D709},t)\,\text{d}\unicode[STIX]{x1D709}. & & \displaystyle\end{eqnarray}$$
The solutions to (2.17) and (2.19) satisfying (2.14) and (2.16a,b ) can be formally written as (e.g. Newman Reference Newman1977; Carrier, Krook & Pearson Reference Carrier, Krook and Pearson2005)
 $$\begin{eqnarray}\displaystyle & \displaystyle \unicode[STIX]{x1D71B}_{0}(x,t)=\frac{2}{\unicode[STIX]{x03C0}\sqrt{1-x^{2}}}\left[\frac{\unicode[STIX]{x1D6E4}_{0}(t)}{2}-\unicode[STIX]{x2A0D}_{-1}^{1}\frac{\sqrt{1-\unicode[STIX]{x1D709}^{2}}}{\unicode[STIX]{x1D709}-x}v_{0}(\unicode[STIX]{x1D709},t)\,\text{d}\unicode[STIX]{x1D709}\right], & \displaystyle\end{eqnarray}$$
 $$\begin{eqnarray}\displaystyle & \displaystyle \unicode[STIX]{x1D71B}_{1j}(x,t)=\frac{2}{\unicode[STIX]{x03C0}\sqrt{1-x^{2}}}\left[\frac{\unicode[STIX]{x1D6E4}_{1j}(t)}{2}-\frac{\unicode[STIX]{x1D6E4}_{j}(t)}{2\unicode[STIX]{x03C0}}\unicode[STIX]{x2A0D}_{-1}^{1}\frac{\sqrt{1-\unicode[STIX]{x1D709}^{2}}}{\unicode[STIX]{x1D709}-x}\frac{\unicode[STIX]{x1D709}-x_{j}(t)}{[\unicode[STIX]{x1D709}-x_{j}(t)]^{2}+z_{j}(t)^{2}}\,\text{d}\unicode[STIX]{x1D709}\right].\quad & \displaystyle\end{eqnarray}$$
On the other hand, the Kutta condition at the trailing edge, i.e. the regularity of
 $\unicode[STIX]{x1D71B}_{s}$
at the trailing edge, implies that the terms in brackets vanish, so that
 $$\begin{eqnarray}\displaystyle & \displaystyle \unicode[STIX]{x1D6E4}_{0}(t)=-2\unicode[STIX]{x2A0D}_{-1}^{1}\sqrt{\frac{1+\unicode[STIX]{x1D709}}{1-\unicode[STIX]{x1D709}}}v_{0}(\unicode[STIX]{x1D709},t)\,\text{d}\unicode[STIX]{x1D709}=2\unicode[STIX]{x03C0}\left[U\unicode[STIX]{x1D6FC}-{\dot{h}}-\left(a-\frac{1}{2}\right)\dot{\unicode[STIX]{x1D6FC}}\right], & \displaystyle\end{eqnarray}$$
 $$\begin{eqnarray}\displaystyle & \displaystyle \unicode[STIX]{x1D6E4}_{1j}(t)=C_{j}(t)\unicode[STIX]{x1D6E4}_{j}(t),\quad \text{with }C_{j}(t)\equiv -\frac{1}{\unicode[STIX]{x03C0}}\unicode[STIX]{x2A0D}_{-1}^{1}\sqrt{\frac{1+\unicode[STIX]{x1D709}}{1-\unicode[STIX]{x1D709}}}\frac{\unicode[STIX]{x1D709}-x_{j}(t)}{[\unicode[STIX]{x1D709}-x_{j}(t)]^{2}+z_{j}(t)^{2}}\,\text{d}\unicode[STIX]{x1D709}.\quad & \displaystyle\end{eqnarray}$$
On substituting (2.21) and (2.25) into (2.15), the following relation between
 $\unicode[STIX]{x1D6E4}_{0}$
,
 $\unicode[STIX]{x1D6E4}_{j}$
and
 $\unicode[STIX]{x1D71B}_{e}$
is obtained:
 $$\begin{eqnarray}\displaystyle \unicode[STIX]{x1D6E4}_{0}(t)+\mathop{\sum }_{j=1}^{N}\unicode[STIX]{x1D6E4}_{j}(t)[1+C_{j}(t)]+\int _{1}^{\infty }\sqrt{\frac{\unicode[STIX]{x1D709}+1}{\unicode[STIX]{x1D709}-1}}\unicode[STIX]{x1D71B}_{e}(\unicode[STIX]{x1D709},t)\,\text{d}\unicode[STIX]{x1D709}=0. & & \displaystyle\end{eqnarray}$$
The general expression for the vorticity distribution on the airfoil is obtained by substituting (2.20), (2.22) and (2.23), together with (2.24) and (2.25), into (2.13),
 $$\begin{eqnarray}\displaystyle \unicode[STIX]{x1D71B}_{s}(x,t) & = & \displaystyle \frac{1}{\unicode[STIX]{x03C0}}\sqrt{\frac{1-x}{1+x}}\left\{-\unicode[STIX]{x2A0D}_{-1}^{1}\left[2v_{0}(\unicode[STIX]{x1D709},t)+\mathop{\sum }_{j=1}^{N}\frac{\unicode[STIX]{x1D6E4}_{j}(t)}{\unicode[STIX]{x03C0}}\frac{\unicode[STIX]{x1D709}-x_{j}(t)}{(\unicode[STIX]{x1D709}-x_{j}(t))^{2}+z_{j}^{2}(t)}\right]\!\sqrt{\frac{1+\unicode[STIX]{x1D709}}{1-\unicode[STIX]{x1D709}}}\frac{\text{d}\unicode[STIX]{x1D709}}{\unicode[STIX]{x1D709}-x}\right.\nonumber\\ \displaystyle & & \displaystyle +\left.\int _{1}^{\infty }\sqrt{\frac{1+\unicode[STIX]{x1D709}}{\unicode[STIX]{x1D709}-1}}\frac{\unicode[STIX]{x1D71B}_{e}(\unicode[STIX]{x1D709},t)}{\unicode[STIX]{x1D709}-x}\,\text{d}\unicode[STIX]{x1D709}\right\}.\end{eqnarray}$$
It should be noted that this bound vortex-sheet strength is singular at the leading edge,
 $x=-1$
. However, we will apply in § 4.1 below the Kutta condition at the leading edge while an LEV (
 $\unicode[STIX]{x1D6E4}_{1}$
, say) is developing, so that
 $\unicode[STIX]{x1D71B}_{s}$
will also be regular at
 $x=-1$
during the fraction of the half-stroke when the LEV is growing from the leading edge.
Kelvin’s theorem (2.26) provides an integral equation for the trailing-edge vortex-sheet strength
 $\unicode[STIX]{x1D71B}_{e}$
in terms of the quasisteady circulation
 $\unicode[STIX]{x1D6E4}_{0}(t)$
, given by (2.22) as a function of the foil motion
 $v_{0}(x,t)$
, and the circulation
 $\unicode[STIX]{x1D6E4}_{j}(t)$
and trajectory
 $[x_{j}(t),z_{j}(t)]$
of each point vortex present in the flow, which have to be modelled independently (see § 4 below). Thus, (2.26)–(2.27) suffice to obtain general expressions for the lift, thrust and moment on the foil in terms of
 $v_{0}(x,t)$
,
 $\unicode[STIX]{x1D6E4}_{j}(t)$
and
 $[x_{j}(t),z_{j}(t)]$
,
 $j=1,\ldots ,N$
, which are derived next. A comment on the above particular application of the Kutta condition at the trailing edge and the general validity of (2.26)–(2.27) is given in appendix A.
3 Force and moment for arbitrary movements of the point vortices and foil
Before simplifying the above expressions for the oscillatory motion (2.1)–(2.2) of the airfoil and before implementing models for the generation and evolution of the LEVs in each stroke of the airfoil, it is instructive to write the general expressions for the forces and moment within the present linearized approximation.
To compute the temporal derivatives of terms containing
 $\unicode[STIX]{x1D71B}_{e}$
and
 $z_{e}$
, one assumes that the vorticity in the wake is convected downstream with velocity
 $U$
, so that both remain constant in a reference frame moving with the fluid (von Kármán & Sears Reference von Kármán and Sears1938; Newman Reference Newman1977),
 $$\begin{eqnarray}\displaystyle \unicode[STIX]{x1D71B}_{e}(\unicode[STIX]{x1D709},t)=\unicode[STIX]{x1D71B}_{e}(X),\quad z_{e}(\unicode[STIX]{x1D709},t)=z_{e}(X),\quad \text{with }X=\unicode[STIX]{x1D709}-Ut. & & \displaystyle\end{eqnarray}$$
Consequently, the time derivatives of the terms containing the wake vorticity
 $\unicode[STIX]{x1D71B}_{e}$
may be easily computed using Leibniz’s rule. Taking also into account the circulation conservation (2.26) and the integrals given in appendix B, one obtains the following expression for the lift (2.9):
 $$\begin{eqnarray}\displaystyle L=L_{0}+L_{1}+L_{2}+\mathop{\sum }_{j=1}^{N}L_{lj}, & & \displaystyle\end{eqnarray}$$
where
 $$\begin{eqnarray}\displaystyle L_{0}=\unicode[STIX]{x1D70C}U\unicode[STIX]{x1D6E4}_{0},\quad L_{1}=\unicode[STIX]{x03C0}\unicode[STIX]{x1D70C}(U\dot{\unicode[STIX]{x1D6FC}}-\ddot{h}-a\ddot{\unicode[STIX]{x1D6FC}}),\quad L_{2}=\unicode[STIX]{x1D70C}U\int _{1}^{\infty }\frac{\unicode[STIX]{x1D71B}_{e}}{\sqrt{\unicode[STIX]{x1D709}^{2}-1}}\,\text{d}\unicode[STIX]{x1D709} & & \displaystyle\end{eqnarray}$$
are the quasisteady lift, the apparent mass lift and the unsteady wake lift respectively obtained by von Kármán & Sears (Reference von Kármán and Sears1938), and the contribution from each
 $j$
th point vortex is
 $$\begin{eqnarray}\displaystyle L_{lj}=\unicode[STIX]{x1D70C}\left\{\!U\unicode[STIX]{x1D6E4}_{j}(1+C_{j})-\frac{\text{d}}{\text{d}t}[\unicode[STIX]{x1D6E4}_{j}(x_{j}+D_{j})]\right\}, & & \displaystyle\end{eqnarray}$$
with
 $D_{j}$
defined in (B 3) in appendix B. This last expression coincides with that derived by Li et al. (Reference Li, Bai and Wu2015) for point vortices when
 $D_{j}$
is interpreted as the
 $x$
coordinate of the image of the vortex
 $j$
inside the foil. With this proviso, although obtained from a quite different approach, it also agrees with the results of Xia & Mohseni (Reference Xia and Mohseni2013) under the constant circulation assumption, with the vortices contributing to the force through vortex convection (including the image vortices) and vortex variation. The first term of (3.4) is basically the Kutta–Joukowski theorem applied to the circulation
 $\unicode[STIX]{x1D6E4}_{j}$
of the individual vortex itself plus its induced circulation
 $\unicode[STIX]{x1D6E4}_{1j}=\unicode[STIX]{x1D6E4}_{j}C_{j}$
around the foil. The second term is the unsteady contribution to the lift force due to the motion of the vortex and its variation in intensity, including the induced vorticity on the foil. It says that positive lift on the airfoil is generated if
 $\unicode[STIX]{x1D6E4}_{j}x_{j}$
decreases in time, as happens, for instance, at the initial stages of the formation of the LEV at the beginning of each downstroke, when the LEV starts to move upstream of the leading edge (
 $x_{j}\leqslant -1$
, see § 4.1 below for the details) with its circulation
 $\unicode[STIX]{x1D6E4}_{j}$
growing in time. The opposite happens in the initial stages of the formation of the LEV during the beginning of the upstroke, where
 $\unicode[STIX]{x1D6E4}_{j}<0$
and decreases (it should be remembered that we use
 $\unicode[STIX]{x1D6E4}>0$
for a clockwise vortex), moving also upstream of the leading edge. When
 $\unicode[STIX]{x1D6E4}_{j}$
is constant, the expression coincides with the well-known vortex force produced by a free vortex (Saffman Reference Saffman1992; Alaminos-Quesada & Fernandez-Feria Reference Alaminos-Quesada and Fernandez-Feria2017). If the free vortex (
 $\unicode[STIX]{x1D6E4}_{j}$
independent of time) is far away from the foil (
 $x_{j}^{2}+z_{j}^{2}\rightarrow \infty$
), and therefore moving with the free stream velocity,
 $\text{d}x_{j}/\text{d}t=U$
, one has that
 $L_{lj}\rightarrow 0$
since both
 $C_{j}$
and
 $D_{j}$
tend to zero with the distance from the foil. Incidentally, this is the reason why we can disregard the effect on the lift force of the starting vortex at infinity in the present impulse formulation.
The lift expression (3.2) can be rewritten in a more convenient form by grouping together
 $L_{0}$
and the first term in
 $L_{li}$
after using the total circulation conservation (2.26),
 $$\begin{eqnarray}\displaystyle L=L_{a}+L_{e}+\mathop{\sum }_{j=1}^{N}L_{j}, & & \displaystyle\end{eqnarray}$$
where
 $L_{a}\equiv L_{1}$
is the added mass term given in (3.3) and the net contributions from the wake and each point vortex
 $j$
are respectively
 $$\begin{eqnarray}\displaystyle & \displaystyle L_{e}=-\unicode[STIX]{x1D70C}U\int _{1}^{\infty }\frac{\unicode[STIX]{x1D709}\unicode[STIX]{x1D71B}_{e}}{\sqrt{\unicode[STIX]{x1D709}^{2}-1}}\,\text{d}\unicode[STIX]{x1D709}, & \displaystyle\end{eqnarray}$$
 $$\begin{eqnarray}\displaystyle & \displaystyle L_{j}=-\unicode[STIX]{x1D70C}\frac{\text{d}}{\text{d}t}[\unicode[STIX]{x1D6E4}_{j}(x_{j}+D_{j})]. & \displaystyle\end{eqnarray}$$
It should be noted, however, that the effect of the point vortices on the wake vorticity distribution
 $\unicode[STIX]{x1D71B}_{e}$
has to be obtained from (2.26).
Similarly, by using some of the integrals given in appendix B, the drag (2.8) can be written as
 $$\begin{eqnarray}\displaystyle D & = & \displaystyle \unicode[STIX]{x1D70C}\mathop{\sum }_{j=1}^{N}\frac{\text{d}}{\text{d}t}\{\unicode[STIX]{x1D6E4}_{j}[z_{j}+(h+a\unicode[STIX]{x1D6FC})C_{j}-\unicode[STIX]{x1D6FC}D_{j}]\}+\unicode[STIX]{x1D70C}\frac{\text{d}}{\text{d}t}[(h+a\unicode[STIX]{x1D6FC})\unicode[STIX]{x1D6E4}_{0}]-\unicode[STIX]{x03C0}\unicode[STIX]{x1D70C}\frac{\text{d}}{\text{d}t}[\unicode[STIX]{x1D6FC}({\dot{h}}+a\dot{\unicode[STIX]{x1D6FC}}-U\unicode[STIX]{x1D6FC})]\nonumber\\ \displaystyle & & \displaystyle +\,\unicode[STIX]{x1D70C}\frac{\text{d}}{\text{d}t}\int _{1}^{\infty }\unicode[STIX]{x1D71B}_{e}\left[\left(\sqrt{\frac{\unicode[STIX]{x1D709}+1}{\unicode[STIX]{x1D709}-1}}-1\right)(h+a\unicode[STIX]{x1D6FC})-(\sqrt{\unicode[STIX]{x1D709}^{2}-1}-\unicode[STIX]{x1D709})\unicode[STIX]{x1D6FC}+z_{e}\right]\,\text{d}\unicode[STIX]{x1D709}.\end{eqnarray}$$
For the vertical displacement of the wake
 $z_{e}$
, we assume that it coincides with the trailing-edge location at the time
 $t^{\prime }=t+(1-\unicode[STIX]{x1D709})/U$
when it was shed from the airfoil,
 $z_{s}(x=1,t^{\prime })$
, i.e.
 $$\begin{eqnarray}\displaystyle z_{e}(X)=h\left(\frac{1-X}{U}\right)-(1-a)\unicode[STIX]{x1D6FC}\left(\frac{1-X}{U}\right). & & \displaystyle\end{eqnarray}$$
Thus,
 $$\begin{eqnarray}\displaystyle \frac{\text{d}}{\text{d}t}\int _{1}^{\infty }z_{e}\unicode[STIX]{x1D71B}_{e}\,\text{d}\unicode[STIX]{x1D709}=U[h(t)-(1-a)\unicode[STIX]{x1D6FC}(t)]\unicode[STIX]{x1D71B}_{e}(\unicode[STIX]{x1D709}=1,t). & & \displaystyle\end{eqnarray}$$
Using also (2.26) and (3.3)–(3.4), the thrust
 $T=-D$
from (3.8) can be written as
 $$\begin{eqnarray}\displaystyle T=-\unicode[STIX]{x1D6FC}L+T_{1}+T_{2}+\mathop{\sum }_{j=1}^{N}T_{lj}, & & \displaystyle\end{eqnarray}$$
where
 $$\begin{eqnarray}\displaystyle T_{1}=\unicode[STIX]{x03C0}\unicode[STIX]{x1D70C}\dot{\unicode[STIX]{x1D6FC}}({\dot{h}}+a\dot{\unicode[STIX]{x1D6FC}}-\unicode[STIX]{x1D6FC}U),\quad T_{2}=\unicode[STIX]{x1D70C}\int _{1}^{\infty }[{\dot{h}}+\dot{\unicode[STIX]{x1D6FC}}(\sqrt{\unicode[STIX]{x1D709}^{2}-1}-\unicode[STIX]{x1D709}+a)-\unicode[STIX]{x1D6FC}U]\unicode[STIX]{x1D71B}_{e}\,\text{d}\unicode[STIX]{x1D709}, & & \displaystyle \nonumber\\ \displaystyle & & \displaystyle\end{eqnarray}$$
 $$\begin{eqnarray}\displaystyle T_{lj}=\unicode[STIX]{x1D70C}\frac{\text{d}}{\text{d}t}[\unicode[STIX]{x1D6E4}_{j}(h+a\unicode[STIX]{x1D6FC}-z_{j}-\unicode[STIX]{x1D6FC}x_{j})]+\unicode[STIX]{x1D70C}\dot{\unicode[STIX]{x1D6FC}}\unicode[STIX]{x1D6E4}_{j}(x_{j}+D_{j}). & & \displaystyle\end{eqnarray}$$
The first term in (3.11) is the component in the flight direction of the force normal to the airfoil, with
 $L$
given by (3.2). The second and third terms are the contributions to the thrust from the apparent mass and the vorticity distribution in the wake respectively, already obtained in Fernandez-Feria (Reference Fernandez-Feria2016), while the fourth term is the contribution from the point vortices. It should be noted that the length in the first term of (3.13),
 $h+a\unicode[STIX]{x1D6FC}-z_{j}-\unicode[STIX]{x1D6FC}x_{j}$
, is minus the vertical position of the point vortex in relation to the plate,
 $z_{s}(x_{j})-z_{j}$
, if
 $-1\leqslant x_{j}\leqslant 1$
.
Part of the contribution from the vortex
 $j$
is actually included in the first term of (3.11) (inside
 $L$
). Thus, it is convenient to use (3.5) and rewrite the thrust in a similar fashion to the lift (3.5),
 $$\begin{eqnarray}\displaystyle T=T_{a}+T_{e}+\mathop{\sum }_{j=1}^{N}T_{j}, & & \displaystyle\end{eqnarray}$$
where
 $$\begin{eqnarray}\displaystyle T_{a}=-\unicode[STIX]{x1D6FC}L_{a}+T_{1}=\unicode[STIX]{x03C0}\unicode[STIX]{x1D70C}\frac{\text{d}}{\text{d}t}[\unicode[STIX]{x1D6FC}({\dot{h}}+a\dot{\unicode[STIX]{x1D6FC}}-\unicode[STIX]{x1D6FC}U)] & & \displaystyle\end{eqnarray}$$
is the added mass thrust,
 $$\begin{eqnarray}\displaystyle T_{e}=-\unicode[STIX]{x1D6FC}L_{e}+T_{2}=\unicode[STIX]{x1D70C}\int _{1}^{\infty }\left[{\dot{h}}+\dot{\unicode[STIX]{x1D6FC}}(\sqrt{\unicode[STIX]{x1D709}^{2}-1}-\unicode[STIX]{x1D709}+a)-\unicode[STIX]{x1D6FC}U\left(1+\frac{\unicode[STIX]{x1D709}}{\sqrt{\unicode[STIX]{x1D709}^{2}-1}}\right)\right]\unicode[STIX]{x1D71B}_{e}\,\text{d}\unicode[STIX]{x1D709} & & \displaystyle \nonumber\\ \displaystyle & & \displaystyle\end{eqnarray}$$
is the contribution from the unsteady wake and
 $$\begin{eqnarray}\displaystyle T_{j}=\unicode[STIX]{x1D70C}\frac{\text{d}}{\text{d}t}\{\unicode[STIX]{x1D6E4}_{j}[z_{s}(x_{j})-z_{j}+\unicode[STIX]{x1D6FC}(x_{j}+D_{j})]\} & & \displaystyle\end{eqnarray}$$
is the contribution from the point vortex
 $j$
(it should be noted that there is an additional contribution of the point vortices in
 $\unicode[STIX]{x1D71B}_{e}$
through the total circulation conservation (2.26)). For a free vortex (
 $\unicode[STIX]{x1D6E4}_{j}$
constant),
 $T_{j}$
is proportional to minus the temporal variation of the vertical distance of the vortex from the plate, plus a similar contribution coming from the induced vorticity on the plate, whose vertical distance is represented by
 $-\unicode[STIX]{x1D6FC}D_{j}$
. In general, this term
 $T_{j}$
contributes to positive thrust when
 $-\unicode[STIX]{x1D6E4}_{j}z_{j}$
increases, so that the formation of the LEV generates negative thrust at the initial stages of both the downstroke and the upstroke (see § 5 below for more details).
Finally, using the above expressions and some integrals from appendix B, the moment (2.12) can be written as
 $$\begin{eqnarray}\displaystyle M=M_{a}+M_{e}+\mathop{\sum }_{j=1}^{N}M_{j}, & & \displaystyle\end{eqnarray}$$
where
 $$\begin{eqnarray}\displaystyle M_{a}=-\unicode[STIX]{x1D70C}\frac{\text{d}}{\text{d}t}\left[\frac{a}{2}(\unicode[STIX]{x03C0}\dot{\unicode[STIX]{x1D6FC}}-\unicode[STIX]{x1D6E4}_{0})+\frac{\unicode[STIX]{x03C0}\dot{\unicode[STIX]{x1D6FC}}}{8}\right] & & \displaystyle\end{eqnarray}$$
is the contribution from the added mass,
 $$\begin{eqnarray}\displaystyle M_{e}=\frac{1}{2}\unicode[STIX]{x1D70C}U\int _{1}^{\infty }\frac{1-2a\unicode[STIX]{x1D709}}{\sqrt{\unicode[STIX]{x1D709}^{2}-1}}\unicode[STIX]{x1D71B}_{e}\,\text{d}\unicode[STIX]{x1D709} & & \displaystyle\end{eqnarray}$$
is the contribution from the unsteady wake and
 $$\begin{eqnarray}\displaystyle M_{j}=\unicode[STIX]{x1D70C}\frac{\text{d}}{\text{d}t}\left\{\!\unicode[STIX]{x1D6E4}_{j}\left[\frac{x_{j}^{2}}{2}+\frac{E_{j}}{2}-\frac{1}{4}-a(x_{j}+D_{j})\right]\right\} & & \displaystyle\end{eqnarray}$$
is the contribution from the point vortex
 $j$
, with
 $E_{j}$
defined in (B 4) in appendix B.
4 Evolution of the point vortices, including the developing LEV
4.1 General model
In the above general expressions, the contribution of each point vortex
 $j$
to the lift, thrust and moment on the airfoil depends on time through the vortex intensity
 $\unicode[STIX]{x1D6E4}_{j}(t)$
and its trajectory
 $[x_{j}(t),z_{j}(t)]$
. Part of this dependence is inside the integrals
 $C_{j}[x_{j}(t),z_{j}(t)]$
,
 $D_{j}[x_{j}(t),z_{j}(t)]$
and
 $E_{j}[x_{j}(t),z_{j}(t)]$
defined in (2.25), (B 3) and (B 4) respectively. In addition, the wake vorticity
 $\unicode[STIX]{x1D71B}_{e}$
is also affected by the evolution of this point vortex
 $j$
through Kelvin’s theorem (2.26). Therefore, one needs three additional equations for each point vortex to obtain
 $\unicode[STIX]{x1D6E4}_{j}(t)$
,
 $x_{j}(t)$
and
 $z_{j}(t)$
, which have to be solved together with the integral equation (2.26) for
 $\unicode[STIX]{x1D71B}_{e}(x,t)$
, with
 $\unicode[STIX]{x1D6E4}_{0}(t)$
given by (2.24), once the vertical movement of the airfoil
 $v_{0}(x,t)$
is prescribed.
As a first simplification to the problem, it is assumed that, during each half-stroke, there is only one developing LEV, labelled by
 $j=1$
. The remaining vortices,
 $j=2,\ldots ,N$
, have already been shed, so that they move with the Kirchhoff velocity and their intensities are frozen (Tchieu & Leonard Reference Tchieu and Leonard2011; Wang & Eldredge Reference Wang and Eldredge2013),
 $$\begin{eqnarray}\displaystyle \frac{\text{d}\unicode[STIX]{x1D6E4}_{j}}{\text{d}t}=0\,,\quad \frac{\text{d}x_{j}}{\text{d}t}-\text{i}\frac{\text{d}z_{j}}{\text{d}t}=\mathsf{v}^{\ast }[\mathsf{z}_{j}(t)],\quad j=2,3,\ldots , & & \displaystyle\end{eqnarray}$$
where
 $\mathsf{z}_{j}=x_{j}+\text{i}z_{j}$
is the position of the point vortex
 $j$
on the complex plane and
 $$\begin{eqnarray}\displaystyle \mathsf{v}^{\ast }[\mathsf{z}_{j}(t)] & \equiv & \displaystyle \bar{u}_{j}-\text{i}\bar{v}_{j}=U-\frac{\text{i}}{2\unicode[STIX]{x03C0}}\int _{-1}^{1}\unicode[STIX]{x1D71B}_{s}(x,t)\frac{\text{d}x}{x-\mathsf{z}_{j}}\nonumber\\ \displaystyle & & \displaystyle -\,\frac{\text{i}}{2\unicode[STIX]{x03C0}}\int _{1}^{\infty }\unicode[STIX]{x1D71B}_{e}(x,t)\frac{\text{d}x}{x-\mathsf{z}_{j}}+\mathop{\sum }_{k\neq j}\frac{\text{i}\unicode[STIX]{x1D6E4}_{k}}{2\unicode[STIX]{x03C0}(\mathsf{z}_{j}-\mathsf{z}_{k})}\end{eqnarray}$$
is the complex conjugate velocity at the vortex centre
 $\mathsf{z}_{j}$
excluding the self-contribution of the vortex. The initial conditions for these differential equations are the values of
 $\unicode[STIX]{x1D6E4}_{j}$
,
 $x_{j}$
and
 $z_{j}$
at the shedding instant
 $t_{js}$
,
 $j=2,3,\ldots .$
Since
 $\unicode[STIX]{x1D6E4}_{1}$
is developing from the sharp leading edge, one has to apply the Kutta condition at
 $x=-1$
to remove the singularity of
 $\unicode[STIX]{x1D71B}_{s}$
given by (2.27). It should be noted that this condition has already been applied at the trailing edge, where the unsteady wake is continuously generated, in the derivation of
 $\unicode[STIX]{x1D71B}_{0}$
,
 $\unicode[STIX]{x1D71B}_{1j}$
and
 $\unicode[STIX]{x1D71B}_{1e}$
, so that
 $\unicode[STIX]{x1D71B}_{s}$
given by (2.27) is not singular at
 $x=1$
. Thus, (2.27) has to be regular also at the leading edge while
 $|\unicode[STIX]{x1D6E4}_{1}|$
is growing, which means that the term inside brackets has to vanish at
 $x=-1$
,
 $$\begin{eqnarray}\displaystyle \unicode[STIX]{x2A0D}_{-1}^{1}\left[2v_{0}(\unicode[STIX]{x1D709},t)+\mathop{\sum }_{j=1}^{N}\frac{\unicode[STIX]{x1D6E4}_{j}(t)}{\unicode[STIX]{x03C0}}\frac{\unicode[STIX]{x1D709}-x_{j}(t)}{(\unicode[STIX]{x1D709}-x_{j}(t))^{2}+z_{j}^{2}(t)}\right]\frac{\text{d}\unicode[STIX]{x1D709}}{\sqrt{1-\unicode[STIX]{x1D709}^{2}}}=\int _{1}^{\infty }\frac{\unicode[STIX]{x1D71B}_{e}(\unicode[STIX]{x1D709},t)}{\sqrt{\unicode[STIX]{x1D709}^{2}-1}}\,\text{d}\unicode[STIX]{x1D709}. & & \displaystyle\end{eqnarray}$$
This additional relation is similar to (2.26) and can be written as
 $$\begin{eqnarray}\displaystyle \unicode[STIX]{x1D6E4}_{0}-\unicode[STIX]{x03C0}\dot{\unicode[STIX]{x1D6FC}}+\mathop{\sum }_{j=1}^{N}\unicode[STIX]{x1D6E4}_{j}B_{j}+\int _{1}^{\infty }\frac{\unicode[STIX]{x1D71B}_{e}(\unicode[STIX]{x1D709},t)}{\sqrt{\unicode[STIX]{x1D709}^{2}-1}}\,\text{d}\unicode[STIX]{x1D709}=0, & & \displaystyle\end{eqnarray}$$
where
 $$\begin{eqnarray}\displaystyle B_{j}\equiv -\frac{1}{\unicode[STIX]{x03C0}}\unicode[STIX]{x2A0D}_{-1}^{1}\frac{\unicode[STIX]{x1D709}-x_{j}}{(\unicode[STIX]{x1D709}-x_{j})^{2}+z_{j}^{2}}\frac{\text{d}\unicode[STIX]{x1D709}}{\sqrt{1-\unicode[STIX]{x1D709}^{2}}}. & & \displaystyle\end{eqnarray}$$
With this new condition, the vorticity distribution (2.27) is now also regular at the leading edge,
 $x=-1$
, and can be written as
 $$\begin{eqnarray}\displaystyle \unicode[STIX]{x1D71B}_{s}(x,t) & = & \displaystyle \frac{1}{\unicode[STIX]{x03C0}}\sqrt{1-x^{2}}\left[2\unicode[STIX]{x03C0}\dot{\unicode[STIX]{x1D6FC}}-\mathop{\sum }_{j=1}^{N}\frac{\unicode[STIX]{x1D6E4}_{j}(t)}{\unicode[STIX]{x03C0}}\unicode[STIX]{x2A0D}_{-1}^{1}\frac{\unicode[STIX]{x1D709}-x_{j}(t)}{(\unicode[STIX]{x1D709}-x_{j}(t))^{2}+z_{j}^{2}(t)}\frac{\text{d}\unicode[STIX]{x1D709}}{\sqrt{1-\unicode[STIX]{x1D709}^{2}}(\unicode[STIX]{x1D709}-x)}\right.\nonumber\\ \displaystyle & & \displaystyle +\left.\int _{1}^{\infty }\frac{\unicode[STIX]{x1D71B}_{e}(\unicode[STIX]{x1D709},t)}{\sqrt{\unicode[STIX]{x1D709}^{2}-1}(\unicode[STIX]{x1D709}-x)}\,\text{d}\unicode[STIX]{x1D709}\right].\end{eqnarray}$$
As the two additional conditions for
 $\unicode[STIX]{x1D6E4}_{1}$
,
 $x_{1}$
and
 $z_{1}$
we shall use the Brown–Michael (Reference Brown and Michael1954) equation, which ensures the momentum conservation around the vortex and the branch cut between the point vortex and the leading edge (Michelin & Llewellyn Smith Reference Michelin and Llewellyn Smith2009),
 $$\begin{eqnarray}\displaystyle \frac{\text{d}\mathsf{z}_{1}}{\text{d}t}+\frac{\mathsf{z}_{1}-\mathsf{z}_{10}}{\unicode[STIX]{x1D6E4}_{1}}\frac{\text{d}\unicode[STIX]{x1D6E4}_{1}}{\text{d}t}=\mathsf{v}(\mathsf{z}_{1}), & & \displaystyle\end{eqnarray}$$
where
 $\mathsf{v}(\mathsf{z}_{1})=\bar{u}_{1}+\text{i}\bar{v}_{1}$
is given by (4.2) for
 $\mathsf{z}_{1}=x_{1}+\text{i}z_{1}$
. These are two differential equations which have to be solved with the initial condition at the beginning of each half-stroke,
 $t=t_{i}$
,
 $$\begin{eqnarray}\displaystyle \unicode[STIX]{x1D6E4}_{1}(t_{i})=0,\quad x_{1}(t_{i})=x_{10}=-1,\quad z_{1}(t_{i})=z_{10}(t_{i})=z_{s}(-1,t_{i}), & & \displaystyle\end{eqnarray}$$
where
 $t_{i}$
is given by
 $$\begin{eqnarray}\displaystyle \left.\frac{\text{d}z_{s}}{\text{d}t}\right|_{x=-1,t=t_{i}}={\dot{h}}(t_{i})+(1+a)\dot{\unicode[STIX]{x1D6FC}}(t_{i})=0. & & \displaystyle\end{eqnarray}$$
The point vortex with growing circulation
 $\unicode[STIX]{x1D6E4}_{1}(t)$
is shed when
 $\unicode[STIX]{x1D6E4}_{1}$
reaches an extremum value,
 $\text{d}\unicode[STIX]{x1D6E4}_{1}/\text{d}t=0$
. After that, the circulation remains constant and, according to (4.7), the vortex travels with the Kirchhoff velocity. This shedding criterion is that when the strength of a vortex reaches an extremum, it is frozen at that value and the vortex subsequently moves according to the Kirchhoff velocity, avoids a discontinuity in the temporal variation of the impulse, and therefore in the force. One could have used, instead of the Brown–Michael equation (4.7), the impulse matching model of Wang and Eldredge (Reference Wang and Eldredge2013), which avoids this discontinuity even when the vortex is shed without reaching an extremum intensity. However, it would need an additional, experimentally or numerically based, shedding condition which would have complicated the formulation.
On the other hand, any vortex-shedding model based on just three parameters, like the present one, namely the circulation
 $\unicode[STIX]{x1D6E4}_{1}$
of a point vortex moving with trajectory
 $[x_{1}(t),z_{1}(t)]$
from the leading edge, cannot satisfy at the same time the Kutta condition at the sharp edge, and the conservation around the vortex and branch cut between the leading edge and the vortex of the linear momentum in both directions and the angular momentum. The Brown–Michael (Reference Brown and Michael1954) model satisfies the conservation of linear momentum (Michelin & Llewellyn Smith Reference Michelin and Llewellyn Smith2009), avoiding a spurious net force on the foil, but introducing a spurious torque (Brown & Michael Reference Brown and Michael1954; Howe Reference Howe1996; Michelin & Llewellyn Smith Reference Michelin and Llewellyn Smith2009; Tchieu & Leonard Reference Tchieu and Leonard2011). Howe (Reference Howe1996) developed an alternative approach satisfying the conservation of angular momentum, more appropriate to determine sound generation. We think that the Brown–Michael model is more appropriate here where the main aim is to determine the forces on the foil.
4.2 Simplified model. Non-dimensional variables
To simplify the problem, we shall only consider the effect of the growing LEV with circulation
 $\unicode[STIX]{x1D6E4}_{1}(t)$
at each half-stroke, disregarding the effect of the remaining, already shed, vortices. In addition, to simplify the notation, we shall only use, from this point on, non-dimensional variables. All lengths are already scaled with the semichord
 $c/2$
. The remaining non-dimensional variables are (the same letter is used in most of them for the sake of simplicity)
 $$\begin{eqnarray}\displaystyle t\leftarrow \frac{2tU}{c},\quad \bar{u}_{1},\bar{v}_{1}\leftarrow \frac{\bar{u}_{1}}{U},\frac{\bar{v}_{1}}{U},\quad \unicode[STIX]{x1D6E4}_{1}\leftarrow \frac{\unicode[STIX]{x1D6E4}_{1}}{Uc/2},\quad \text{etc.} & & \displaystyle\end{eqnarray}$$
From (4.9) and (2.2)–(2.3), the non-dimensional initial time
 $t_{i}$
at the beginning of each half-stroke is given by
 $$\begin{eqnarray}\displaystyle kt_{i}=\arctan \left[-\frac{(1+a)a_{0}\sin \unicode[STIX]{x1D719}}{h_{0}+(1+a)a_{0}\cos \unicode[STIX]{x1D719}}\right]\pm n\unicode[STIX]{x03C0},\quad n=0,1,2,\ldots , & & \displaystyle\end{eqnarray}$$
where
 $$\begin{eqnarray}\displaystyle k=\frac{c\unicode[STIX]{x1D714}}{2U} & & \displaystyle\end{eqnarray}$$
is the reduced frequency (it should be noted that
 $kt_{i}$
with
 $t_{i}$
non-dimensional is equal to
 $\unicode[STIX]{x1D714}t_{i}$
with
 $t_{i}$
dimensional). For a pure heaving motion,
 $kt_{i}=\pm n\unicode[STIX]{x03C0}$
, while for a pure pitching motion,
 $kt_{i}=-\unicode[STIX]{x1D719}\pm n\unicode[STIX]{x03C0}$
, but we may set
 $\unicode[STIX]{x1D719}=0$
since there is no combined motion. It should be noted that the non-dimensional half-period is
 $\unicode[STIX]{x03C0}/k$
.
For each half-stroke, we reset the non-dimensional time by using
 $$\begin{eqnarray}\displaystyle \unicode[STIX]{x1D70F}=t-t_{i} & & \displaystyle\end{eqnarray}$$
and define
 $$\begin{eqnarray}\displaystyle \unicode[STIX]{x1D703}(\unicode[STIX]{x1D70F})=x_{10}-x_{1}=-1-x_{1}(t),\quad \unicode[STIX]{x1D701}(\unicode[STIX]{x1D70F})=z_{1}(t)-z_{10}(t)=z_{1}(t)-[h(t)+(1+a)\unicode[STIX]{x1D6FC}(t)], & & \displaystyle \nonumber\\ \displaystyle & & \displaystyle\end{eqnarray}$$
with initial conditions
 $$\begin{eqnarray}\displaystyle \unicode[STIX]{x1D703}(0)=\unicode[STIX]{x1D701}(0)=0. & & \displaystyle\end{eqnarray}$$
For the initial stages of the developing LEV, it is assumed that
 $$\begin{eqnarray}\displaystyle 0\leqslant \unicode[STIX]{x1D703}\ll 1,\quad |\unicode[STIX]{x1D701}|\ll 1, & & \displaystyle\end{eqnarray}$$
the last condition being implied by the present linearized formulation, where
 $|z_{1}|\ll 1$
. In fact, we shall use below
 $z_{1}$
, and then substitute it by
 $\unicode[STIX]{x1D701}$
according to (4.14).
From (2.25), neglecting terms of order
 $z_{1}^{2}$
, one obtains
 $$\begin{eqnarray}\displaystyle C_{1}\simeq -1+\sqrt{\frac{x_{1}+1}{x_{1}-1}}\simeq -1+\sqrt{\frac{\unicode[STIX]{x1D703}}{2}}. & & \displaystyle\end{eqnarray}$$
Consequently, from Kelvin’s circulation theorem (2.26), the growing LEV has a negligible effect on the wake vorticity
 $\unicode[STIX]{x1D71B}_{e}$
when
 $\unicode[STIX]{x1D703}\ll 1$
, so that
 $\unicode[STIX]{x1D71B}_{e}$
depends, in first approximation, only on
 $\unicode[STIX]{x1D6E4}_{0}$
,
 $$\begin{eqnarray}\displaystyle \int _{1}^{\infty }\sqrt{\frac{\unicode[STIX]{x1D709}+1}{\unicode[STIX]{x1D709}-1}}\unicode[STIX]{x1D71B}_{e}(\unicode[STIX]{x1D709},t)\,\text{d}\unicode[STIX]{x1D709}\simeq -\unicode[STIX]{x1D6E4}_{0}(t). & & \displaystyle\end{eqnarray}$$
From (2.24), and for the oscillatory motion (2.2)–(2.3),
 $\unicode[STIX]{x1D6E4}_{0}$
can be written in non-dimensional form as
 $$\begin{eqnarray}\displaystyle \unicode[STIX]{x1D6E4}_{0}(t)=G_{0}\text{e}^{\text{i}kt},\quad G_{0}=2\unicode[STIX]{x03C0}[\unicode[STIX]{x1D6FC}_{0}-\text{i}kh_{0}-\text{i}k(a-1/2)\unicode[STIX]{x1D6FC}_{0}]. & & \displaystyle\end{eqnarray}$$
Thus, (A 2) has the well-known solution (Theodorsen Reference Theodorsen1935; von Kármán & Sears Reference von Kármán and Sears1938)
 $$\begin{eqnarray}\displaystyle & \displaystyle \unicode[STIX]{x1D71B}_{e}(\unicode[STIX]{x1D709},t)=g\text{e}^{\text{i}k(t-\unicode[STIX]{x1D709})}, & \displaystyle\end{eqnarray}$$
 $$\begin{eqnarray}\displaystyle & \displaystyle g=-\frac{G_{0}}{\displaystyle \int _{1}^{\infty }\sqrt{\frac{\unicode[STIX]{x1D709}+1}{\unicode[STIX]{x1D709}-1}}\text{e}^{-\text{i}k\unicode[STIX]{x1D709}}\,\text{d}\unicode[STIX]{x1D709}}=\frac{2G_{0}}{\unicode[STIX]{x03C0}}\frac{1}{\text{i}H_{0}^{(2)}(k)+H_{1}^{(2)}(k)}, & \displaystyle\end{eqnarray}$$
where
 $H_{n}^{(2)}(z)=J_{n}(z)-\text{i}Y_{n}(z)$
,
 $n=0,1$
, are Hankel functions, related to the Bessel functions
 $J_{n}$
and
 $Y_{n}$
(see, e.g., Olver & Maximon Reference Olver, Maximon, Olver, Lozier, Boisvert and Clark2010).
From the Kutta condition (4.4) at the leading edge, one can obtain
 $\unicode[STIX]{x1D6E4}_{1}$
as a function of the position of the vortex and the parameters of the problem. To that end, one has first to compute the integral (4.5) defining
 $B_{1}$
and the integral involving
 $\unicode[STIX]{x1D71B}_{e}$
in (4.4). Neglecting terms of
 $O(z_{1})^{2}$
,
 $B_{1}$
is given by
 $$\begin{eqnarray}\displaystyle B_{1}\simeq -\frac{1}{\sqrt{2\unicode[STIX]{x1D703}}}, & & \displaystyle\end{eqnarray}$$
while
 $$\begin{eqnarray}\displaystyle \int _{1}^{\infty }\frac{\unicode[STIX]{x1D71B}_{e}(\unicode[STIX]{x1D709},t)}{\sqrt{\unicode[STIX]{x1D709}^{2}-1}}\,\text{d}\unicode[STIX]{x1D709}=-\text{i}\unicode[STIX]{x1D6E4}_{0}\frac{H_{0}^{(2)}(k)}{\text{i}H_{0}^{(2)}(k)+H_{1}^{(2)}(k)}, & & \displaystyle\end{eqnarray}$$
which, after substituting in (4.4), yields
 $$\begin{eqnarray}\displaystyle \unicode[STIX]{x1D6E4}_{1}(t)\simeq \sqrt{2\unicode[STIX]{x1D703}(t)}[\unicode[STIX]{x1D6E4}_{0}(t)C(k)-\unicode[STIX]{x03C0}\dot{\unicode[STIX]{x1D6FC}}]=\sqrt{2\unicode[STIX]{x1D703}(t)}{\mathcal{G}}(t), & & \displaystyle\end{eqnarray}$$
where
 $$\begin{eqnarray}\displaystyle {\mathcal{G}}\equiv \unicode[STIX]{x1D6E4}_{0}C-\unicode[STIX]{x03C0}\dot{\unicode[STIX]{x1D6FC}}=2\unicode[STIX]{x03C0}[\unicode[STIX]{x1D6FC}-{\dot{h}}-(a-{\textstyle \frac{1}{2}})\dot{\unicode[STIX]{x1D6FC}}]C(k)-\unicode[STIX]{x03C0}\dot{\unicode[STIX]{x1D6FC}} & & \displaystyle\end{eqnarray}$$
and
 $$\begin{eqnarray}\displaystyle C(k)\equiv \frac{H_{1}^{(2)}(k)}{\text{i}H_{0}^{(2)}(k)+H_{1}^{(2)}(k)}\equiv F(k)+\text{i}G(k) & & \displaystyle\end{eqnarray}$$
is the Theodorsen function (Theodorsen Reference Theodorsen1935; Garrick Reference Garrick1938). (It is understood that one has to take the real parts of all of the complex quantities separately.) This expression for
 $\unicode[STIX]{x1D6E4}_{1}$
says that, at the initial stages, the LEV approximately grows as the square root of the distance from the leading edge
 $\unicode[STIX]{x1D703}$
, but modulated by the oscillatory motion of the airfoil through
 ${\mathcal{G}}(t)$
.
To write the equations for
 $x_{1}(t)$
and
 $z_{1}(t)$
(or
 $\unicode[STIX]{x1D701}(t)$
) from the Brown–Michael equation (4.7), we need the Kirchhoff velocity components
 $\bar{u}_{1}$
and
 $\bar{v}_{1}$
, which are obtained from the non-dimensional form of (4.2). Since the single LEV is very close to the leading edge, we shall only consider the effect of the vorticity distribution (4.6) on the foil generated by the foil movement, i.e.
 $\unicode[STIX]{x1D71B}_{s}(x,t)\approx \unicode[STIX]{x1D71B}_{0}(x,s)=2\dot{\unicode[STIX]{x1D6FC}}\sqrt{1-x^{2}}$
. Thus,
 $$\begin{eqnarray}\displaystyle \mathsf{v}^{\ast }[\mathsf{z}_{1}(t)]\equiv \bar{u}_{1}-\text{i}\bar{v}_{1}\simeq 1-\frac{\text{i}\dot{\unicode[STIX]{x1D6FC}}}{\unicode[STIX]{x03C0}}\int _{-1}^{1}\frac{\sqrt{1-x^{2}}}{x-\mathsf{z}_{1}}=1+\text{i}\dot{\unicode[STIX]{x1D6FC}}\mathsf{z}_{1}\left(1-\sqrt{1-\frac{1}{\mathsf{z}_{1}^{2}}}\right). & & \displaystyle\end{eqnarray}$$
To be consistent with the present linearized theory, one may neglect terms of order
 $z_{1}^{2}$
to write
 $$\begin{eqnarray}\displaystyle \bar{u}_{1}-\text{i}\bar{v}_{1}\simeq 1+\frac{z_{1}\dot{\unicode[STIX]{x1D6FC}}}{\sqrt{x_{1}^{2}-1}}\left(\frac{x_{1}^{2}}{|x_{1}|}-\sqrt{x_{1}^{2}-1}\right)+\text{i}\dot{\unicode[STIX]{x1D6FC}}\left(x_{1}-\frac{x_{1}}{|x_{1}|}\sqrt{x_{1}^{2}-1}\right). & & \displaystyle\end{eqnarray}$$
On substituting these expressions for
 $\bar{u}_{1}$
and
 $\bar{v_{1}}$
, together with (4.24) and (4.14), into the Brown–Michael equation (4.7), two differential equations for
 $\unicode[STIX]{x1D703}(\unicode[STIX]{x1D70F})$
and
 $\unicode[STIX]{x1D701}(\unicode[STIX]{x1D70F})$
result,
 $$\begin{eqnarray}\displaystyle \frac{\text{d}}{\text{d}\unicode[STIX]{x1D70F}}(\unicode[STIX]{x1D703}^{3/2}{\mathcal{G}})=-{\mathcal{G}}\unicode[STIX]{x1D703}^{1/2}\bar{u}_{1},\quad \frac{\text{d}}{\text{d}\unicode[STIX]{x1D70F}}(\unicode[STIX]{x1D701}\unicode[STIX]{x1D703}^{1/2}{\mathcal{G}})={\mathcal{G}}\unicode[STIX]{x1D703}^{1/2}\left(\bar{v}_{1}-\frac{\text{d}z_{10}}{\text{d}\unicode[STIX]{x1D70F}}\right), & & \displaystyle\end{eqnarray}$$
which have to be solved numerically with the initial conditions (4.15). For small
 $\unicode[STIX]{x1D703}$
, (4.28) can be approximated by
 $$\begin{eqnarray}\displaystyle \bar{u}_{1}\simeq 1+\frac{z_{1}\dot{\unicode[STIX]{x1D6FC}}}{\sqrt{2\unicode[STIX]{x1D703}}}\left(1-\sqrt{2\unicode[STIX]{x1D703}}+\frac{3}{4}\unicode[STIX]{x1D703}\right),\quad \bar{v}_{1}\simeq \dot{\unicode[STIX]{x1D6FC}}(1-\sqrt{2\unicode[STIX]{x1D703}}+\unicode[STIX]{x1D703}). & & \displaystyle\end{eqnarray}$$
Since
 $\unicode[STIX]{x1D70F}=0$
is a singular point of the equations, the numerical integration has to be started from an analytical approximation for
 $\unicode[STIX]{x1D70F}\ll 1$
. Retaining only the leading terms in (4.30) for
 $\unicode[STIX]{x1D703}\ll 1$
and
 $\unicode[STIX]{x1D701}\ll 1$
(see (4.14)), the lowest order of (4.29) can be written as
 $$\begin{eqnarray}\displaystyle \frac{\text{d}}{\text{d}\unicode[STIX]{x1D70F}}(\unicode[STIX]{x1D703}^{3/2}{\mathcal{G}})\simeq -\frac{{\mathcal{G}}z_{10}\dot{\unicode[STIX]{x1D6FC}}}{\sqrt{2}},\quad \frac{\text{d}}{\text{d}\unicode[STIX]{x1D70F}}(\unicode[STIX]{x1D701}\unicode[STIX]{x1D703}^{1/2}{\mathcal{G}})\simeq \unicode[STIX]{x1D703}^{1/2}{\mathcal{G}}(\dot{\unicode[STIX]{x1D6FC}}-{\dot{z}}_{10}), & & \displaystyle\end{eqnarray}$$
which have to be solved with the initial conditions (4.15). These equations can be formally integrated to yield
 $$\begin{eqnarray}\displaystyle \unicode[STIX]{x1D703}\simeq \left(-\frac{1}{\sqrt{2}{\mathcal{G}}}\int _{0}^{\unicode[STIX]{x1D70F}}{\mathcal{G}}z_{10}\dot{\unicode[STIX]{x1D6FC}}\,\text{d}\unicode[STIX]{x1D70F}\right)^{2/3},\quad \unicode[STIX]{x1D701}\simeq \frac{1}{\unicode[STIX]{x1D703}^{1/2}{\mathcal{G}}}\int _{0}^{\unicode[STIX]{x1D70F}}\unicode[STIX]{x1D703}^{1/2}{\mathcal{G}}(\dot{\unicode[STIX]{x1D6FC}}-{\dot{z}}_{10})\,\text{d}\unicode[STIX]{x1D70F}.\qquad & & \displaystyle\end{eqnarray}$$
The initial approximation to start the numerical integration of (4.29) can be obtained by approximating the above analytical solution for
 $\unicode[STIX]{x1D70F}=t-t_{i}\ll 1$
using the expansions of
 $z_{10}(\unicode[STIX]{x1D70F})$
,
 $\unicode[STIX]{x1D6FC}(\unicode[STIX]{x1D70F})$
and
 ${\mathcal{G}}(\unicode[STIX]{x1D70F})$
for
 $\unicode[STIX]{x1D70F}\ll 1$
given in appendix C. On substituting these expansions into (4.32), at the lowest order for
 $\unicode[STIX]{x1D70F}\ll 1$
, one obtains
 $$\begin{eqnarray}\displaystyle \unicode[STIX]{x1D703}\simeq \left(-\frac{z_{100}\unicode[STIX]{x1D6FC}_{i1}}{\sqrt{2}}\right)^{2/3}\unicode[STIX]{x1D70F}^{2/3}=\left(\frac{kh_{0}a_{0}\sin \unicode[STIX]{x1D719}}{\sqrt{2}}\right)^{2/3}\unicode[STIX]{x1D70F}^{2/3},\quad \unicode[STIX]{x1D701}\simeq \frac{3\unicode[STIX]{x1D6FC}_{i1}}{4}\unicode[STIX]{x1D70F}, & & \displaystyle\end{eqnarray}$$
where
 $z_{100}$
and
 $\unicode[STIX]{x1D6FC}_{i1}$
are given in appendix C. The time dependences in these expressions, and the corresponding
 $\unicode[STIX]{x1D6E4}_{1}\propto \unicode[STIX]{x1D70F}^{1/3}$
after substituting into (4.24), coincide with those at the leading order of the solution for the growth of a vortex sheet from the leading edge of a starting flat plate when considered as a point vortex (Pullin & Wang Reference Pullin and Wang2004). These expressions are not valid, and therefore cannot be used to start the numerical integration, if
 $h_{0}$
,
 $a_{0}$
or
 $\sin \unicode[STIX]{x1D719}$
vanishes. These particular cases will be considered separately below.
The LEV trajectory (a) and circulation (b) for
 $h_{0}=0.1$
,
 $a_{0}=20^{\circ }$
,
 $a=0$
,
 $k=5$
and
 $\unicode[STIX]{x1D719}=10^{\circ }$
. The continuous lines correspond to the downstroke and the dashed lines to the upstroke. The circles in (a) mark the position at which
 $\unicode[STIX]{x1D6E4}_{1}$
reaches a maximum and the LEV is shed, whose instant is marked with a dotted vertical line in (b).

As figure 3, but for
 $\unicode[STIX]{x1D719}=90^{\circ }$
.

Figures 3 and 4 show some results for
 $h_{0}=0.1$
,
 $a_{0}=20^{\circ }$
,
 $a=0$
and
 $k=5$
, with
 $\unicode[STIX]{x1D719}=10^{\circ }$
and
 $\unicode[STIX]{x1D719}=90^{\circ }$
respectively. In figures 3(a) and 4(a), we plot the trajectories
 $\unicode[STIX]{x1D701}(\unicode[STIX]{x1D70F})$
versus
 $x_{1}(\unicode[STIX]{x1D70F})$
(it should be noted that the initial value of
 $x_{1}$
is
 $-1$
, and
 $z_{1}(\unicode[STIX]{x1D70F})=z_{10}(\unicode[STIX]{x1D70F})+\unicode[STIX]{x1D701}(\unicode[STIX]{x1D70F})$
). We integrate (4.29)–(4.30) numerically starting from a sufficiently small value of
 $\unicode[STIX]{x1D70F}$
with (4.33) until
 $\unicode[STIX]{x1D6E4}_{1}(\unicode[STIX]{x1D70F})$
, plotted in figures 3(b) and 4(b), reaches a maximum value, marked with circles in the vortex trajectories. From this point on, the circulation
 $\unicode[STIX]{x1D6E4}_{1}$
remains constant and we integrate (4.7) without the second term. For the numerical integrations, we use the general expression (4.28) for
 $\bar{u}_{1}$
and
 $\bar{v}_{1}$
, valid for any
 $x_{1}$
, and the solver ode15s from MATLAB. Since most of the vortex contribution to the forces and moment occurs, as we shall see, before the vortex is shed, and this event happens in both plotted cases before the vortex passes above (below) the foil, we only plot results for
 $x_{1}<0$
. A perfect symmetry is observed in figures 3 and 4 between the downstroke and the upstroke, with
 $\unicode[STIX]{x1D6E4}_{1}>0$
for the downstroke (in our sign convection where
 $\unicode[STIX]{x1D6E4}_{1}$
is positive when clockwise) and
 $\unicode[STIX]{x1D6E4}_{1}<0$
during the upstroke.
For
 $h_{0}=0$
, i.e. for a pure pitching motion,
 $\unicode[STIX]{x1D6FC}_{i0}=\pm a_{0}$
,
 $\unicode[STIX]{x1D6FC}_{i1}=0$
,
 $\unicode[STIX]{x1D6FC}_{i2}=\mp a_{0}k^{2}/2$
and
 $z_{10}\simeq \pm a_{0}(1+a)(1-k^{2}\unicode[STIX]{x1D70F}^{2}/2)$
according to the expressions given in appendix C. Thus, (4.32) yields, at the lowest order,
 $$\begin{eqnarray}\displaystyle \unicode[STIX]{x1D703}\simeq [(1+a)a_{0}^{2}k^{2}]^{2/3}\frac{\unicode[STIX]{x1D70F}^{4/3}}{2},\quad \unicode[STIX]{x1D701}\simeq \pm \frac{3}{8}a_{0}ak^{2}\unicode[STIX]{x1D70F}^{2},\quad \unicode[STIX]{x1D70F}\ll 1, & & \displaystyle\end{eqnarray}$$
which have to be used to start the numerical integration of (4.29)–(4.30). Figure 5 shows results for this case when
 $a_{0}=20^{\circ }$
,
 $a=0$
and
 $k=5$
. Comparing with figure 3, which is a similar case but with
 $h_{0}=0.1$
, the maximum of
 $\unicode[STIX]{x1D6E4}_{1}$
and the largest
 $|\unicode[STIX]{x1D701}|$
travelled by the vortex are both significantly smaller.
For
 $\sin \unicode[STIX]{x1D719}=0$
, i.e. for a combined motion without phase shift (
 $\unicode[STIX]{x1D719}=0$
), or with a phase shift
 $\unicode[STIX]{x1D719}=180^{\circ }$
,
 $h_{i1}=\unicode[STIX]{x1D6FC}_{i1}=0$
,
 $h_{i0}=\pm h_{0}$
,
 $\unicode[STIX]{x1D6FC}_{i0}=\pm a_{0}\cos \unicode[STIX]{x1D719}$
from the expressions given in appendix C, where it has been taken into account that
 $\cos \unicode[STIX]{x1D719}=\pm 1$
. At the lowest order, when
 $\unicode[STIX]{x1D70F}\ll 1$
, one obtains
 $$\begin{eqnarray}\displaystyle \unicode[STIX]{x1D703}\simeq (k^{2}a_{0}[(1+a)a_{0}+h_{0}\cos \unicode[STIX]{x1D719}])^{2/3}\frac{\unicode[STIX]{x1D70F}^{4/3}}{2},\quad \unicode[STIX]{x1D701}\simeq \pm \frac{3}{8}k^{2}(h_{0}+a_{0}a\cos \unicode[STIX]{x1D719})\unicode[STIX]{x1D70F}^{2}.\qquad & & \displaystyle\end{eqnarray}$$
Although this starting behaviour is very different from (4.33), the results as
 $\unicode[STIX]{x1D70F}$
increases are quite similar in both cases for small
 $\unicode[STIX]{x1D719}$
or for
 $\unicode[STIX]{x1D719}$
close to
 $180^{\circ }$
. For instance, the curves for
 $\unicode[STIX]{x1D719}=0$
when
 $h_{0}=0.1$
,
 $a_{0}=20^{\circ }$
,
 $a=0$
and
 $k=5$
are very similar to those depicted in figure 3 for
 $\unicode[STIX]{x1D719}=10^{\circ }$
, except for very small
 $\unicode[STIX]{x1D70F}$
. For this reason, these results are not plotted here.
Finally, for a pure heaving motion (
 $a_{0}=0$
), the equations have no solution with the present approximation (4.28), which needs the presence of some pitching motion with
 $\dot{\unicode[STIX]{x1D6FC}}\neq 0$
to generate an LEV. One would have to consider the next-order effects of
 $\unicode[STIX]{x1D71B}_{11}$
in (4.6), but these second-order effects are neglected in the present approximation.
As figure 3, but for
 $h_{0}=0$
.

More generally, no LEV is produced within the present approximation when
 $\unicode[STIX]{x1D6E4}_{1}$
is negative at the beginning of the downstroke (or positive at the beginning of the upstroke), i.e. when
 ${\mathcal{G}}_{i0}={\mathcal{G}}(\unicode[STIX]{x1D70F}=0)<0$
for the downstroke (or
 ${\mathcal{G}}_{i0}>0$
for the upstroke). From (C 3)–(C 8) in appendix C, this condition for the formation of the LEV can be written as
 $$\begin{eqnarray}\displaystyle \frac{h_{0}}{(1+a)a_{0}}<\unicode[STIX]{x1D6F7}(k,\unicode[STIX]{x1D719})\equiv \frac{2F(k)}{k[3F(k)-1]\sin \unicode[STIX]{x1D719}-2F(k)\cos \unicode[STIX]{x1D719}}, & & \displaystyle\end{eqnarray}$$
valid for both the downstroke and the upstroke. This condition excludes the pure heaving motion already commented on, and allows any pure pitching motion (
 $h_{0}=0$
) for any value of
 $k$
or
 $a$
. Any pitching of the foil pivoting at the leading edge (
 $a=-1$
) is also excluded by this inequality.
Plot of
 $\unicode[STIX]{x1D6F7}$
, defined in (4.36), versus
 $k$
for several values of
 $\unicode[STIX]{x1D719}$
.

Figure 6 shows
 $\unicode[STIX]{x1D6F7}$
as a function of
 $k$
for several values of
 $\unicode[STIX]{x1D719}$
. A solution exists, i.e. an LEV is generated, for values of
 $k$
and
 $h_{0}/[(1+a)a_{0}]$
below the corresponding curve for a given phase shift
 $\unicode[STIX]{x1D719}$
. When
 $\unicode[STIX]{x1D719}$
is close to zero, the solution exists for practically any value of
 $k$
and
 $h_{0}/[(1+a)a_{0}]$
. However, as
 $\unicode[STIX]{x1D719}$
increases, the range shrinks to smaller values of both parameters. If one starts to increase
 $h_{0}/[(1+a)a_{0}]$
(by decreasing the pitch angle
 $a_{0}$
, say) for given values of
 $k$
and
 $h_{0}/[(1+a)a_{0}]$
below the curve corresponding to a given value of the phase shift
 $\unicode[STIX]{x1D719}$
, what it is found is that
 $\unicode[STIX]{x1D70F}_{m}$
decreases and the maximum circulation tends to zero as one approaches the curve, corresponding to a vanishing contribution of the LEV to the force and moment.
Condition (4.36) is the mathematical expression of the known physical condition that the effective angle of attack has to be sufficiently large for the flow to separate at the leading edge and develop an LEV that moves as a point vortex away from the edge (Dickinson & Götz Reference Dickinson and Götz1993; Jones Reference Jones2003; Xia & Mohseni Reference Xia and Mohseni2013). It is a consequence of the Kutta condition imposed at the sharp leading edge while the LEV is growing. In fact,
 ${\mathcal{G}}(t)$
, as defined in (4.24) proportional to the LEV circulation, is a measure of the average slip between the plate and the fluid adjacent to the plate (Jones Reference Jones2003), which has to be positive at the beginning of the downstroke (negative for the upstroke) to generate an LEV that begins to move away from the plate. What it is remarkable here is that this condition can be written in terms of a single parameter
 $h_{0}/[(1+a)a_{0}]$
for given
 $k$
and
 $\unicode[STIX]{x1D719}$
.
5 Results for the contribution of the LEV to the forces and moment
According to (3.7), (3.17) and (3.21), the contributions of the LEV with circulation
 $\unicode[STIX]{x1D6E4}_{1}(t)$
developed during each half-stroke to the lift, thrust and moment are given, in non-dimensional form, by
 $$\begin{eqnarray}\displaystyle & \displaystyle C_{L_{1}}=\frac{\text{d}}{\text{d}t}F_{L_{1}},\quad F_{L_{1}}\equiv -\unicode[STIX]{x1D6E4}_{1}(x_{1}+D_{1}), & \displaystyle\end{eqnarray}$$
 $$\begin{eqnarray}\displaystyle & \displaystyle C_{T_{1}}=\frac{\text{d}}{\text{d}t}F_{T_{1}},\quad F_{T_{1}}\equiv \unicode[STIX]{x1D6E4}_{1}[z_{s}(x_{1})-z_{1}+\unicode[STIX]{x1D6FC}(x_{1}+D_{1})], & \displaystyle\end{eqnarray}$$
 $$\begin{eqnarray}\displaystyle & \displaystyle C_{M_{1}}=\frac{\text{d}}{\text{d}t}F_{M_{1}},\quad F_{M_{1}}\equiv \frac{1}{2}\unicode[STIX]{x1D6E4}_{1}\left[\frac{x_{1}^{2}}{2}+\frac{E_{1}}{2}-\frac{1}{4}-a(x_{1}+D_{1})\right], & \displaystyle\end{eqnarray}$$
where, as usual, the forces are scaled with
 $\unicode[STIX]{x1D70C}U^{2}c/2$
and the moment with
 $\unicode[STIX]{x1D70C}U^{2}c^{2}/2$
. All of the magnitudes in these expressions are dimensionless (see (4.10)).
The quantities
 $D_{1}$
and
 $E_{1}$
, which are integrals defined in (B 3) and (B 4) of appendix B respectively, are obtained in the present linear approximation by neglecting terms of order
 $z_{1}^{2}$
,
 $$\begin{eqnarray}\displaystyle D_{1}\simeq -x_{1}-\sqrt{x_{1}^{2}-1},\quad E_{1}\simeq {\textstyle \frac{1}{2}}-x_{1}^{2}-x_{1}\sqrt{x_{1}^{2}-1},\quad \text{for}\quad x_{1}\leqslant -1. & & \displaystyle\end{eqnarray}$$
They can also be obtained for
 $x_{1}>-1$
with errors of
 $O(z_{1}^{2})$
. However, since we are considering only the effect of the growing LEV up to the point where its intensity
 $|\unicode[STIX]{x1D6E4}_{1}|$
reaches a maximum, and this maximum occurs in all significant cases for
 $x_{1}\leqslant -1$
(see, e.g., figures 3–5), these expressions suffice in the present approximation. On substituting into (5.1)–(5.3), and using (4.14) and (4.24), one obtains
 $$\begin{eqnarray}\displaystyle & \displaystyle F_{L_{1}}=\unicode[STIX]{x1D6E4}_{1}\sqrt{x_{1}^{2}-1}\simeq 2{\mathcal{G}}\unicode[STIX]{x1D703}\left(1+\frac{\unicode[STIX]{x1D703}}{4}\right), & \displaystyle\end{eqnarray}$$
 $$\begin{eqnarray}\displaystyle & \displaystyle F_{T_{1}}=\unicode[STIX]{x1D6E4}_{1}[z_{s}(x_{1})-z_{1}-\unicode[STIX]{x1D6FC}\sqrt{x_{1}^{2}-1}]\simeq -2{\mathcal{G}}\unicode[STIX]{x1D703}\left[\unicode[STIX]{x1D701}+\unicode[STIX]{x1D6FC}\left(1-\sqrt{\frac{\unicode[STIX]{x1D703}}{2}}+\frac{\unicode[STIX]{x1D703}}{4}\right)\right], & \displaystyle\end{eqnarray}$$
 $$\begin{eqnarray}\displaystyle & \displaystyle F_{M_{1}}=\frac{1}{2}\unicode[STIX]{x1D6E4}_{1}\sqrt{x_{1}^{2}-1}\left(a-\frac{x_{1}}{2}\right)\simeq {\mathcal{G}}\unicode[STIX]{x1D703}\left[a+\frac{1}{2}+\frac{\unicode[STIX]{x1D703}}{4}\left(a+\frac{5}{2}\right)\right]. & \displaystyle\end{eqnarray}$$
It should be noted that we use the approximation
 $\unicode[STIX]{x1D703}\ll 1$
, which is quite accurate in all of the cases considered (e.g. figures 3–5). At the initial stages of each half-stroke (
 $\unicode[STIX]{x1D70F}\ll 1$
), one may use (4.33) to find, at the leading order,
 $F_{L_{1}}\propto \unicode[STIX]{x1D70F}^{2/3}$
,
 $F_{T_{1}}\propto \unicode[STIX]{x1D70F}^{4/3}$
and
 $F_{M_{1}}\propto \unicode[STIX]{x1D70F}^{2/3}$
, which yield, after using (5.1)–(5.3), the lift singularity at the start of the impulsive motion of a flat plate discussed by Graham (Reference Graham1983),
 $C_{L_{1}}\propto \unicode[STIX]{x1D70F}^{-1/3}$
, together with
 $C_{T_{1}}\propto \unicode[STIX]{x1D70F}^{2/3}$
and
 $C_{M_{1}}\propto \unicode[STIX]{x1D70F}^{-1/3}$
.
These functions (5.5)–(5.7) are very relevant because, according to (5.1)–(5.3), their values up to a given instant
 $\unicode[STIX]{x1D70F}$
within each half-stroke are proportional to the corresponding time-averaged force or moment up to that instant. Figure 7 shows
 $F_{L_{1}},F_{T_{1}}$
and
 $F_{M_{1}}$
, as well as
 $C_{L_{1}},C_{T_{1}}$
and
 $C_{M_{1}}$
, for the downstroke and the upstroke of a typical case (that of figure 3) up to the point where
 $|\unicode[STIX]{x1D6E4}_{1}|$
reaches a maximum. The main feature of this and all of the cases considered is that
 $C_{L_{1}}(\unicode[STIX]{x1D70F})$
and
 $C_{M_{1}}(\unicode[STIX]{x1D70F})$
for the upstroke are symmetrical in relation to the downstroke, so that the developing LEV does not contribute to the time-averaged lift and moment during a whole stroke. It only contributes to the instantaneous lift and moment, especially at the beginning of each half-stroke, by the contribution cancelling out with the next half-stroke. However, the evolution of
 $C_{T_{1}}(\unicode[STIX]{x1D70F})$
(and
 $F_{T_{1}}(\unicode[STIX]{x1D70F})$
) for the upstroke coincides with its evolution during the downstroke. Thus, the growing LEV contributes to both the instantaneous thrust force and its time-averaged value. In addition, for most of the cases considered, the contribution to the time-averaged thrust is negative, i.e. the growing LEV generates drag in the mean, within the present approximation. This is consistent with the discussion on the general expression for
 $T_{j}$
given in § 3, just below (3.17).
The functions (5.5)–(5.7) (a), and the force and moment coefficients (5.1)–(5.3) (b) for the case depicted in figure 3 (
 $h_{0}=0.1$
,
 $a_{0}=20^{\circ }$
,
 $a=0$
,
 $k=5$
and
 $\unicode[STIX]{x1D719}=10^{\circ }$
), for both the downstroke (continuous lines) and the upstroke (dashed lines). The vertical dotted line marks the instant where
 $|\unicode[STIX]{x1D6E4}_{1}|$
reaches a maximum value.

According to (5.2), the time-averaged thrust (actually drag in most cases) produced by the LEV during each half-stroke is given by the final value of the function
 $F_{T_{1}}$
at the half-period
 $\unicode[STIX]{x1D70F}=\unicode[STIX]{x03C0}/k$
. However, since we are considering only the contribution of the LEV up to the instant
 $\unicode[STIX]{x1D70F}_{m}$
where
 $|\unicode[STIX]{x1D6E4}_{1}|$
reaches a maximum value, the time-averaged thrust coefficient can be written as
 $$\begin{eqnarray}\displaystyle \overline{C}_{T_{1}}\simeq \frac{2}{\unicode[STIX]{x1D70F}_{m}}\int _{0}^{\unicode[STIX]{x1D70F}_{m}}C_{T_{1}}\,\text{d}\unicode[STIX]{x1D70F}=\frac{2}{\unicode[STIX]{x1D70F}_{m}}F_{T_{1}}(\unicode[STIX]{x1D70F}=\unicode[STIX]{x1D70F}_{m}), & & \displaystyle\end{eqnarray}$$
where it has been taken into account that
 $C_{T_{1}}(t)$
coincides for the downstroke and the upstroke, and that
 $F_{T_{1}}(\unicode[STIX]{x1D70F}=0)=0$
(it should be remembered that
 $\unicode[STIX]{x1D70F}=0$
corresponds to
 $t=t_{i}$
for each half-cycle). Thus, one has only to compute numerically the function
 $F_{T_{1}}$
at
 $\unicode[STIX]{x1D70F}=\unicode[STIX]{x1D70F}_{m}$
from (5.6),
 $$\begin{eqnarray}\displaystyle F_{T_{1}}(\unicode[STIX]{x1D70F}=\unicode[STIX]{x1D70F}_{m})\simeq -2{\mathcal{G}}_{m}\unicode[STIX]{x1D703}_{m}\left[\unicode[STIX]{x1D701}_{m}+\unicode[STIX]{x1D6FC}_{m}\left(1-\sqrt{\frac{\unicode[STIX]{x1D703}_{m}}{2}}+\frac{\unicode[STIX]{x1D703}_{m}}{4}\right)\right], & & \displaystyle\end{eqnarray}$$
where the subscript
 $m$
means at
 $\unicode[STIX]{x1D70F}=\unicode[STIX]{x1D70F}_{m}$
. Figure 8 shows
 $k\unicode[STIX]{x1D70F}_{m}/\unicode[STIX]{x03C0}$
, i.e. the fraction of each half-stroke during which
 $|\unicode[STIX]{x1D6E4}_{1}|$
increases, as a function of
 $k$
for a pure pitching motion with several values of
 $a_{0}$
and two pitching axis locations. It is observed that
 $k\unicode[STIX]{x1D70F}_{m}/\unicode[STIX]{x03C0}$
scales, approximately, as
 $(a_{0}k)^{1/4}$
for sufficiently large frequencies, with the proportionality constant slightly increasing with
 $a$
.
Plot of
 $k\unicode[STIX]{x1D70F}_{m}/\unicode[STIX]{x03C0}$
versus
 $k$
for a pure pitching motion with
 $a=0$
(a) and
 $a=0.5$
(b), and increasing values of
 $a_{0}$
, from
 $10^{\circ }$
(bottom curve) to
 $30^{\circ }$
(top curve) with increments of
 $4^{\circ }$
.

Plot of
 $\overline{C}_{T_{1}}$
versus
 $k$
for a pure pitching motion for increasing values of
 $a_{0}$
, from
 $10^{\circ }$
(top curves) to
 $30^{\circ }$
(bottom curves) with increments of
 $4^{\circ }$
, for
 $a=0$
(a),
 $a=0.5$
(b) and
 $a=-0.5$
(c). (It should be remembered that the non-dimensional pivot axis ranges from
 $a=-1$
at the leading edge to
 $a=1$
at the trailing edge.)

Figure 9 shows
 $\overline{C}_{T_{1}}$
for a pure pitching motion as a function of the reduced frequency
 $k$
for different values of the pitching amplitude
 $a_{0}$
and three values of the pitching axis location
 $a$
. For small
 $k$
and
 $a_{0}$
,
 $|\overline{C}_{T_{1}}|$
is negligible, as expected. As commented on above,
 $\overline{C}_{T_{1}}$
is usually negative, i.e. the LEV produces drag in most cases within the present approximation. If this is the case,
 $\overline{C}_{T_{1}}$
is found to be roughly proportional to
 $-a_{0}^{2}k^{3}$
for sufficiently large
 $k$
, with a proportionality constant that depends on
 $a$
. This constant is significantly larger for
 $a=0.5$
than for
 $a=0$
(compare panels (a) and (b) in figure 9). Thus, the LEV correction to the thrust is more important when the pitching axis is downstream of the midchord point. For
 $a=-0.5$
,
 $\overline{C}_{T_{1}}$
is positive and small for low
 $a_{0}$
and
 $k$
(see the inset in figure 9
c), being negative as in the other two cases for larger
 $a_{0}$
and
 $k$
(it should be noted that the scale of
 $\overline{C}_{T_{1}}$
in figure 9(c) is not logarithmic to allow for this change of sign). For combined heaving and pitching motions that satisfy (4.36), it is found that
 $\overline{C}_{T_{1}}$
behaves in a similar fashion to the pure pitching motion in relation to
 $k$
and
 $a_{0}$
, with a weaker dependence on
 $h_{0}$
and
 $\unicode[STIX]{x1D719}$
.
6 Total time-averaged thrust and propulsion efficiency
From (3.14), the total time-averaged thrust coefficient is then
 $$\begin{eqnarray}\displaystyle \overline{C}_{T}\simeq \overline{C}_{T_{f}}+\overline{C}_{T_{1}}, & & \displaystyle\end{eqnarray}$$
where
 $\overline{C}_{T_{f}}\equiv \overline{C}_{T_{a}}+\overline{C}_{T_{e}}$
is the sum of the time-averaged values of the non-dimensional forms of
 $T_{a}$
and
 $T_{e}$
given by (3.15)–(3.16) over a whole stroke of period
 $2\unicode[STIX]{x03C0}/k$
(the subscript
 $f$
is for ‘free’ of leading-edge, or any other point, vortex). The expression for
 $\overline{C}_{T_{f}}$
as a function of
 $k$
,
 $h_{0}$
,
 $a_{0}$
,
 $a$
and
 $\unicode[STIX]{x1D719}$
can be found in Fernandez-Feria (Reference Fernandez-Feria2016, Reference Fernandez-Feria2017), which modifies previous expressions by Garrick (Reference Garrick1936).
Of particular interest in forward flight flapping aerodynamics is the time-average propulsion efficiency, defined as
 $$\begin{eqnarray}\displaystyle \unicode[STIX]{x1D702}=\frac{\overline{C}_{T}}{\overline{C}_{P}}, & & \displaystyle\end{eqnarray}$$
where
 $\overline{C}_{P}$
is the time-averaged power coefficient, given by the lift force times heave velocity plus the pitching moment times pitch angular velocity,
 $$\begin{eqnarray}\displaystyle \overline{C}_{P}=-\overline{C_{L}{\dot{h}}}-\overline{C_{M}\dot{\unicode[STIX]{x1D6FC}}}. & & \displaystyle\end{eqnarray}$$
It must be noted that, although the LEV does not contribute to the averaged lift and moment in the present approximation, i.e.
 $\overline{C}_{L_{1}}=\overline{C}_{M_{1}}=0$
, so that
 $\overline{C}_{L}=\overline{C}_{L_{f}}\equiv \overline{C}_{L_{a}}+\overline{C}_{L_{e}}$
, with
 $C_{L_{a}}$
and
 $C_{L_{e}}$
the non-dimensional forms of
 $L_{a}$
and
 $L_{e}$
given in (3.5)–(3.6), and similarly for the moment with
 $M_{a}$
and
 $M_{e}$
given by (3.19)–(3.20), the LEV does contribute to the averaged input power coefficient because it comes from the time averaging of the products in (6.3). By writing
 $$\begin{eqnarray}\displaystyle \overline{C}_{P_{f}}\equiv -\overline{C_{L_{f}}{\dot{h}}}-\overline{C_{M_{f}}\dot{\unicode[STIX]{x1D6FC}}}, & & \displaystyle\end{eqnarray}$$
averaged over the whole period
 $2\unicode[STIX]{x03C0}/k$
, and
 $$\begin{eqnarray}\displaystyle \overline{C}_{P_{1}}\equiv -\overline{C_{L_{1}}{\dot{h}}}-\overline{C_{M_{1}}\dot{\unicode[STIX]{x1D6FC}}}\simeq -\frac{2}{\unicode[STIX]{x1D70F}_{m}}\int _{0}^{\unicode[STIX]{x1D70F}_{m}}(C_{L_{1}}{\dot{h}}+C_{M_{1}}\dot{\unicode[STIX]{x1D6FC}})\,\text{d}\unicode[STIX]{x1D70F}, & & \displaystyle\end{eqnarray}$$
(6.3) can be written as
 $$\begin{eqnarray}\displaystyle \overline{C}_{P}\simeq \overline{C}_{P_{f}}+\overline{C}_{P_{1}}. & & \displaystyle\end{eqnarray}$$
Closed expressions for
 $\overline{C}_{P_{f}}$
in terms of
 $k$
,
 $h_{0}$
,
 $a_{0}$
,
 $a$
and
 $\unicode[STIX]{x1D719}$
were originally derived by Theodorsen (Reference Theodorsen1935) and Garrick (Reference Garrick1936) and can be found in many references. To obtain
 $\overline{C}_{P_{1}}$
, one has to use the expressions (5.1) and (5.3) for
 $C_{L_{1}}$
and
 $C_{M_{1}}$
in (6.5). Alternatively, by integrating by parts, it can be written in terms of
 $F_{L_{1}}$
and
 $F_{M_{1}}$
as
 $$\begin{eqnarray}\displaystyle \overline{C}_{P_{1}}\simeq \frac{2}{\unicode[STIX]{x1D70F}_{m}}\left[\int _{0}^{\unicode[STIX]{x1D70F}_{m}}(F_{L_{1}}\ddot{h}+F_{M_{1}}\ddot{\unicode[STIX]{x1D6FC}})\,\text{d}\unicode[STIX]{x1D70F}-(F_{L_{1}}{\dot{h}}+F_{M_{1}}\dot{\unicode[STIX]{x1D6FC}})_{\unicode[STIX]{x1D70F}=\unicode[STIX]{x1D70F}_{m}}\right]. & & \displaystyle\end{eqnarray}$$
Plot of
 $\overline{C}_{P_{1}}$
versus
 $k$
for a pure pitching motion for increasing values of
 $a_{0}$
, from
 $10^{\circ }$
(top curves) to
 $30^{\circ }$
(bottom curves) with increments of
 $4^{\circ }$
, for
 $a=0$
(a) and
 $a=-0.5$
(b).

Figure 10 shows
 $\overline{C}_{P_{1}}$
for a pitching motion versus the reduced frequency
 $k$
for different values of the pitching amplitude
 $a_{0}$
and two values of the pitching axis location
 $a$
. For large
 $k$
,
 $|\overline{C}_{P_{1}}|$
is approximately proportional to
 $a_{0}^{4}k^{3}$
, with the proportionality constant increasing with
 $a$
. As in the case of
 $\overline{C}_{T_{1}}$
(figure 9), the effect of the LEV is larger for a pivot location downstream of the midchord point (
 $a>0$
), especially as
 $a_{0}$
and
 $k$
increase.
7 Comparison with experimental results
Here, we first compare the above theoretical results with the recent experimental data for a pitching foil reported by Mackowski & Williamson (Reference Mackowski and Williamson2017). These authors measured
 $\overline{C}_{T}$
and
 $\unicode[STIX]{x1D702}$
directly for different pivot point locations and several values of the reduced frequency at a Reynolds number of
 $17\,000$
. To account for the viscous effects, especially relevant at low frequencies, we add a quasisteady thrust coefficient
 $C_{T_{0}}<0$
(actually a drag coefficient), which was experimentally computed by these authors by averaging the airfoil static drag over the pitch angles encountered during a cycle of oscillation. By adding this
 $C_{T_{0}}$
to
 $\overline{C}_{T}$
, the results of the potential theory based on the vortical impulse agree quite well with experimental data for sufficiently small amplitude of the oscillations (Fernandez-Feria Reference Fernandez-Feria2017). This
 $C_{T_{0}}$
depends, for a pitching foil, on the maximum pitch angle
 $a_{0}$
and the pivot location
 $a$
. Figure 11 shows the measured values for
 $a_{0}=8^{\circ }$
as a function of
 $a$
.
Quasisteady drag
 $C_{T_{0}}$
versus
 $a$
measured by Mackowski & Williamson (Reference Mackowski and Williamson2017) for an NACA 0012 foil at
 $Re=17\,000$
for
 $a_{0}=8^{\circ }$
. It should be remembered that
 $-1\leqslant a\leqslant 1$
for a pivot location inside the foil.
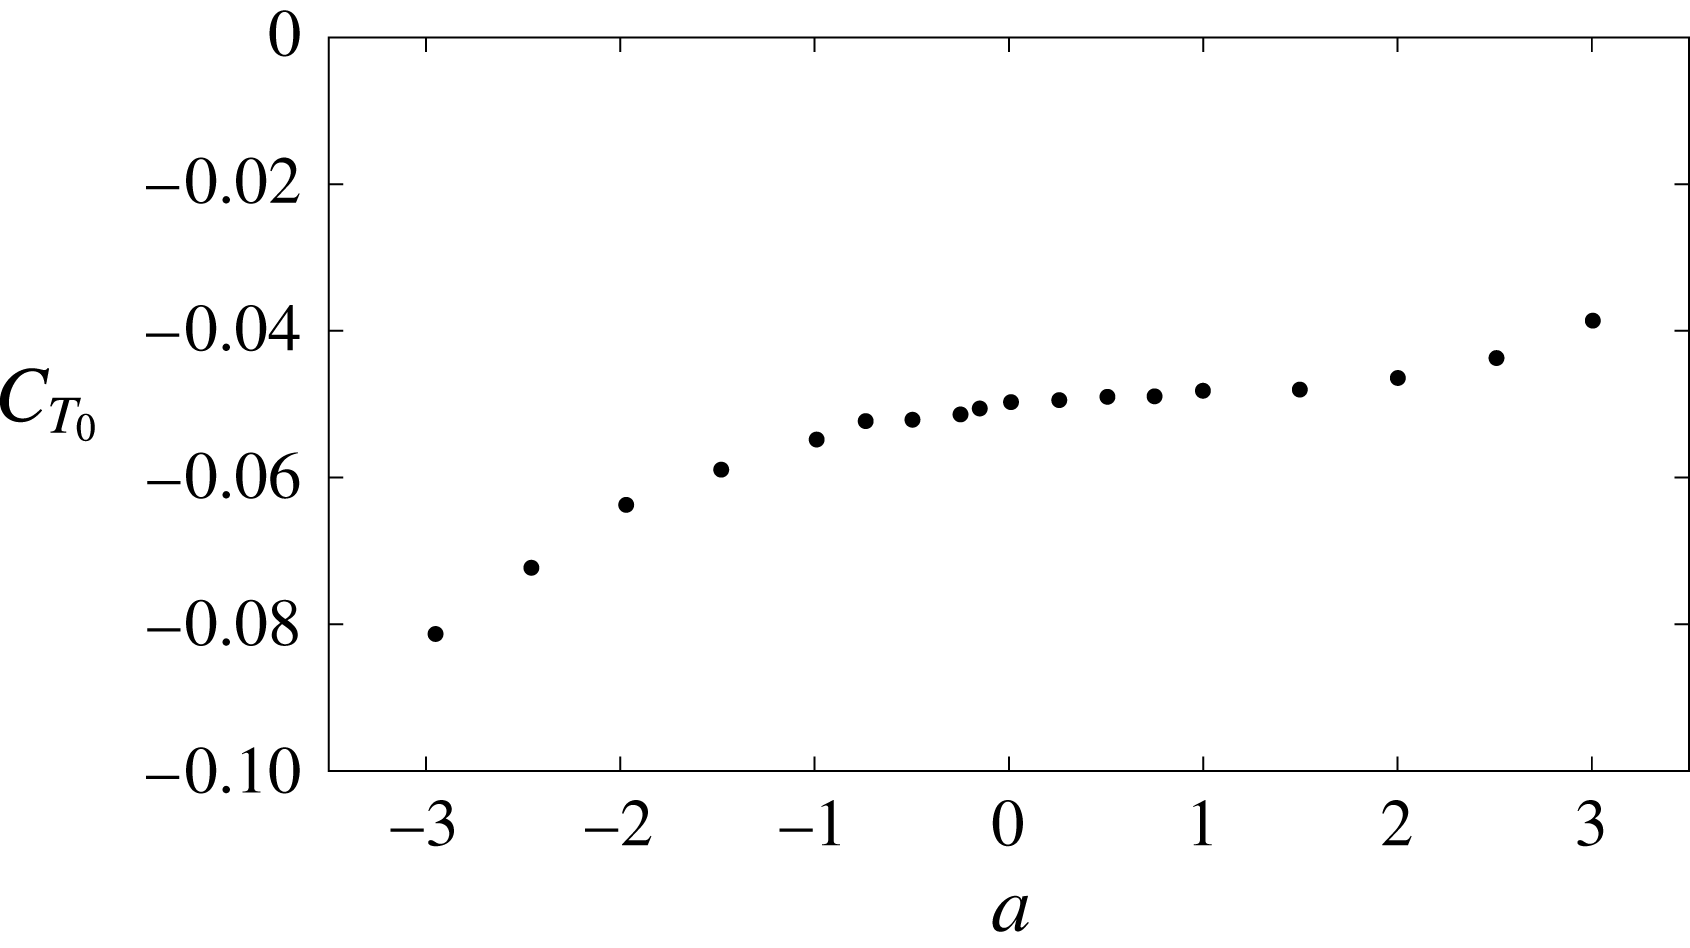
Comparison of the experimental data of Mackowski & Williamson (Reference Mackowski and Williamson2017) for
 $\overline{C}_{T}$
(a) and
 $\unicode[STIX]{x1D702}$
(b) versus
 $a$
for
 $k=2$
and
 $a_{0}=8^{\circ }$
(dots, from figures 6 and 7 of Mackowski and Williamson) with the present results (dashed and dotted lines), with the results without the LEV effect (continuous lines) and with Garrick’s (Reference Garrick1936) results (dashed lines). The different theoretical results are presented in two ways, adding the experimental value of
 $C_{T_{0}}(a)$
given in figure 11 to
 $\overline{C}_{T}$
, and without adding it.

Figure 12 compares the experimental results for the thrust coefficient and propulsive efficiency obtained by Mackowski & Williamson (Reference Mackowski and Williamson2017) for
 $k=2$
,
 $a_{0}=8^{\circ }$
and different values of the pivot location
 $a$
with the present results for
 $\overline{C}_{T}$
and
 $\unicode[STIX]{x1D702}$
. Also included are the results obtained without considering the LEV effect, i.e.
 $\overline{C}_{T_{f}}$
and
 $\unicode[STIX]{x1D702}_{f}\equiv \overline{C}_{T_{f}}/\overline{C}_{P_{f}}$
, as well as Garrick’s (Reference Garrick1936) results for
 $\overline{C}_{T}$
and
 $\unicode[STIX]{x1D702}$
. The theoretical results are presented in two ways: with the addition of the quasisteady constant drag
 $\overline{C}_{T_{0}}(a)$
, as given in figure 11, to correct
 $\overline{C}_{T}$
, and also without adding the experimentally based
 $\overline{C}_{T_{0}}(a)$
. The main feature arising from this figure is that the LEV effect is relevant, within the present approximation, when
 $a>0$
: the LEV corrections to
 $\overline{C}_{T}$
and
 $\unicode[STIX]{x1D702}$
are negligible when the pivot location is ahead of the midchord point (
 $a<0$
), while they are increasingly important as the pivot point approaches the trailing edge or is located further downstream. The differences between Garrick’s classical results and the present ones based on the vortical impulse theory are also more pronounced in these cases with
 $a>0$
. The correction provided by this theory, already discussed in Fernandez-Feria (Reference Fernandez-Feria2016), is here increased when the LEV effect is taken into account, so that the agreement of the present propulsive efficiency with the experimental data is overall better for all pivot locations.
Comparison of the theoretical results with the experimental data of Anderson et al. (Reference Anderson, Streitlien, Barret and Triantafyllou1998) for
 $\overline{C}_{T}$
versus the Strouhal number based on the total excursion of the trailing edge,
 $St_{TE}$
, for a combined plunging and pitching motion of an NACA 0012 airfoil with
 $a=-1/3$
in two cases:
 $h_{0}=1.5$
,
 $\unicode[STIX]{x1D6FC}_{max}=21^{\circ }$
,
 $\unicode[STIX]{x1D719}=75^{\circ }$
(case 1 from figure 1 of Anderson et al.) (a) and
 $h_{0}=1.5$
,
 $\unicode[STIX]{x1D6FC}_{0}=15^{\circ }$
,
 $\unicode[STIX]{x1D719}=75^{\circ }$
(from figure 9a of Anderson et al.) (b). The theoretical results are presented adding a constant quasisteady drag
 $C_{T_{0}}$
to
 $\overline{C}_{T}$
, given in the legend (estimated from Mackowski & Williamson (Reference Mackowski and Williamson2017) for a similar amplitude), and also without adding it.

Figure 13 compares the theoretical results with the experimental data for
 $\overline{C}_{T}$
obtained by Anderson et al. (Reference Anderson, Streitlien, Barret and Triantafyllou1998) for a combined pitching and plunging motion in two of the optimal cases where experiment provides very high efficiency for an NACA 0012 airfoil pivoting at one-third-chord point. These two cases, both with
 $\unicode[STIX]{x1D719}=75^{\circ }$
, are among the few of those reported by Anderson et al. (Reference Anderson, Streitlien, Barret and Triantafyllou1998) that satisfy the condition (4.36). It is observed that the agreement with the experimental data improves when the present LEV effect is taken into account, almost independently of whether we add, or not, a constant quasisteady drag
 $C_{T_{0}}$
, which has to be estimated from experimental data.
8 Conclusion
We have developed general expressions for the contribution of travelling point vortices to the lift, thrust, moment and propulsion efficiency of a two-dimensional pitching and heaving airfoil from a vortical impulse formulation within the linear potential theory. Although these general formulae need additional information about the temporal evolution of the vortices, both circulation and trajectory, they provide useful qualitative information about their effect on the airfoil unsteady aerodynamics.
Starting from these general formulae, we have derived closed-form expressions for the LEV contribution to the unsteady forces and moment on the airfoil. To that end, we have used several simplifying assumptions for the development and shedding of the LEV. We have considered only one point vortex during each half-stroke, an LEV that is released from the sharp leading edge where one can apply the unsteady Kutta condition that regularizes the bound vortex-sheet strength at the leading edge, and used the Brown–Michael equation for the developing LEV, which ensures momentum conservation. With these assumptions, the symmetry of the problem shows that the LEV does not contribute to the time-averaged lift and moment, but only to the time-averaged thrust and the propulsion efficiency, which are in general lowered in relation to the case without LEV. Further, by considering the effect of the developing LEV just up to its shedding point, when its circulation reaches an extremum value according to the Brown–Michael model, we are able to obtain quite simple relations for the LEV effect on the thrust force and propulsion efficiency, which constitutes a lowest-order correction to the analytical results from the linear potential theory. The resulting thrust coefficient and propulsion efficiency corrected by the LEV agree reasonably well with recent experimental results for a foil pitching at different pivot locations when the pitching amplitude is small enough for the linear theory to be valid.
As a general trend, it is found that the LEV lowest-order corrections to the thrust force and propulsion efficiency are more significant when the pitching axis location is behind the midchord point (
 $a>0$
), the more so the larger the pitching amplitude and the reduced frequency are. These are, in fact, the conditions where the classical Garrick expressions for the thrust and efficiency are in greater disagreement with experimental results for a pure pitching motion. In addition, no LEV corrections are found within the present linear approximation for a pure heaving motion (
 $a_{0}=0$
), or, more generally, when
 $h_{0}/(1+a)a_{0}$
is larger than a quantity that depends on
 $k$
and
 $\unicode[STIX]{x1D719}$
.
The present contribution of the effect of the LEV on the unsteady aerodynamics of a two-dimensional airfoil is limited to thin rigid airfoils with small-to-medium angles of attack. It may complement the large amount of information already existing in the literature about the LEV effect on the unsteady aerodynamics of flapping wings in a great variety of kinematics and flow conditions. We provide closed-form corrections to the very useful and long-time used analytical expressions from the linear potential theory. Better approximations can be obtained from more complete models for the development and shedding of the LEV, but at the cost of more parameters to be adjusted experimentally and probably not in a closed simple form.
Acknowledgements
This research has been supported by the Ministerio de Economía y Competitividad of Spain grant nos DPI2013-40479-P and DPI2016-76151-C2-1-R.
Appendix A. A note on the Kutta condition at the trailing edge and the general validity of (2.26)–(2.27)
In § 2.2, we applied the Kutta condition at the trailing edge separately to each component of
 $\unicode[STIX]{x1D71B}_{s}$
defined in (2.13), satisfying the integral equations (2.17)–(2.19). However, in fact, it has to be applied just once to the whole vorticity distribution on the foil, which has to be regular at
 $x=1$
. In doing this, the following relation results for the circulations
 $\unicode[STIX]{x1D6E4}_{0}$
,
 $\unicode[STIX]{x1D6E4}_{1e}$
and
 $\unicode[STIX]{x1D6E4}_{1j}$
of the components of
 $\unicode[STIX]{x1D71B}_{s}$
, which are arbitrary ‘constants’ from the integral equations (2.17)–(2.19):
 $$\begin{eqnarray}\displaystyle & & \displaystyle \unicode[STIX]{x1D6E4}_{0}(t)+\unicode[STIX]{x1D6E4}_{1e}(t)+\mathop{\sum }_{j=1}^{N}\unicode[STIX]{x1D6E4}_{1j}(t)=-2\unicode[STIX]{x2A0D}_{-1}^{1}\sqrt{\frac{1+\unicode[STIX]{x1D709}}{1-\unicode[STIX]{x1D709}}}v_{0}(\unicode[STIX]{x1D709},t)\,\text{d}\unicode[STIX]{x1D709}\nonumber\\ \displaystyle & & \displaystyle \quad +\,\int _{1}^{\infty }\left(\sqrt{\frac{\unicode[STIX]{x1D709}+1}{\unicode[STIX]{x1D709}-1}}-1\right)\unicode[STIX]{x1D71B}_{e}(\unicode[STIX]{x1D709},t)\,\text{d}\unicode[STIX]{x1D709}+\mathop{\sum }_{j=1}^{N}\unicode[STIX]{x1D6E4}_{j}(t)C_{j}(t),\end{eqnarray}$$
where the
 $C_{j}(t)$
are given by (2.25) in terms of
 $\unicode[STIX]{x1D6E4}_{j}(t)$
and
 $[x_{j}(t),z_{j}(t)]$
. On substituting into (2.13), one obtains the same vorticity distribution (2.27), but without identifying
 $\unicode[STIX]{x1D6E4}_{0}(t)$
with the first term on the right-hand side of (A 1),
 $\unicode[STIX]{x1D6E4}_{1e}$
with the second term, and so on. Moreover, on substituting into Kelvin’s theorem (2.15), one obtains
 $$\begin{eqnarray}\displaystyle \int _{1}^{\infty }\sqrt{\frac{\unicode[STIX]{x1D709}+1}{\unicode[STIX]{x1D709}-1}}\unicode[STIX]{x1D71B}_{e}(\unicode[STIX]{x1D709},t)\,\text{d}\unicode[STIX]{x1D709}=2\unicode[STIX]{x2A0D}_{-1}^{1}\sqrt{\frac{1+\unicode[STIX]{x1D709}}{1-\unicode[STIX]{x1D709}}}v_{0}(\unicode[STIX]{x1D709},t)\,\text{d}\unicode[STIX]{x1D709}-\mathop{\sum }_{j=1}^{N}\unicode[STIX]{x1D6E4}_{j}(t)[1+C_{j}(t)], & & \displaystyle\end{eqnarray}$$
which, again, is the same as (2.26) if the first term on the right-hand side is called
 $-\unicode[STIX]{x1D6E4}_{0}(t)$
. Therefore, since the force and moment on the foil depend only on the vorticity distributions
 $\unicode[STIX]{x1D71B}_{s}(x,t)$
and
 $\unicode[STIX]{x1D71B}_{e}(x,t)$
, the same expressions are obtained if we apply the Kutta condition at the trailing edge to the whole vorticity distribution
 $\unicode[STIX]{x1D71B}_{s}$
, or independently to each of its components in which we have separated
 $\unicode[STIX]{x1D71B}_{s}$
, which is a consequence of the linearity of the problem.
The purely formal advantage of denoting the first term on the right-hand side of (A 1) as
 $\unicode[STIX]{x1D6E4}_{0}(t)$
, i.e. of using (2.24), is that
 $\unicode[STIX]{x1D6E4}_{0}(t)$
corresponds to the quasisteady bound circulation around the foil in the absence of unsteady trailing wake and point vortices, as cleverly shown by von Kármán & Sears (Reference von Kármán and Sears1938). Thus, it is also useful to denote the second term on the right-hand side of (A 1) as
 $\unicode[STIX]{x1D6E4}_{1e}$
and the
 $N$
terms associated with
 $\unicode[STIX]{x1D6E4}_{j}$
on the right-hand side of (A 1) as
 $\unicode[STIX]{x1D6E4}_{1j}$
, as done in (2.21) and (2.25) respectively.
Appendix B. Some integrals involving
 $\unicode[STIX]{x1D71B}_{s}$

To compute (2.8), (2.9) and (2.12), one needs several moments of
 $\unicode[STIX]{x1D71B}_{s}$
(i.e. of
 $\unicode[STIX]{x1D71B}_{0}$
,
 $\unicode[STIX]{x1D71B}_{1j}$
and
 $\unicode[STIX]{x1D71B}_{1e}$
),
 $$\begin{eqnarray}\displaystyle & \displaystyle \unicode[STIX]{x2A0D}_{-1}^{1}x\unicode[STIX]{x1D71B}_{0}(x,t)\,\text{d}x=\unicode[STIX]{x03C0}({\dot{h}}+a\dot{\unicode[STIX]{x1D6FC}}-U\unicode[STIX]{x1D6FC})=\frac{1}{2}(\unicode[STIX]{x03C0}\dot{\unicode[STIX]{x1D6FC}}-\unicode[STIX]{x1D6E4}_{0}), & \displaystyle\end{eqnarray}$$
 $$\begin{eqnarray}\displaystyle & \displaystyle \unicode[STIX]{x2A0D}_{-1}^{1}x^{2}\unicode[STIX]{x1D71B}_{0}(x,t)\,\text{d}x=\frac{\unicode[STIX]{x1D6E4}_{0}}{2}-\frac{\unicode[STIX]{x03C0}}{4}\dot{\unicode[STIX]{x1D6FC}}=\unicode[STIX]{x03C0}\left[U\unicode[STIX]{x1D6FC}-{\dot{h}}-\left(a-\frac{1}{4}\right)\dot{\unicode[STIX]{x1D6FC}}\right], & \displaystyle\end{eqnarray}$$
 $$\begin{eqnarray}\displaystyle \unicode[STIX]{x2A0D}_{-1}^{1}x\unicode[STIX]{x1D71B}_{1j}(x,t)\,\text{d}x=D_{j}(t)\unicode[STIX]{x1D6E4}_{j}(t),\quad D_{j}\equiv \frac{1}{\unicode[STIX]{x03C0}}\unicode[STIX]{x2A0D}_{-1}^{1}\sqrt{1-\unicode[STIX]{x1D709}^{2}}\frac{\unicode[STIX]{x1D709}-x_{j}}{(\unicode[STIX]{x1D709}-x_{j})^{2}+z_{j}^{2}}\,\text{d}\unicode[STIX]{x1D709}, & & \displaystyle\end{eqnarray}$$
 $$\begin{eqnarray}\displaystyle \unicode[STIX]{x2A0D}_{-1}^{1}x^{2}\unicode[STIX]{x1D71B}_{1j}(x,t)\,\text{d}x=\left[\frac{C_{j}(t)}{2}+E_{j}(t)\right]\unicode[STIX]{x1D6E4}_{j}(t),\quad E_{j}\equiv \frac{1}{\unicode[STIX]{x03C0}}\unicode[STIX]{x2A0D}_{-1}^{1}\unicode[STIX]{x1D709}\sqrt{1-\unicode[STIX]{x1D709}^{2}}\frac{\unicode[STIX]{x1D709}-x_{j}}{(\unicode[STIX]{x1D709}-x_{j})^{2}+z_{j}^{2}}\,\text{d}\unicode[STIX]{x1D709}, & & \displaystyle \nonumber\\ \displaystyle & & \displaystyle\end{eqnarray}$$
 $$\begin{eqnarray}\displaystyle & \displaystyle \unicode[STIX]{x2A0D}_{-1}^{1}x\unicode[STIX]{x1D71B}_{1e}(x,t)\,\text{d}x=\int _{1}^{\infty }(\sqrt{\unicode[STIX]{x1D709}^{2}-1}-\unicode[STIX]{x1D709})\unicode[STIX]{x1D71B}_{e}(\unicode[STIX]{x1D709},t)\,\text{d}\unicode[STIX]{x1D709}, & \displaystyle\end{eqnarray}$$
 $$\begin{eqnarray}\displaystyle & \displaystyle \unicode[STIX]{x2A0D}_{-1}^{1}x^{2}\unicode[STIX]{x1D71B}_{1e}(x,t)\,\text{d}x=\int _{1}^{\infty }\left(\frac{1}{2}\sqrt{\frac{\unicode[STIX]{x1D709}+1}{\unicode[STIX]{x1D709}-1}}+\unicode[STIX]{x1D709}\sqrt{\unicode[STIX]{x1D709}^{2}-1}-\unicode[STIX]{x1D709}^{2}\right)\unicode[STIX]{x1D71B}_{e}(\unicode[STIX]{x1D709},t)\,\text{d}\unicode[STIX]{x1D709}. & \displaystyle\end{eqnarray}$$
Appendix C. The terms
$h(\unicode[STIX]{x1D70F})$
,
$\unicode[STIX]{x1D6FC}(\unicode[STIX]{x1D70F})$
,
$z_{10}(\unicode[STIX]{x1D70F})$
and
${\mathcal{G}}(\unicode[STIX]{x1D70F})$
for
$\unicode[STIX]{x1D70F}\ll 1$


For
 $\unicode[STIX]{x1D70F}\ll 1$
, one may write
 $$\begin{eqnarray}\displaystyle h\simeq h_{i0}+h_{i1}\unicode[STIX]{x1D70F}+h_{i2}\unicode[STIX]{x1D70F}^{2},\quad \unicode[STIX]{x1D6FC}\simeq \unicode[STIX]{x1D6FC}_{i0}+\unicode[STIX]{x1D6FC}_{i1}\unicode[STIX]{x1D70F}+\unicode[STIX]{x1D6FC}_{i2}\unicode[STIX]{x1D70F}^{2}, & & \displaystyle\end{eqnarray}$$
with
 $h_{i0}$
and
 $\unicode[STIX]{x1D6FC}_{i0}$
the values of
 $h$
and
 $\unicode[STIX]{x1D6FC}$
at
 $t=t_{i}$
respectively and
 $$\begin{eqnarray}\displaystyle h_{i1}+(1+a)\unicode[STIX]{x1D6FC}_{i1}=0 & & \displaystyle\end{eqnarray}$$
to satisfy (4.9) at
 $\unicode[STIX]{x1D70F}=0$
. From (4.11), one obtains, after some algebra,
 $$\begin{eqnarray}\displaystyle h_{i0}=\frac{\pm h_{0}[h_{0}+(1+a)a_{0}\cos \unicode[STIX]{x1D719}]}{[h_{0}^{2}+(1+a)^{2}a_{0}^{2}+2h_{0}a_{0}(1+a)\cos \unicode[STIX]{x1D719}]^{1/2}}, & & \displaystyle\end{eqnarray}$$
 $$\begin{eqnarray}\displaystyle h_{i1}=\frac{\pm kh_{0}(1+a)a_{0}\sin \unicode[STIX]{x1D719}}{[h_{0}^{2}+(1+a)^{2}a_{0}^{2}+2h_{0}a_{0}(1+a)\cos \unicode[STIX]{x1D719}]^{1/2}},\quad h_{12}=-\frac{k^{2}}{2}h_{i0}, & & \displaystyle\end{eqnarray}$$
 $$\begin{eqnarray}\displaystyle \unicode[STIX]{x1D6FC}_{i0}=\frac{\pm a_{0}[h_{0}\cos \unicode[STIX]{x1D719}+(1+a)a_{0}]}{[h_{0}^{2}+(1+a)^{2}a_{0}^{2}+2h_{0}a_{0}(1+a)\cos \unicode[STIX]{x1D719}]^{1/2}},\quad \unicode[STIX]{x1D6FC}_{i1}=-\frac{h_{i1}}{1+a},\quad \unicode[STIX]{x1D6FC}_{i2}=-\frac{k^{2}}{2}\unicode[STIX]{x1D6FC}_{i0}, & & \displaystyle \nonumber\\ \displaystyle & & \displaystyle\end{eqnarray}$$
where the upper sign is for the downstroke and the lower sign for the upstroke. On the other hand,
 $$\begin{eqnarray}\displaystyle z_{10}\simeq h_{i0}+(1+a)\unicode[STIX]{x1D6FC}_{i0}+[h_{i2}+(1+a)\unicode[STIX]{x1D6FC}_{i2}]\unicode[STIX]{x1D70F}^{2}\equiv z_{100}+z_{102}\unicode[STIX]{x1D70F}^{2} & & \displaystyle\end{eqnarray}$$
and
 $$\begin{eqnarray}\displaystyle {\mathcal{G}}\simeq {\mathcal{G}}_{i0}+{\mathcal{G}}_{i1}\unicode[STIX]{x1D70F}, & & \displaystyle\end{eqnarray}$$
with
 $$\begin{eqnarray}\displaystyle & \displaystyle {\mathcal{G}}_{i0}=2\unicode[STIX]{x03C0}\left[\unicode[STIX]{x1D6FC}_{i0}-h_{i1}-\left(a-{\textstyle \frac{1}{2}}\right)\unicode[STIX]{x1D6FC}_{i1}\right]F(k)-\unicode[STIX]{x03C0}\unicode[STIX]{x1D6FC}_{i1}, & \displaystyle\end{eqnarray}$$
 $$\begin{eqnarray}\displaystyle & \displaystyle {\mathcal{G}}_{i1}=2\unicode[STIX]{x03C0}\left[\unicode[STIX]{x1D6FC}_{i1}-h_{i2}-\left(a-{\textstyle \frac{1}{2}}\right)\unicode[STIX]{x1D6FC}_{i2}\right]F(k)-2\unicode[STIX]{x03C0}\unicode[STIX]{x1D6FC}_{i2}. & \displaystyle\end{eqnarray}$$



