Implications
The developed model can be used to assess the impact of a wide range of innovations on private and social profits. It can also be used in breeding programmes to derive economic values of breeding goal traits. Social profits are lower than private profits for a typical Brazilian farrow-to-finish pig farm suggesting that the society is incurring costs for the damages caused by emission of greenhouse gases (GHGs) which are not internalized by the producer. Environmental costs are higher for co-product-based diets than conventional diet suggesting that other benefits (e.g. costs and land use) should be considered to utilize co-products.
Introduction
Brazil is the fourth largest producer and exporter of pork in the world (United States Department of Agriculture, Reference Saintilan, Brossard, Vautier, Sellier, Bidanel, Van Milgen and Gilbert2014). Pig production is based mainly on an intensive system using modern technologies. In recent years, the pig industry has faced rising feed costs (Embrapa Swine and Poultry Centre, Reference Gunjal and Legault2016) and environmental problems such as emission of GHGs following from feed production and manure (Cherubini et al., Reference Cherubini, Zanghelini, Alvarenga, Franco and Soares2015; Ali et al., Reference Ali, van Zanten, Berentsen, Bastiaansen, Bikker and Oude Lansink2017). Innovations such as locally adapted production systems using alternative feed sources (Ali et al., Reference Ali, van Zanten, Berentsen, Bastiaansen, Bikker and Oude Lansink2017) and breeding programmes better suited to local conditions (Kanis et al., Reference Kruseman and Bade2005) might reduce these problems.
For making informed decisions about adopting innovations (e.g. alternative feed sources, feeding systems and breeding materials), farmers, breeders and other stakeholders need information on the impact of these innovations on farm performance. Bio-economic farm models (BEFMs) have proven to be useful tools for assessing the impacts of such innovations on technical, economic and environmental performances of farming systems (Janssen and Van Ittersum, Reference Kanis, De Greef, Hiemstra and Van Arendonk2007). A BEFM integrates biological, economic and management components of a system to explore diverse issues of farming. Several BEFMs were developed to assess the effects of – agricultural and environmental policies on farm performances of EU farming systems (Louhichi et al., Reference Martins, dos Santos Filho, Sandi, Miele, Lima, Bertol, Amaral, Morés, Kich and Dalla Costa2010); management decisions on nutrient balance of dairy farms in the Netherlands (Buysse et al., Reference Buysse, Van Huylenbroeck, Vanslembrouck and Vanrolleghem2005); agricultural policies on household income and soil fertility in Mali (Kruseman and Bade, Reference Kunz, Miele and Steinmetz1998); and nitrate directives on farm income, nitrate leaching, soil erosion and water consumption of arable farms in France (Belhouchette et al., Reference Belhouchette, Louhichi, Therond, Mouratiadou, Wery, Van Ittersum and Flichman2011). These models are, however, either location or purpose specific.
There are no generic BEFMs to assess the effects of different innovations on economic and environmental sustainability of intensive pig production systems. The application of BEFMs in pig farming has been limited to the assessment of the impact of improved breeding materials on farm (private) profit (e.g. Skorupski et al., 1995; Houška et al., 2004; Serenius et al., Reference Tol2008). However, due to the growing demand for sustainable pork following from pull (e.g. growing consumer demand for environmentally friendly products) and push (e.g. environmental regulations) factors, farmers and their stakeholders need generic models that can be used to assess the effects of different innovations on both economic and environmental sustainability of pig production systems. The available BEFMs (e.g. Skorupski et al., 1995; Houška et al., 2004; Serenius et al., Reference Tol2008) did not take into account the effects of innovations on social profit. In this study, social profit refers to private profit minus the environmental cost of pig production (and social cost refers to farm cost of production plus environmental costs that are not internalized by the farm). Next to that, most existing studies (e.g. Skorupski et al., 1995; Houška et al., 2004) followed a deterministic approach for system parameters, even though some of these parameters are stochastic in nature. For example, prices of pork, feed and replacement gilts, which are the main economic parameters in pig production, fluctuate over time. There is also a biological variation between fattening pigs (e.g. daily growth and feed intake), which ultimately results in heterogeneous slaughter weights. Stochastic BEFMs take into account the variability of components in the system when exploring effects of changing technologies. A stochastic BEFM provides expected profit with its associated variance, whereas a deterministic model calculates only profit based on the expected values of parameters. As the model is non-linear in biological parameters, a deterministic model provides wrong results. Price volatility and biological variation between pigs are sources of risk in pig farming. The decision-making process of farmers depends on their risk preferences. Farmers are often risk averse (e.g. Gunjal and Legault, Reference Gurgel and Paltsev1995). Price volatility and biological variations deter farmers from investing on innovations for increasing productivity and production, which in turn influences farm profit. Therefore, the incorporation of stochasticity in a BEFM enables to calculate the variability of farm profit which in turn provides insight into the utility of the producer that is derived from farming (e.g. via the mean-variance utility function).
In the light of the foregoing discussion, the objective of this study was to develop a stochastic BEFM as a tool for assessing the impact of innovations (e.g. alternative feeds, feeding systems and breeding materials) for a typical farrow-to-finish pig farm on private and social profits. The model was applied to the current Brazilian farrow-to-finish production system. The environmental aspect taken into account is GHGs emission. Risks associated with fluctuation of prices and variations in biological parameters are included in the model. The study is part of a project called ‘Locally adapted pork production in Brazil’ by Wageningen University & Research, Universidade Federal de Viçosa, TOPIGS Norsvin, and TOPIGS Norsvin do Brazil. The objective of the project is to improve the economic and environmental sustainability of pork production in Brazil by using locally produced alternative feed sources and by optimizing pig breeding.
Material and methods
Model design
Bio-economic farm models can take the form of a simulation model or an optimization model (Janssen and van Ittersum, Reference Kanis, De Greef, Hiemstra and Van Arendonk2007). This paper develops a simulation model rather than an optimization model, since the degrees of freedom for optimization are limited in an intensive pig production system. We assumed that available farm resources, which are given (e.g. buildings and equipment), are optimally used and the farm operates at its optimum. The time period taken into account in the model is 1 year.
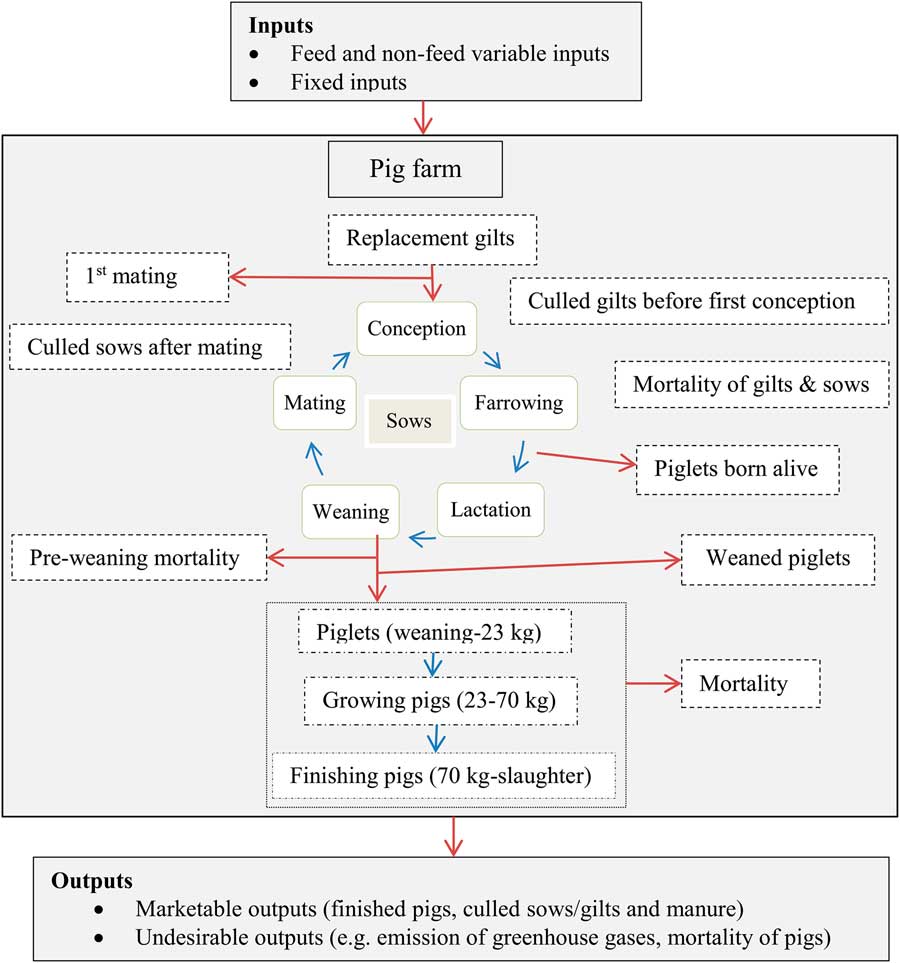
Figure 1 depicts the flow of inputs (feed and non-feed inputs) and outputs (both marketable and undesirable) and the production cycle of a sow and her piglets as it is modelled. Reproduction in the model starts with purchased replacement gilts from superior herd. Replacement gilts are mated (first mating) after a certain period of time from purchase. Conceived gilts join the sow pool. Gilts with problems (e.g. anoestrus, leg problems, udder problems, failed conception) are culled. The sow production cycle consists of conception, farrowing, lactation and weaning. After weaning, a sow will be mated or culled depending on her condition and performance. Weaned piglets pass through three growth stages – piglets (weaning to 23 kg), growing pigs (23 to 70 kg) and finishing pigs (70 kg to slaughter weight).
Flow chart of farrow-to-finish pig production system.

Variable costs of gilts and sows comprise costs of purchasing replacement gilts, feed, labour, veterinary, energy, semen, maintenance and repair, transport and others. Boar costs are included in gilt and sow costs. Variable costs of fattening pigs include costs of feed, labour, veterinary, energy, maintenance and repair, transport and others during the three growth stages. Fixed costs (depreciation and interest expenses) are included at farm level. In the social profit function, environmental costs of emission of GHGs from feed production and manure, and the fertilizer value of manure are also included. Returns consist of sales of culled gilts and sows, of fattening pigs, and of the fertilizer equivalent value of manure. Supplementary Material S1 provides the list of equations used to calculate the costs and returns of sows and fattening pigs.
Pig growth model
A pig growth model, InraPorc® model, is incorporated in the BEFM to account for the biological aspects of growing-finishing pigs (23 kg to slaughter weight) using different diets. The model predicts growth performance of pigs (i.e. daily gain, feed conversion ratio, pork quality) for different types of diets used in the growing and finishing growth stages (Van Milgen et al., Reference Diesel, Miranda and Perdomo2008). Protein deposition (PD) and lipid deposition (LD) are the two key variables related to chemical and physical body composition of pigs for predicting growth response and carcass characteristics. The InraPorc® model simulates nutrient partitioning for PD, LD and for other activities such as maintenance, physical activities and PD cost. The rate of PD and LD depends on potential PD, energy and amino acid supplies. Potential PD refers to PD when the pig is capable of expressing its full growth potential under ad libitum feeding. To predict feed intake in the InraPorc® model, the equation Y=aX b was used; where Y is net energy intake in MJ/day, X the BW in kilogram, and a and b are parameters. The parameters a and b are estimated within InraPorc® from given feed intakes at 50 and 100 kg BWs. Other parameters required for simulating growth performance in InraPorc® are: initial age, initial BW, final age or final weight, precocity per day and mean PD per day.
Environmental cost of feed and manure
Feed production and manure are the largest contributors to global warming potential (GWP) in the pork production chain (Nguyen et al., Reference Omogbenigun, Nyachoti and Slominski2012; Cherubini et al., Reference Cherubini, Zanghelini, Alvarenga, Franco and Soares2015). The environmental cost of GWP, which is caused by emission of GHGs, from feed production and manure, is incorporated in the BEFM. Global warming potential is selected as it generally also acts as an indicator of other environmental categories (e.g. acidification and eutrophication) (Röös et al., Reference Serenius, Muhonen and Stalder2013). An efficient use of nitrogen leads to less acidifying and eutrophying substances being released to the environment and lower GHGs emission in the form of N2O.
Two steps are required to calculate the environmental costs of feed and manure: determining the amounts of GWP from feed production and manure, and monetizing GWP. The GWP of feed productions were taken from Ali et al. (Reference Ali, van Zanten, Berentsen, Bastiaansen, Bikker and Oude Lansink2017). The GWP of feed production included emissions from extraction of raw materials (e.g. fertilizer, pesticide and energy), cultivation of crop ingredients (including emissions from direct land use change), drying and processing of ingredients, manufacturing of concentrated feed and transportation in all stages until the pig farm. The GWP from manure depends on manure management and the type of diets used (Dourmad et al., 2003; Rigolot et al., Reference Röös, Sundberg, Tidåker, Strid and Hansson2010). The calculation of this GWP for the different diets is presented in the ‘Model application’ section below. The three GHGs: CO2, CH4 and N2O were expressed in kilogram of CO2 equivalent (CO2-eq) using weights of 1, 28 and 265 for CO2, CH4 and N2O, respectively (assuming 100 years life span; Intergovernmental Panel on Climate Change (IPCC), 2015).
Monetizing GWP was done by using the shadow price of CO2 emission. Several studies estimated the cost of CO2 release to the atmosphere (for an overview see Tol, Reference Van Milgen, Valancogne, Dubois, Dourmad, Sève and Noblet2008). These costs are associated with the impact of CO2 release on the environment, human health and economy. There is a huge variation among the estimates in the literature (see Tol, Reference Van Milgen, Valancogne, Dubois, Dourmad, Sève and Noblet2008). Although a shadow price represents the costs of damages on environment, resources and human health caused by CO2 release, it is also a politically negotiated price for carbon. In this study, we used estimates from Gurgel and Paltsev (Reference Houška, Wolfová and Fiedler2014) for Brazil. During the 2009 Copenhagen meeting, Brazil agreed to reduce GHG emissions by between 36.1% and 38.9% by 2020. Gurgel and Paltsev (Reference Houška, Wolfová and Fiedler2014) examined a sectoral carbon tax, carbon tax on land use change, and establishing a carbon market for emission allowance trading from the agricultural and energy sectors together with a carbon tax on land use change to achieve this target. In this study, we used the average of the 2015 carbon tax for the livestock sector (about 0.07 US$/kg CO2-eq) and carbon market price (about 0.02 US$/kg CO2-eq). Even though two prices cannot exist together from economic point of view, we used the average of carbon tax and carbon market price since the carbon market price that Gurgel and Paltsev (Reference Houška, Wolfová and Fiedler2014) estimated does not account for emissions from land use change caused by the livestock sector. The shadow price that we used in this study (0.045 US$/kg CO2-eq) is comparable with the shadow price estimated by Price et al. (Reference Rezitis and Stavropoulos2007) for United Kingdom (0.048 US$/kg CO2-eq for 2015). For manure, we considered the financial gains due to the replaced fertiliser and reduction in GHGs emissions after taking account of GHG emissions from manure (refer to the ‘Model application’ section below for the Brazilian situation).
Stochastic variables
The BEFM accounts for the stochasticity of the main economic parameters (i.e. feed prices, the price of replacement gilt and the selling price of finished pig). The reason for choosing these stochastic parameters is that these variables fluctuate over time and they are expected to have substantial influence on the economic results as feed cost accounts >75% in pig cost of production and as sales of finished pigs are the main source of revenue. Fluctuations in feed prices follow the fluctuation of corn and soybean meal prices, which are the main feed ingredients.
The stochasticity of biological parameters (i.e. InraPorc® model parameters – mean PD, precocity per day, and net energy intakes at 50 and 100 kg live weights) was also considered. Performance variation among growing-finishing pigs is one of the main problems encountered by pig producers, which ultimately results in heterogeneous slaughter weights. For example, feed intake, nutrient utilization and daily growth vary between growing-finishing pigs, which in turn result in different nutrient excretions. The inclusion of stochasticity in the InraPorc® model parameters captures the variations in performance among growing-finishing pigs (e.g. daily growth, feed intake, feed conversion and excretion of nutrients). Since the model is for a typical farm, we believe that there will be no random variations in management practices over time. Only variations external to the farm (e.g. prices and biological variations between pigs) are considered. We assumed that the performance of sows in the same age structure is the same and hence random variation between the performances of sows is negligible. Introduction of stochasticity in models requires average values, the variation of the stochastic variables and the correlation among these variables. For prices, standard deviations and correlation coefficients can be derived from annual data by removing the effect of the trend term. For the InraPorc® model parameters, standard deviations and correlation coefficients can be computed from data recorded on a given farm.
Model application
The developed stochastic BEFM is applied to an independent (i.e. farrow-to-finish) pig farm in Minas Gerais to assess the impact of using alternative feed sources on private and social profits. Pig producers in Minas Gerais (and the southeast region) generally follow a farrow-to-finish production system. In Brazil, such producers are named ‘independent producers’ as these producers do not have contractual agreements with agribusinesses for receiving inputs (e.g. feed and piglets) or supplying their finished pigs. In Minas Gerais, the size of farms varies significantly ranging from 50 sows to more than 5000 sows. We assume that a typical farm in our model owns 1500 productive sows with annual replacement rate of 45% (Martins et al., Reference Monteiro, Garcia-Launay, Brossard, Wilfart and Dourmad2012). Embrapa Swine and Poultry Centre (Reference Gunjal and Legault2016) also assumes 1500 productive sows in their monthly reports of swine cost of production for Minas Gerais.
Definition of cases
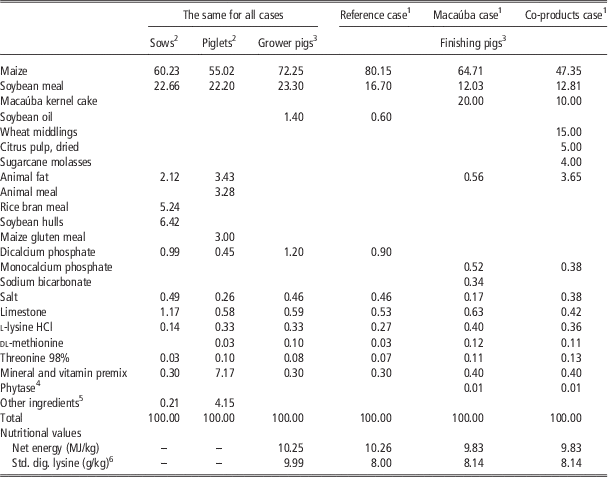
A reference case and two alternative cases (macaúba and co-products) are designed to assess the impact of using co-products in the diets of finishing pigs on private and social profits. The reference case represents the current feeding practice in Minas Gerais, Brazil. Table 1 shows the complete diet compositions used in the three cases.
Diet compositions for pigs in Minas Gerais, Brazil (% of diet in kilogram product)

1 A corn–soybean meal, macaúba kernel cake- and co-product-based finishing diets were used in the reference, macaúba and co-products cases, respectively. Diets of sows, piglets and growing pigs, which were the same in the three cases, were considered. Net energy intakes were the same.
2 Cherubini et al. (Reference Cherubini, Zanghelini, Alvarenga, Franco and Soares2015).
3 The growing and reference finishing pig diets were formulated based on data from a feed company by Gabriel Rocha. The alternative finishing diets were taken from Ali et al. (Reference Ali, van Zanten, Berentsen, Bastiaansen, Bikker and Oude Lansink2017).
4 Equivalent to 500 FTU phytase/kg diet.
5 Mycotoxin binders, flavours and sweetener agent (not included in the environmental impact analyses).
6 Standardised ileal digestible lysine.
A three-stage feeding regime is assumed for fattening pigs based on piglets (weaning to 23 kg live weight), growing pigs (23 to 70 kg) and finishing pigs (70 kg to slaughter weight). Although it is possible to predict growth performance from 15 kg to slaughter using the InraPorc® model, we assumed that the piglet stage (weaning to 23 kg) is exogenous to the model to match with the Brazilian production system. The three cases have a common part (i.e. the diets for sows, piglets and growing pigs) and a specific part (i.e. diets for finishing pigs). The cases are specific for only the finishing stage because the digestibility of co-products (which are used in the alternative finishing diets) is lower compared with corn and soybean meal, whereas the digestive capacity of finishing pigs is better than that of piglets and growing pigs. Moreover, a significant amount of feed is used in the finishing stage. The growing pig and the reference finishing pig diets were formulated to represent the current feeding practices in Minas Gerais. The finishing pig diet in the reference case mainly consists of corn and soybean meal. In the macaúba and co-products cases, a macaúba kernel cake- and a co-product-based diets are used during the finishing stages, respectively. The alternative finishing pig diets were taken from Ali et al. (Reference Ali, van Zanten, Berentsen, Bastiaansen, Bikker and Oude Lansink2017). Total net energy intakes are set to be equal in the three cases.
Management, biological and economic input parameters
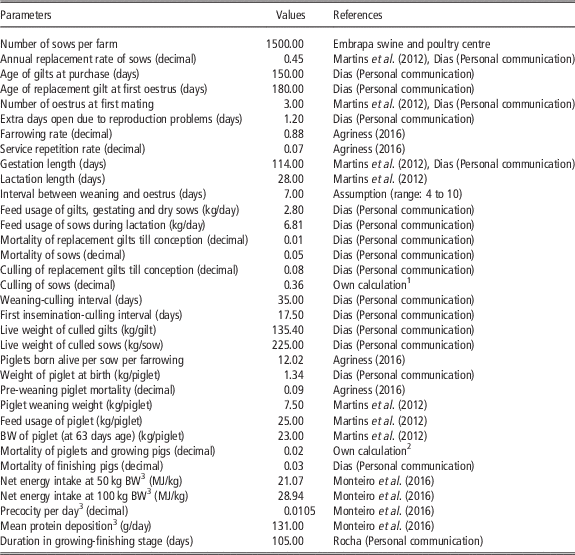
A farm that owns 1500 productive sows with an annual replacement rate of 45% is assumed. The average (2006-15) litter size born alive and pre-weaning mortality rates are about 12 piglets and 8.74%, respectively. Table 2 presents the values of management and biological input parameters of the model. Total net energy intakes are set to be equal in the three cases through the parameters net energy intakes at 50 and 100 kg BWs. We assumed that net energy intakes of growing-finishing pigs are 21.07 and 28.94 MJ/day at 50 and 100 kg BWs, respectively (Monteiro et al., Reference Nguyen, Hermansen and Mogensen2016). As the alternative diets of finishing pigs (macaúba kernel cake- and co-product-based diets) contain lower net energy concentrations (9.83 MJ/kg, Table 1) compared with the reference diet (10.26 MJ/kg, Table 1), pigs are allowed for a higher feed intake under alternative cases to realize the same net energy intake as the reference case. However, the higher feed intakes also result in increased feed costs and GHGs emissions.
Management and biological inputs of pig production in Minas Gerais, Brazil

1 Derived from annual sow replacement rate, replacement gilt culling and death rates, and sow death rate.
2 Derived from weaned piglets per sow per year, number of finished pigs per sow per year and mortality rates in the finishing stage.
3 For gilts with standard performance.
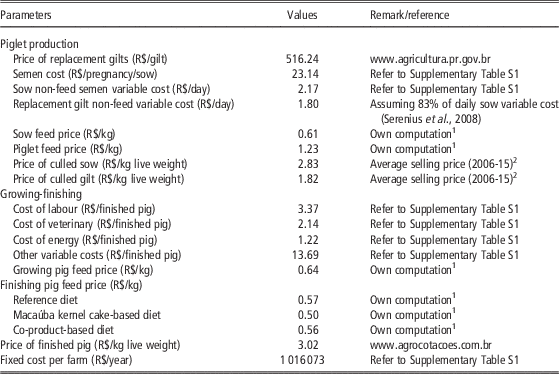
The economic input parameters of the model are presented in Table 3. The expected prices of replacement gilts and of finished pigs are the averages of annual prices in the period 2006-15. Annual prices of feeds for piglets, growing pigs, finishing pigs and sows were only available for the year 2015 from Ali et al. (Reference Ali, van Zanten, Berentsen, Bastiaansen, Bikker and Oude Lansink2017) who computed them using information on the composition and the prices of feed ingredients. Other information available were the annual feed costs of finished pigs from a database of Embrapa swine and poultry centre for the entire period 2006-15. The missing feed prices in the period 2006-14 were computed in two steps. First, we computed the annual percentage change in the feed costs of finished pigs for the period 2006-15. Next, we used the annual changes in feed cost to compute feed prices for the period 2006-14 from the 2015 prices of feeds. By doing this, we assumed that the annual changes in feed cost per finished pig over the period 2006-15 are entirely due to changes in feed prices between the same years.
Economic input values of pig production in Minas Gerais, Brazil

R$=Brazilian Real.
1 Average feed prices (2006-15) derived from annual feed cost of finished pig (Embrapa swine and poultry centre, Reference Gunjal and Legault2016).
2 Derived based on the relative price of live weight of culled gilts (R$3.45/kg) and sows (R$2.22/kg) compared to the average price of live weight of finished pigs (R$3.45/kg) from January to July 2016 in Passos, MG.
Stochastic input parameters
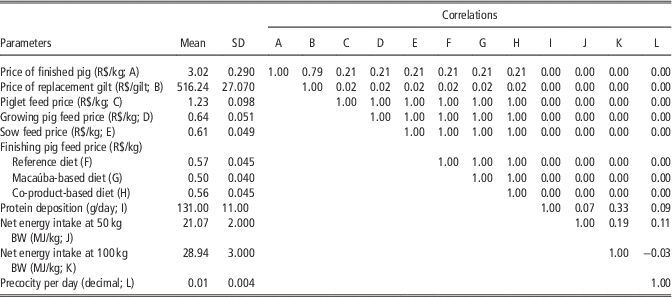
Feed prices, the price of replacement gilts and the selling price of finished pigs were assumed to be stochastic in the BEFM. Annual data (2006-15) were used to compute the means, standard deviations and correlations among these stochastic parameters. Prices were de-trended (i.e. the systematic increase or decrease in prices was removed from the original prices) to generate a price series that was used for computing the standard deviations and correlations.
For the InraPorc® model parameters, the mean values were taken from Monteiro et al. (Reference Nguyen, Hermansen and Mogensen2016) which were estimated from the Brazilian production system. For the standard deviations and correlation coefficients among these parameters, values were adopted from Saintilan et al. (Reference Skorupski, Garrick, Blair and Smith2015) who derived them based on experimental data from France. As the Brazilian production system is also based on high-potential breeds using modern technologies, we assume that the values reflect the variation in Brazil. Therefore, the variance captures performance differences between individual pigs. A normal distribution was assumed for both economic and biological parameters. Table 4 summarizes the mean values, standard deviations and correlation coefficients of the stochastic parameters. As prices and biological parameters cannot be negative, the distributions of the parameters were truncated at zero (i.e. the minimum value is 0). Simulations were conducted using @Risk, an add-in in MS Excel (Palisade Corporation, Ithaca, NY, USA).
Mean values, standard deviation and correlation coefficients among stochastic parameters

R$=Brazilian Real.
Environmental cost of feed and net return from manure
The GWP (including emissions from direct land use change) of feed ingredients were taken from Ali et al. (Reference Ali, van Zanten, Berentsen, Bastiaansen, Bikker and Oude Lansink2017). Using the emission factors of feed ingredients and diet compositions, GWP of each diet was derived. Manure is the second source of GHGs emission in pig production. For storage of manure, an open slurry tank (without a natural crust cover) is assumed, as this is the most commonly used form of pig manure management system in Brazil. The liquid manure is assumed to be removed daily or weekly from the channels of the building through pipes to the external deposit (slurry tank) where it is kept for about 120 days for partial stabilization and subsequent field application (Kunz et al., Reference Louhichi, Kanellopoulos, Janssen, Flichman, Blanco, Hengsdijk, Heckelei, Berentsen, Lansink and Van Ittersum2009; Cherubini et al., Reference Cherubini, da Silva, Zanghelini, Alvarenga, Galindro, de Léis and Soares2014). For estimating CH4 and (indirect) N2O emissions from manure, the tier 2 approach of IPCC was used by using country- and diet-specific data and IPCC (Reference Janssen and van Ittersum2006) default values. The country-specific data concern the volatile solids and nutrient excretions of sows and piglets. For sows and piglets, these data were taken from Cherubini et al. (Reference Cherubini, da Silva, Zanghelini, Alvarenga, Galindro, de Léis and Soares2014) and Diesel et al. (Reference Dourmad, Pomar and Massé2002). For pigs in the growing and finishing stages, the mathematical models of Rigolot et al. (Reference Röös, Sundberg, Tidåker, Strid and Hansson2010) and Dourmad et al. (2003) were included in the BEFM to calculate the amounts of volatile solids and nutrient excretions for the specific diets used. There is no direct N2O emission since manure is stored in an open slurry tank without natural crust cover (IPCC, Reference Janssen and van Ittersum2006; Cherubini et al., Reference Cherubini, da Silva, Zanghelini, Alvarenga, Galindro, de Léis and Soares2014). Supplementary Material S2 and Supplementary Table S2 provide the details of calculations for estimating volatile solids, nutrient excretions and GWP of manure.
In Brazil, manure is applied on land as organic fertilizer and thereby avoids the production and use of artificial fertilizer (Kunz et al., Reference Louhichi, Kanellopoulos, Janssen, Flichman, Blanco, Hengsdijk, Heckelei, Berentsen, Lansink and Van Ittersum2009; Cherubini et al., Reference Cherubini, Zanghelini, Alvarenga, Franco and Soares2015). To calculate the returns from manure we assume that the avoided fertilizers are urea (46% N), superphosphate (42% P2O5) and potassium chloride (60% K2O). Efficiency rates of 0.75 for urea (Nguyen et al., Reference Nguyen, Hermansen and Mogensen2010), 1 for superphosphate and 1 for potassium chloride were assumed to estimate the amounts of avoided fertilisers. The amounts of avoided chemical fertilisers are then calculated as:
 $$F_{{\rm N}} \,{\equals}\,{{0.75{\times}{\rm N}_{{{\rm Manure}}} } \over {0.46}}$$
 $$F_{{{\rm P}_{{\rm 2}} {\rm O}_{5} }} \,{\equals}\,{{1{\times}{\rm P}_{2} {\rm O}_{5}}_{{{\rm Manure}}} \over{0.42}}$$
 $$F_{{{\rm K}_{2} {\rm O}}} \,{\equals}\,{{1{\times}{\rm K}_{2} {\rm O}_{{{\rm Manure}}} } \over {0.60}}$$
where F
N is the amount of urea, NManure the total N excretion in the manure adjusted for N volatilisation during storage,
 $F_{{{\rm P}_{2} {\rm O}_{5} }} $
the amount of superphosphate, P2O5Manure the amount of P2O5 in the manure,
 $F_{{{\rm K}_{2} {\rm O}}} $
the amount of potassium chloride and K2OManure the amount of K2O in the manure. Then, the net return from manure is computed as:
 $$\eqalignno { {\rm Net\,\,return\,\,from\,\,manure}\,{\equals} & \,\sum P_{i} {\times}F_{i} {\plus}\sum {SP} {\times}GWP_{{F_{i} }} \cr&\; {\minus}SP {\times}GWP_{{{\rm Manure}}} $$
where P
i
is price of artificial fertilizer i; i refers to N, P2O5 and K2O; F
i
the amount of avoided fertilizer i; SP the shadow price of GWP;
 $GWP_{{F_{i} }} $
is GWP of artificial fertilizer production and GWP
Manure is GWP of manure. The first term
 $( {\sum P_{i} {\times}F_{i} } )$
refers to the fertilizer value of manure, the second term
 $( {\sum {SP}{\times}GWP_{{F_{i} }} } )$
implies the avoided environmental cost due to the avoided production of artificial fertilizer and the last term (SP×GWP
Manure) is the environmental cost of manure. Supplementary Table S3 provides the details of calculations and parameter values for computing the net return from manure.
Sensitivity analysis
We checked the sensitivity of private profit due to a change in the price of the macaúba kernel cake-based diet. As discussed in Ali et al. (Reference Ali, van Zanten, Berentsen, Bastiaansen, Bikker and Oude Lansink2017), the price of macaúba kernel cake was based on only processing cost as the product is non-existent in market. Commercialization of the production and processing system of macaúba, however, might make it a competitive product. Therefore, in the sensitivity analysis we assumed an increase of the price of the macaúba kernel cake-based finishing diet by 14%. This increase would make the price of the macaúba kernel cake-based diet equal to the price of the reference diet.
Results
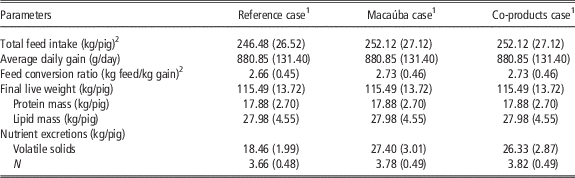
Table 5 presents the simulated pig growth performance results and nutrient excretions of the growing-finishing stage for the three cases. Carcass characteristics (i.e. slaughter weight, protein and lipid masses) are equal among the three cases. Average daily gain is also equal in the three cases as daily net energy intake was set equal in the three cases. The reference case resulted in better feed conversion ratio than the alternative cases since the net energy concentration of the reference finishing pig diet (10.26 MJ/kg) is larger than of the alternative finishing pig diets (9.83 MJ/kg). Since pigs were allowed the same net energy intake under the three cases, total feed intakes are larger under the alternative cases (252 kg) compared with the reference case (246 kg). Feed intake is equal for macaúba and co-products cases as the nutritional values of the diets used in these two cases were equal. The excretions of volatile solids are greater under the macaúba (27 kg/pig) and co-products (26 kg/pig) cases than the reference case (18 kg/pig). This is due to the higher fibre concentrations in the alternative diets of finishing pigs (97.1 g/kg for macaúba kernel cake-based diet and 73.3 g/kg for co-product-based diet) than the reference diet (23.3 g/kg). Nitrogen excretion is slightly higher under the alternative cases (by about 140 g/finished pig) following from the higher feed intakes although the CP concentrations of the diets are comparable (144.2 g/kg for the reference diet, 143.7 g/kg for macaúba kernel cake-based diet and 145.9 g/kg for co-product-based diet). Table 5 also shows the performance variations among growing-finishing pigs (e.g. live weight at slaughter, feed conversion ratio and nutrient excretions) following from the variations in mean PD, precocity per day and net energy intakes at 50 and 100 kg live weights. For example, the CV of live weights of finished pigs at slaughter is about 12% implying the presence of heterogeneity in live weights of finished pigs after 105 days of fattening.
Simulated growth performance and nutrient excretion results of growing-finishing pigs (23 kg to slaughter weight; simulated with InraPorc®)

Figures in parentheses refer to standard deviations.
1 A corn–soybean meal, macaúba kernel cake- and co-product-based finishing diets were used in the reference, macaúba and co-products cases, respectively. Diets of sows, piglets and growing pigs, which were the same in the three cases, were considered. Net energy intakes were the same in the three cases.
2 Including average feed consumption by lost pigs during fattening.
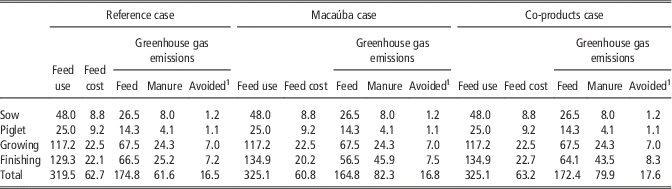
The details of feed intake and cost, and GHG emissions from feed production and manure at the different stages of finishing a pig are summarized in Table 6. The total feed intake in the growing-finishing stage (Table 5) can be decomposed into the growing stage (117 kg) and the finishing stage 129 kg for the reference case and 135 kg for the alternative cases. Although feed intake is higher in the finishing stage than in the growing stage, feed cost and emissions are comparable between the two stages as larger volumes of high-quality ingredients (e.g. soybean oil) and supplements (e.g. lysine) are used in the growing diet (Table 1), which raise feed cost and GHG emissions. Feed costs and emissions of sows, piglets and growing pigs are the same under the three cases. Although the unit prices of finishing diets (R$/kg feed) are lower for the alternative cases (0.50 for macaúba and 0.56 for co-products cases) than the reference case (0.57), the higher feed intakes in the alternative cases (135 kg) than the reference case (129 kg) reduced (and even outweighed in the co-products case) the price advantages. Similarly, the higher feed intakes in the alternative cases reduced their environmental cost advantages from feed production although the unit GHG emissions (kg CO2-eq/kg feed) are lower for the alternative finishing diets (0.419 for macaúba and 0.475 for co-products cases) than for the reference diet (0.514). Emissions from manure are higher for the alternative cases than the reference case due to the higher volumes of volatile solids (Table 5) following from the higher fibre concentrations, and higher feed intakes. The avoided emissions, due to the replacement of artificial fertiliser by manure, are comparable among the three cases (refer to Supplementary Table S3 for details).
Summary of feed intake (kg), feed cost (US$) and greenhouse gas (kg CO2 equivalent) emissions from feed production and manure per finished pig at different stages of production

1 Avoided emissions of greenhouse gas due to the replacement of artificial fertilizer with manure.
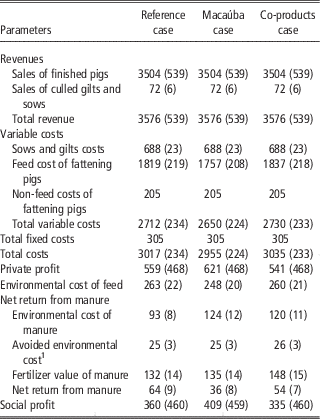
Annual farm level revenues, costs, private profit and social profit are presented in Table 7. Expected private profit per farm per year is about 11% higher for the macaúba case than the reference case, whereas it is about 3% lower for the co-products case. This difference is due to the differences in feed cost (Table 6). The environmental cost of feed per farm per year is about 6% lower for the macaúba case and 1% lower for the co-products case than the reference case. The environmental cost of manure is about 33% higher for the macaúba case and 29% higher for the co-products case compared with the reference case. This increase is due to the higher fibre concentrations in the alternative diets which result in higher methane emissions (Rigolot et al., Reference Röös, Sundberg, Tidåker, Strid and Hansson2010) and to the higher feed intakes in the alternative cases. Social profit is about 14% higher for macaúba case compared with the reference case, whereas it is about 7% lower for the co-products case. However, net environmental costs (i.e. environmental cost of feed minus net return from manure) are higher under the alternative cases (by about 7% in the macaúba case and by 4% in the co-products case) than under the reference case.
Revenues, costs, private profit and social profit per year for a typical Brazilian farrow-to-finish pig farm (×1000 US$)

Figures in parentheses refer to standard deviations.
1 Avoided environmental cost due to the replacement of artificial fertilizer with manure.
Results in Table 7 also show that social profit is about 36% lower than private profit for the reference case, 34% lower for the macaúba case and 38% lower for the co-products case. Although the net returns from manure are positive, social profits are lower than private profits due to the environmental costs of feeds. When the net return from manure is excluded from the model (i.e. if we include the environmental cost of only feed), social profit is about 47% lower than private profit in the reference, 40% lower in the macaúba case and 48% lower in the co-products case. The variabilities of farm profits, measured by the standard deviations, are high relative to the mean values (e.g. with coefficients of variation between 75% and 87% for private profits). The variability of profits is comparable among the three cases as the higher feed intakes in the alternative cases compensate the small differences in the volatility of prices of finishing pig diets.
The result of the sensitivity analysis show that a 14% increase in the price of macaúba kernel cake-based finishing pig diet results in about 15% decrease in profits under the macaúba case, which makes the profit in the macaúba case about 6% lower compared with the reference case. Private profits for the reference and macaúba cases are equal when the price of the macaúba kernel cake-based diet increases by 9.2% (given other parameters constant).
Discussion
The expected private profit of pig farming in Minas Gerais (Brazil) is 558 908 US$/farm per year. This is equivalent to a profit of 0.14 US$/kg live weight pig. However, this profit does not account for the costs of feed manufacturing (i.e. grinding and pelleting) and feed transport between the feed mill and pig farm. The profit computed in this paper is slightly higher than the profit computed based on the cost of production from Embrapa swine and poultry centre for Minas Gerais. Using the average cost of production (2006-15) (Embrapa Swine and Poultry Centre, Reference Gunjal and Legault2016) and the average selling price of finished pigs (2006-15) in Minas Gerais (www.agrocotacoes.com.br), average profit per kilogram live weight was 0.13 US$. The difference could be attributed to the use of different input values (e.g. feed prices due to difference in diet compositions).
The introduction of stochasticity in the BEFM provides insights into the distribution of the profit of pig farming. Although the expected profit of pig farming in Minas Gerais is positive (the probability of making a loss being about 11%), its variability is substantial due to the stochasticity of prices and biological parameters. Price volatility affects investment decisions, production levels, profitability and ultimately long run economic growth. Rezitis and Stavropoulos (Reference Rigolot, Espagnol, Pomar and Dourmad2009) showed that pork price volatility has a negative effect on production levels. Variability in the economic and biological parameters deters farmers from adopting innovations for increasing productivity and production. Therefore, stabilization of pork and feed prices, and reducing performance differences between pigs contribute to the improvement of the pig industry via increased investments.
The use of co-products in the diets of pigs might help to hedge against rising and fluctuating prices of the current system, which mainly depend on high-quality feed ingredients (i.e. corn and soybean meal). In the current study, due to lack of historical prices on co-products, we assumed that the variabilities of the three finishing diets follow the same trend. However, in practice the prices of co-products might not perfectly be correlated with the prices of corn and soybean meal. If that is the case, pig producers may use co-products to reduce the impact of price volatility of the conventional ingredients. The use of co-products in the diets of pigs including macaúba kernel cake has also other benefits that are not included in this study. For example, the use of co-products reduces the competition for cropland between the feed and food sectors and thereby contributes to food security by making available cropland for food crops production (Ali et al., Reference Ali, van Zanten, Berentsen, Bastiaansen, Bikker and Oude Lansink2017).
In the current study, the use of co-products in the diets of pigs is limited to the finishing stage (70 kg to slaughter weight) due to the low digestibility of co-products and higher digestive capacity of finishing pigs than piglets and growing pigs. The finishing stage is the most important stage of pig production since 40% of feed is used in this stage (and feed conversion ratio worsens with the age of finishing pigs) which raise feed cost and emission of GHGs. The associated land use for feed production is also large compared with other stages of production. Research has been done to improve the digestibility of low-quality ingredients (e.g. Omogbenigun et al., Reference Price, Thornton and Nelson2004) and to improve the digestive capacity of pigs via breeding that might increase the use of co-products in different stages of production. The supply of co-products is also limited compared with conventional ingredients (e.g. corn and soybean meal). Therefore, the current step that we followed (replacing at the finishing stage) would already be a substantial change.
To build the BEFM, a number of assumptions and simplifications were needed as with any model. Additional social costs can be thought of as well as additional social benefits. The only environmental cost included was that of GHGs emission from feed production and manure while excluding other environmental impacts and GHGs emission from other stages of production. The fertiliser value of manure was also included. With only these environmental costs and fertiliser value of manure included, the social profit of pig farming is 34% to 38% lower than the private profit implying that the society is incurring costs for the damages caused by emission of GHGs, which are not internalized by the producer. The inclusion of other environmental costs (e.g. acidification, eutrophication and GHGs emission from other stages of production) would further reduce the social profit. However, the current overestimation of social profit does not affect the comparison of the effect of innovations on private and social profits since the directions of changes remain the same. The emphasis on feed production and manure is reasonable, as these are the main contributors to environmental problems in the pig production chain (Nguyen et al., Reference Omogbenigun, Nyachoti and Slominski2012; Cherubini et al., Reference Cherubini, Zanghelini, Alvarenga, Franco and Soares2015).
The net return from manure, the difference between its value as a fertiliser and its net environmental cost, was included in the BEFM. The net return from manure was positive in all three cases. The fertiliser equivalent value of manure was calculated by using the prices of artificial fertilisers. Although we used a lower efficiency rate for the N fertiliser (75%), the use of the prices of artificial fertilisers could still overvalue manure as the efficiency, and convenience for transportation and application are lower for manure compared with artificial fertiliser. Therefore, the results of the social profits are overvalued following from the use of prices of artificial fertiliser for manure. We also did not take into account processes beyond manure storage such as emissions during transport and field application. The use of manure as a fertiliser helps to improve the soil structure (by improving organic matter). We also did not consider this advantage of manure over artificial fertiliser. Results will be affected if these costs and benefits are considered. Finally, availability of land for manure application close to a pig farm is a requirement in order to realize the benefits of manure as a fertiliser. This will not always be the case.
Conclusions
The objective of this paper was to develop a stochastic BEFM for assessing the impact of innovations on private and social profits of a typical farrow-to-finish pig farm. The empirical application focussed on assessing the impact of using co-products in the diets of finishing pigs on private and social profits of a Brazilian pig farm. The developed model is a generic model that can be adapted to other regional production systems (e.g. feeding system, manure management) to assess the impact of a wide range of innovations on private and social profits. For a typical Brazilian farrow-to-finish pig farm, social profits are (34% to 38%) lower than private profits. The use of co-products does not always result in higher profits compared with the reference case. Private and social profits are higher for the macaúba case (11% and 14%, respectively); whereas they are lower for the co-products case (3% and 7%, respectively) than the reference case. Other benefits of co-products (e.g. improving land use efficiency and reducing emissions from land use change) should also be taken into account to utilize co-products. The CV of farm profits is between 75% and 87% in the three cases.
Acknowledgements
This work was financially supported by the Netherlands Organisation for Scientific Research (NWO) through the LocalPork project W 08.250.102 in the Food and Business Global Challenges Program. The authors are grateful to Delmira Adelaide Dias for providing us data on technical performance indicators of pig production. The authors are also grateful to Claudia Sevillano for translations during farm visit and to Gabriel Rocha for formulating diets.
Supplementary Material
To view supplementary material for this article, please visit https://doi.org/10.1017/S1751731117002531