
1. Introduction
The kinetic helicity, defined as the  $L^2$-inner product of velocity
 $\boldsymbol {u}$ and vorticity
 $\boldsymbol {\omega }$, has dynamical, topological, geometrical and statistical interpretations in turbulence. It is a dynamical and topological inviscid invariant, where the latter refers to its connection with the linking number of infinitesimal vortex lines (Moffatt Reference Moffatt1969). Geometrically, it quantifies the alignment of velocity and vorticity in a volume-averaged sense. Within a statistical approach to turbulence, helicity is the correlation between velocity and vorticity. In a rotationally invariant ensemble, it is connected to the breaking of the symmetry under inversion of all axes. Inspired by its relevance to turbulence in atmospheric flows (Lilly Reference Lilly1986), dynamical and statistical effects connected with helicity have been studied in the atmospheric boundary layer (Deusebio & Lindborg Reference Deusebio and Lindborg2014) and in rotating turbulence (Mininni & Pouquet Reference Mininni and Pouquet2010a,Reference Mininni and Pouquetb), and more generally in homogeneous and isotropic turbulence (Chen, Chen & Eyink Reference Chen, Chen and Eyink2003a; Chen et al. Reference Chen, Chen, Eyink and Holm2003b; Gledzer & Chkhetiani Reference Gledzer and Chkhetiani2015; Kessar et al. Reference Kessar, Plunian, Stepanov and Balarac2015; Sahoo, Bonaccorso & Biferale Reference Sahoo, Bonaccorso and Biferale2015; Stepanov et al. Reference Stepanov, Golbraikh, Frick and Shestakov2015; Alexakis Reference Alexakis2017; Sahoo, Alexakis & Biferale Reference Sahoo, Alexakis and Biferale2017; Yan et al. Reference Yan, Li, Yu, Wang and Chen2020; Milanese, Loureiro & Boldyrev Reference Milanese, Loureiro and Boldyrev2021), as well as shear flows (Yan et al. Reference Yan, Li, Yu, Wang and Chen2020; Yu et al. Reference Yu, Hu, Yan and Li2022) and in laboratory experiments (Scheeler et al. Reference Scheeler, van Rees, Kedia, Kleckner and Irvine2017).
The level of helicity in a turbulent flow affects turbulent statistics and dynamics, and is thus of relevance from a fundamental theory perspective as well as for subgrid-scale (SGS) modelling. As an alignment of velocity and vorticity weakens the nonlinearity of the Navier–Stokes equations, high levels of helicity have been connected with a depletion of the kinetic energy flux across scales by an analysis of the coupling between helical Fourier modes (Kraichnan Reference Kraichnan1973), and with regions of low dissipation (Moffatt Reference Moffatt2014). These effects can be quantified by upper bound theory applied to helical forcing and direct numerical simulation – the energy flux of turbulence sustained by fully helical forcing is approximately  $30\,\%$ lower than in the non-helical case (Linkmann Reference Linkmann2018).
Helicity affects turbulence not only globally, that is, in terms of mean energy fluxes, but also on a scale-by-scale level. As a solenoidal vector field, the velocity field  $\boldsymbol {u}$ can be decomposed into positively and negatively helical components
 $\boldsymbol {u}^\pm$ (Herring Reference Herring1974; Constantin & Majda Reference Constantin and Majda1988; Waleffe Reference Waleffe1992),
 $\boldsymbol {u}(\boldsymbol {x},t) =\boldsymbol {u}^+(\boldsymbol {x},t) + \boldsymbol {u}^-(\boldsymbol {x},t)$, where
 $\boldsymbol {u}^\pm$ are obtained by projecting the Fourier coefficients
 $\hat {\boldsymbol {u}}(\boldsymbol {k},t)$ onto basis vectors which are eigenfunctions of the curl operator in Fourier space. That is,
 $\hat {\boldsymbol {u}}^\pm (\boldsymbol {k},t) = u^\pm (\boldsymbol {k},t) \boldsymbol {h}^\pm (\boldsymbol {k})$, where
 $i \boldsymbol {k} \times k\boldsymbol {h}^\pm (\boldsymbol {k}) = \pm \boldsymbol {h}^\pm (\boldsymbol {k})$ and
 $u^\pm (\boldsymbol {k},t) = \hat {\boldsymbol {u}}(\boldsymbol {k},t) \boldsymbol {{\cdot }} \boldsymbol {h}^\pm (\boldsymbol {k})$. The energy flux can then be decomposed into different triadic couplings between positively and negatively helical velocity-field fluctuations (Waleffe Reference Waleffe1992). Interestingly, interactions among helical Fourier modes of like-signed helicity lead to an inverse energy transfer across scales in the inertial range (Waleffe Reference Waleffe1992; Biferale, Musacchio & Toschi Reference Biferale, Musacchio and Toschi2012, Reference Biferale, Musacchio and Toschi2013; Sahoo et al. Reference Sahoo, Bonaccorso and Biferale2015), while interactions of oppositely-signed helical modes transfer energy from large to small scales (Waleffe Reference Waleffe1992; Alexakis Reference Alexakis2017; Alexakis & Biferale Reference Alexakis and Biferale2018). For turbulent flows of electrically conducting fluids, such as liquid metals or plasmas in the fluid approximation, helicity alters the evolution of both velocity and magnetic-field fluctuations profoundly. Here, small-scale kinetic helicity facilitates the formation of large-scale coherent magnetic structures through the large-scale dynamo (Steenbeck, Krause & Rädler Reference Steenbeck, Krause and Rädler1966; Brandenburg Reference Brandenburg2001; Brandenburg & Subramanian Reference Brandenburg and Subramanian2005; Tobias, Cattaneo & Boldyrev Reference Tobias, Cattaneo and Boldyrev2013; Linkmann et al. Reference Linkmann, Berera, McKay and Jäger2016, Reference Linkmann, Sahoo, McKay, Berera and Biferale2017).
The cascade of kinetic helicity itself is predicted to be direct, that is, it proceeds from large to small scales (Brissaud et al. Reference Brissaud, Frisch, Léorat, Lesieur and Mazure1973; Waleffe Reference Waleffe1992), and scale-local (Eyink Reference Eyink2005). It results, as discussed by Eyink (Reference Eyink2006) in the context of a multi-scale gradient expansion, from a twisting of small-scale vortices into a local alignment with the small-scale velocity fluctuations by large-scale differential vorticity (‘screw’). However, being sign-indefinite, numerical results on helicity fluxes can be difficult to interpret as a loss of positive helicity at a given scale may be viewed as a gain of negative helicity at the same scale.
In the context of SGS modelling, the effect helicity has on a turbulent flow is usually taken into account through additional diffusive model terms (Yokoi & Yoshizawa Reference Yokoi and Yoshizawa1993; Li et al. Reference Li, Meneveau, Chen and Eyink2006; Baerenzung et al. Reference Baerenzung, Politano, Ponty and Pouquet2008; Inagaki, Yokoi & Hamba Reference Inagaki, Yokoi and Hamba2017). However, a combination of a priori and a posteriori analyses of different SGS models for isotropic helical turbulence found the effect of the additional diffusive model terms to be small and that a classical Smagorinsky model best represents the resolved-scale dynamics (Li et al. Reference Li, Meneveau, Chen and Eyink2006). Similarly, based on analytical and numerical results, Linkmann (Reference Linkmann2018) suggests an adjustment of the Smagorinsky constant to account for high levels of helicity. So far, SGS analyses of helical turbulence have mainly been concerned with energy transfers.
Here, we focus on the helicity flux across scales in statistically stationary homogeneous and isotropic turbulence, with large-scale forcing breaking mirror symmetry. For the energy flux, the Betchov (Reference Betchov1956) relation states that the mean contribution from vortex stretching to the energy cascade is triple that due to strain self-amplification. Carbone & Wilczek (Reference Carbone and Wilczek2022) recently showed that there are no further kinematic relations for the energy flux in statistically stationary homogeneous and isotropic turbulence with zero net helicity. However, we prove here that a new exact kinematic Betchov-type relation exists for the mean helicity flux. Furthermore, we also present an exact decomposition of the helicity flux in analogy to that of the kinetic energy flux derived by Johnson (Reference Johnson2020, Reference Johnson2021), whereby the relative contributions of physical mechanisms, such as vortex stretching and strain self-amplification, to the energy cascade can be quantified in terms of the overall contribution and their scale locality. The aim is to identify physical mechanisms that transfer kinetic helicity across scales and to quantify their relative contributions to the mean helicity flux and its fluctuations, which may be useful for the construction of SGS models when resolving the helicity cascade is of interest.
2. Exact decomposition of the kinetic helicity flux
To derive the aforementioned exact decomposition of the helicity flux and relations between the resulting subfluxes, we begin with the three-dimensional (3-D) incompressible Navier–Stokes equations, here written in component form:
 \begin{gather} \partial_t u_i + \partial_j\left (u_i u_j \right)={-} \partial_j p \delta_{ij} + 2 \nu \partial_j S_{ij} + f_i , \end{gather}
 \begin{gather}\partial_j u_j = 0 , \end{gather}
where  $\boldsymbol {u} = (u_1, u_2, u_3)$ is the velocity field,
 $p$ the pressure divided by the constant density,
 $\nu$ the kinematic viscosity,
 $S_{ij}$ the rate-of-strain tensor and
 $\boldsymbol {f} = (f_1, f_2, f_3)$ an external solenoidal force that may be present. To define the helicity flux across scales, we introduce a filtering operation to separate large- and small-scale dynamics (e.g. Germano Reference Germano1992). Specifically, for a generic function
 $\phi$, the filtered version at scale
 $\ell$ is
 $\bar {\phi }^\ell = G^\ell * \phi$, where
 $G^\ell$ is a filter kernel with filter width
 $\ell$ and the asterisk denotes the convolution operation. Applying the filter to the Navier–Stokes equations (2.1)–(2.2) results in
 \begin{equation} \partial_t \bar{u}^\ell_i + \partial_j\left( \bar{u}^\ell_i \bar{u}^\ell_j + \bar{p}^\ell \delta_{ij} - 2 \nu \bar{S}^\ell_{ij} + \tau_{ij}^\ell \right) = \bar{f}_i^\ell,\\ \end{equation}
where  $\tau _{ij}^\ell = \tau ^\ell (u_i, u_j) = \overline {u_i u_j}^\ell - \bar {u}^\ell _i \bar {u}^\ell _j$ is the SGS stress tensor. Here, we follow the notation of Germano (Reference Germano1992) in defining the generalised second moment for any two fields as
 $\tau ^\ell (a,b) = \overline {ab}^\ell - \bar {a}^\ell \bar {b}^\ell$. We also require the filtered vorticity equation
 \begin{equation} \partial_t \bar{\omega}^\ell_i + \partial_j\left( \bar{\omega}^\ell_i \bar{u}^\ell_j - \bar{u}^\ell_i \bar{\omega}^\ell_j - \nu \partial_j \bar{\omega}^\ell_i \right) - \bar{g}_i^\ell ={-} \partial_j\left(\epsilon_{imn} \partial_m \tau^\ell_{nj} \right) , \end{equation}
where  $\boldsymbol {g} = \boldsymbol {\nabla } \times \boldsymbol {f}$. The large-scale helicity density,
 $H^\ell = \bar {u}^\ell _i \bar {\omega }^\ell _i$, then evolves according to
 $$\begin{gather} \partial_t H^\ell + \partial_j \left[ H^\ell \bar{u}^\ell_j + (\bar{p}^\ell - \tfrac{1}{2} \bar{u}^\ell_i \bar{u}^\ell_i) \bar{\omega}^\ell_j - \nu \partial_j H^\ell \right] + 2\nu ( \partial_j \bar{u}^\ell_i )( \partial_j \bar{\omega}^\ell_i ) - \bar{\omega}_i^\ell\bar{f}_i^\ell - \bar{u}_i^\ell\bar{g}_i^\ell \nonumber\\ ={-} \partial_j \left[ 2 \bar{\omega}^\ell_i \tau^\ell_{ij} + \epsilon_{ijk} \bar{u}^\ell_i \partial_m \tau^\ell_{km} \right] + 2 \tau^\ell_{ij} \partial_j \bar{\omega}^\ell_i. \end{gather}$$
The last term in this equation is the helicity flux
 \begin{equation} \varPi^{H, \ell} ={-} 2\tau^\ell_{ij} \partial_j \bar{\omega}^\ell_i , \end{equation}
and is the central focus herein. It has an alternative form (Yan et al. Reference Yan, Li, Yu, Wang and Chen2020),
 \begin{equation} \tilde{\varPi}^{H, \ell} ={-} \tau^\ell_{ij} \partial_j \bar{\omega}^\ell_i - \left[ \tau^\ell(\omega_i, u_j) - \tau^\ell(u_i, \omega_j) \right] \partial_j \bar{u}^\ell_i , \end{equation}
and it can be shown that the right-hand side of (2.6) and (2.7) differ by an expression that can be written as a divergence and therefore vanishes after averaging spatially, at least for statistically homogeneous turbulence (Yan et al. Reference Yan, Li, Yu, Wang and Chen2020). This implies  $\langle \varPi ^{H, \ell } \rangle = \langle \tilde \varPi ^{H, \ell } \rangle$. Eyink (Reference Eyink2006) links the first term in (2.7) – which is proportional to
 $\varPi ^{H, \ell }$ – to vortex twisting and Yan et al. (Reference Yan, Li, Yu, Wang and Chen2020) attribute the second term to vortex stretching. In what follows we discuss an exact decomposition of
 $\varPi ^{H, \ell }$, and show that both effects can be identified therein. We also use
 $\varPi ^{H, \ell }$ for our numerical evaluations (cf. Chen et al. Reference Chen, Chen and Eyink2003a; Eyink Reference Eyink2006).
2.1. Gaussian filter relations for the helicity flux
So far all expressions are exact and filter-independent. To derive exact decompositions of the helicity flux in both representations, we now focus on Gaussian filters. For that case, Johnson (Reference Johnson2020, Reference Johnson2021) showed that the SGS stresses can be obtained as the solution of a forced diffusion equation with  $\ell ^2$ being the time-like variable, resulting in
 \begin{equation} \tau_{ij}^\ell = \tau^\ell(u_i, u_j) = \ell^2 \bar{A}_{ik}^\ell \bar{A}_{jk}^\ell + \int_{0}^{\ell^2} \,\mathrm{d}\theta\ \tau^\phi\left( \bar{A}_{ik}^{\sqrt{\theta}}, \bar{A}_{kj}^{\sqrt{\theta}} \right) , \end{equation}
where  $\phi (\theta ) = \sqrt {\ell ^2 - \theta }$ and
 $A_{ij} = \partial _j u_i$ are the velocity-field gradients. Since the SGS stress tensor
 $\tau ^\ell _{ij}$ is symmetric, for the first form of the helicity flux we obtain in analogy to the energy flux
 \begin{equation} \varPi^{H, \ell} ={-} 2 \tau^\ell_{ij} \bar{S}^\ell_{\omega,ij} , \end{equation}
where  $S_\omega$ is the symmetric component of the vorticity gradient tensor, with components
 $S_{\omega, ij} = (\partial _j \omega _i + \partial _i \omega _j)/2$. Employing (2.8) this yields
 \begin{equation} \varPi^{H,\ell} ={-} 2 \ell^2 \bar{S}^\ell_{\omega,ij} \bar{A}_{ik}^\ell \bar{A}_{jk}^\ell - 2 \int_{0}^{\ell^2} \,\mathrm{d}\theta\ \bar{S}^\ell_{\omega,ij} \tau^\phi\left( \bar{A}_{ik}^{\sqrt{\theta}}, \bar{A}_{kj}^{\sqrt{\theta}} \right) . \end{equation}
The first term involves a product of gradient tensors filtered at the same scale,  $\ell$; hence we refer to it as being single-scale, and denote it
 $\varPi _s^{H,\ell }$. In mean, it coincides with the nonlinear LES model for the SGS stresses (Eyink Reference Eyink2006). In contrast, the second term encodes the correlation between resolved-scale vorticity-field gradients and (summed) velocity-field gradients at each scale smaller than
 $\ell$, so that we refer to it as multi-scale.
Splitting the velocity gradient tensors into symmetric and antisymmetric parts, that is, into the rate-of-strain tensor  $\boldsymbol{\mathsf{S}} = (\boldsymbol{\mathsf{A}} + \boldsymbol{\mathsf{A}}^t)/2$ and vorticity tensor
 ${\boldsymbol{\mathsf{\Omega}}} = (\boldsymbol{\mathsf{A}}-\boldsymbol{\mathsf{A}}^t)/2$, where
 $\boldsymbol{\mathsf{A}}^t$ is the transpose of
 $\boldsymbol{\mathsf{A}}$, the helicity flux can be decomposed into six subfluxes:
 \begin{equation} \varPi^{H,\ell} = \varPi_{s, SS}^{{H},\ell} + \varPi_{s,\varOmega\varOmega}^{{H},\ell} + \varPi_{s,S\varOmega}^{{H},\ell} + \varPi_{m,SS}^{{H},\ell} + \varPi_{m,\varOmega\varOmega}^{{H},\ell} + \varPi_{m,S\varOmega}^{{H},\ell} , \end{equation}
where the single-scale terms are
 \begin{gather} \varPi_{s,SS}^{H,\ell} ={-} 2 \ell^2 \bar{S}^\ell_{\omega,ij} \bar{S}_{ik}^\ell \bar{S}_{jk}^\ell ={-} 2 \ell^2 {\rm tr}\left\{ {(\bar{\boldsymbol{\mathsf{S}}}^\ell_\omega)^t \bar{\boldsymbol{\mathsf{S}}}^\ell (\bar{\boldsymbol{\mathsf{S}}}^\ell)^t} \right\} , \end{gather}
 \begin{gather}\varPi_{s,\varOmega\varOmega}^{H,\ell} ={-} 2 \ell^2 \bar{S}^\ell_{\omega,ij} \bar{\varOmega}_{ik}^\ell \bar{\varOmega}_{jk}^\ell ={-}2 \ell^2 {\rm tr}\left\{ {(\bar{\boldsymbol{\mathsf{S}}}^\ell_\omega)^t \bar{{\boldsymbol{\mathsf{\Omega}}}}^\ell (\bar{{\boldsymbol{\mathsf{\Omega}}}}^\ell)^t} \right\} , \end{gather}
 \begin{gather}\varPi_{s, S\varOmega}^{H,\ell} ={-} 2 \ell^2 \bar{S}^\ell_{\omega,ij} \left ( \bar{S}_{ik}^\ell \bar{\varOmega}_{jk}^\ell - \bar{\varOmega}_{ik}^\ell \bar{S}_{jk}^\ell \right ) ={-}4 \ell^2 {\rm tr}\left\{ {(\bar{\boldsymbol{\mathsf{S}}}^\ell_\omega)^t \bar{\boldsymbol{\mathsf{S}}}^\ell (\bar{{\boldsymbol{\mathsf{\Omega}}}}^\ell)^t} \right\} , \end{gather}
and  ${\rm tr}\left \{ {{\cdot }} \right \}$ denotes the trace. We purposefully retained the transposition operation here also for symmetric tensors to show what the approach needs to be when the tensors involved are not symmetric. Similarly, the multi-scale terms are
 \begin{align} \varPi_{m,SS}^{H,\ell} &={-} 2 \int_{0}^{\ell^2}\, \mathrm{d}\theta\ \bar{S}^\ell_{\omega,ij} \tau^\phi\left( \bar{S}_{ik}^{\sqrt{\theta}}, \bar{S}_{kj}^{\sqrt{\theta}} \right) , \end{align}
 \begin{align} \varPi_{m,\varOmega\varOmega}^{H,\ell} &= 2 \int_{0}^{\ell^2} \,\mathrm{d}\theta\ \bar{S}^\ell_{\omega,ij} \tau^\phi\left( \bar{\varOmega}_{ik}^{\sqrt{\theta}}, \bar{\varOmega}_{kj}^{\sqrt{\theta}} \right), \end{align}
 \begin{align} \varPi_{m,S\varOmega}^{H,\ell} &={-} 2 \int_{0}^{\ell^2} \,\mathrm{d}\theta\ \bar{S}^\ell_{\omega,ij} \left[ \tau^\phi\left( \bar{S}_{ik}^{\sqrt{\theta}}, \bar{\varOmega}_{jk}^{\sqrt{\theta}} \right) + \tau^\phi\left( \bar{\varOmega}_{ik}^{\sqrt{\theta}}, \bar{S}_{jk}^{\sqrt{\theta}} \right) \right] \nonumber\\ &={-} 4 \int_{0}^{\ell^2} \,\mathrm{d}\theta\ \bar{S}^\ell_{\omega,ij} \tau^\phi\left( \bar{S}_{ik}^{\sqrt{\theta}}, \bar{\varOmega}_{jk}^{\sqrt{\theta}} \right) . \end{align}
We recall that  $\langle \varPi ^{H,\ell }_{s,\varOmega \varOmega }\rangle$, the spatial average of the contribution to the helicity flux due to coupling of resolved-scale vorticity strain with resolved-scale vorticity, vanishes,
 \begin{equation} \langle \varPi^{H,\ell}_{s,\varOmega\varOmega}\rangle ={-} \frac{\ell^2}{4} \left \langle \left( \partial_j \bar{\omega}^\ell_i + \partial_i \bar{\omega}^\ell_j\right)\bar{\omega}^\ell_i \bar{\omega}^\ell_j \right \rangle ={-} \frac{\ell^2}{4} \left \langle \partial_j (\bar{\omega}^\ell_i \bar{\omega}^\ell_i \bar{\omega}^\ell_j) \right \rangle = 0 , \end{equation}
due to periodic boundary conditions and the divergence-free nature of the vorticity field, as previously discussed by Eyink (Reference Eyink2006) in the context of a multi-scale gradient expansion of the SGS stress tensor.
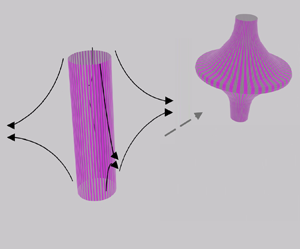
The physics encoded in these transfer terms may be understood in terms of three effects: (i) ‘vortex flattening’ – compression and stretching of a vortex tube into a vortex sheet by large-scale straining motion, with the principal axes of the vorticity deformation tensor  $S_\omega$ aligning with that of the strain-rate tensor at smaller scale, see (2.12) and (2.15); (ii) ‘vortex twisting’ – a twisting of small-scale vortex tubes by large-scale differential vorticity into thinner tubes consisting of helical vortex lines, and subsequent small-scale alignment between the resulting vorticity vectors and the extensile stress generated thereby (Eyink Reference Eyink2006), see (2.14) and (2.17); and (iii) ‘vortex entangling’ – twisting of entangled vortex lines, see (2.13) and (2.16). Interpreting helicity as the correlation between velocity and vorticity, a change in this correlation (or alignment) across scales occurs by vorticity deformation through straining motions or differential vorticity. This results in decorrelation at large scales and an increase in small-scale correlation.
The interpretation of vortex entangling, or twisting of entangled vortex lines, relies on the topological interpretation of helicity in terms of link, twist and writhe of vortex tubes. The terms we interpret in this way do not involve strain-rate tensors; they only involve vorticity and differential vorticity. As such they describe vortex–vortex interactions driven by a twisting and stretching of a bundle of vortex tubes by differential vorticity. If we consider a single bundle of vortex tubes, writhe is a global (or large-scale) quantity in the sense that one needs to consider the entire bundle to describe it. In contrast, twist is a local (or small-scale) concept that describes the winding of the entangled vortex tubes that constitute the bundle around each other (Scheeler et al. Reference Scheeler, van Rees, Kedia, Kleckner and Irvine2017). What we loosely describe as ‘twisting of entangled vortex lines’ can be thought of as a writhe-to-twist transfer of helicity, by deformation of the vortex bundle, see e.g. Scheeler et al. (Reference Scheeler, van Rees, Kedia, Kleckner and Irvine2017). This would necessarily be a multi-scale process, and indeed we see in (2.18) that the single-scale term  $\langle \varPi ^{H,\ell }_{s,\varOmega \varOmega }\rangle$ vanishes in mean.
2.2. An exact Betchov-type relation for the helicity flux
In homogeneous turbulence, the Betchov (Reference Betchov1956) relation is an exact expression connecting the contributions associated with vortex stretching and strain self-amplification to the mean energy flux across scales. Here we show that there is an analogous exact expression relating two (single-scale) mean helicity subfluxes:  $3\langle \varPi ^{H, \ell }_{s,SS} \rangle = \langle \varPi ^{H, \ell }_{s,S\varOmega } \rangle$. These subfluxes are associated with vortex flattening,
 $\langle \varPi ^{H, \ell }_{s,SS} \rangle$, and vortex twisting,
 $\langle \varPi ^{H, \ell }_{s,S\varOmega } \rangle$. Written in terms of the definitions given in (2.12) and (2.14), this expression reads
 \begin{equation} 3\, \left \langle {\rm tr}\left\{ {\bar{\boldsymbol{\mathsf{S}}}^\ell_\omega \bar{\boldsymbol{\mathsf{S}}}^\ell \bar{\boldsymbol{\mathsf{S}}}^\ell} \right\} \right \rangle = 2\, \left \langle {\rm tr}\left\{ {\bar{\boldsymbol{\mathsf{S}}}^\ell_\omega \bar{{\boldsymbol{\mathsf{\Omega}}}}^\ell \bar{\boldsymbol{\mathsf{S}}}^\ell} \right\} \right\rangle . \end{equation}
Before proceeding to a proof of this expression, we point out that it is a relation between the respective traces of two tensors, that is, geometric objects. Consequently, (2.19) is independent of the filter kernel and indeed also holds for the un-filtered case. Here, we embed the derivation within the framework developed in § 2.1 so as to remain focused on the physical interpretation of the terms in (2.19) as subfluxes across scales.
The main steps in a proof of (2.19) are now summarised. Following an argument analogous to that used in proving the Betchov (Reference Betchov1956) relation for the energy flux, and using tensor symmetry properties and (2.18), one obtains (Eyink Reference Eyink2006)
 \begin{equation}
\left \langle {\rm
tr}\left\{ {\bar{\boldsymbol{\mathsf{S}}}^\ell_\omega \bar{\boldsymbol{\mathsf{S}}}^\ell \bar{\boldsymbol{\mathsf{S}}}^\ell}
\right\} \right \rangle ={-} \left \langle {\rm tr}\left\{
{\bar{{\boldsymbol{\mathsf{\Omega}}}}^\ell_\omega (\bar{\boldsymbol{\mathsf{S}}}^\ell \bar{{\boldsymbol{\mathsf{\Omega}}}}^\ell + \bar{{\boldsymbol{\mathsf{\Omega}}}}^\ell \bar{\boldsymbol{\mathsf{S}}}^\ell) }
\right\} \right \rangle ={-} 2\left \langle {\rm tr}\left\{ {\bar{{\boldsymbol{\mathsf{\Omega}}}}^\ell_\omega \bar{{\boldsymbol{\mathsf{\Omega}}}}^\ell \bar{\boldsymbol{\mathsf{S}}}^\ell} \right\} \right \rangle ,
\end{equation}
where  $\varOmega _\omega$ is the antisymmetric part of the vorticity gradient tensor. This yields
 \begin{equation} \frac{1}{2}\left \langle {\rm tr}\left\{ { \boldsymbol{\nabla} \bar{\boldsymbol{\omega}}^\ell \left (\boldsymbol{\nabla} \bar{\boldsymbol{u}}^\ell \right )^t \left[ \boldsymbol{\nabla} \bar{\boldsymbol{u}}^\ell + \left(\boldsymbol{\nabla} \bar{\boldsymbol{u}}^\ell \right )^t \right] } \right\}\right \rangle = \left \langle {\rm tr}\left\{ {\frac{3}{2} \,\bar{\boldsymbol{\mathsf{S}}}^\ell_\omega \bar{\boldsymbol{\mathsf{S}}}^\ell \bar{\boldsymbol{\mathsf{S}}}^\ell - \,\bar{\boldsymbol{\mathsf{S}}}^\ell_\omega \bar{{\boldsymbol{\mathsf{\Omega}}}}^\ell \bar{\boldsymbol{\mathsf{S}}}^\ell} \right\} \right\rangle . \end{equation}
Thus, showing that the left-hand side of this expression vanishes will prove the Betchov relation for the helicity flux, (2.19). To do so, we express the left-hand side of (2.21) using the chain rule and in index notation
 $$\begin{align} \left \langle
\partial_j \bar{\omega}_i^\ell \partial_j \bar{u}_k^\ell
\bar{S}_{ki}^\ell \right \rangle &= \left \langle \partial_j
\left [\bar{\omega}_i^\ell \partial_j \bar{u}_k^\ell
\bar{S}_{ki}^\ell \right] \right \rangle -
\left \langle \bar{\omega}_i^\ell \partial_j \partial_j
\bar{u}_k^\ell \bar{S}_{ki}^\ell \right \rangle\nonumber\\ &\quad - \left
\langle \bar{\omega}_i^\ell \bar{S}_{kj}^\ell
\partial_j\bar{S}_{ki}^\ell \right \rangle - \left \langle
\bar{\omega}_i^\ell \bar{\varOmega}_{kj}^\ell
\partial_j\bar{S}_{ki}^\ell \right \rangle .
\end{align}$$
The first term on the right-hand side of this expression vanishes making use of periodic boundary conditions. Using incompressibility and integration by parts it can be shown that the last term also vanishes. The two remaining terms cancel out, which is shown by similar arguments and using the properties of the Levi-Civita tensor. This completes the proof.
The mean single-scale terms also arise as the first-order contribution in a multi-scale expansion of the SGS stress tensor (Eyink Reference Eyink2006), where (2.20) is used to deduce that the full vorticity gradient, not only either its symmetric or antisymmetric component, is involved in the helicity flux across scales. In consequence, (2.19) and (2.20) assert that the mean transfers involving the symmetric or the antisymmetric parts of the vorticity gradient can be related to one another, and thus the single-scale contribution to the mean helicity flux can be written as
 \begin{equation} \left \langle
\varPi^{H,\ell}_s \right \rangle ={-}8\ell^2\, \left
\langle {\rm tr}\left\{ {\bar{\boldsymbol{\mathsf{S}}}^\ell_\omega \bar{\boldsymbol{\mathsf{S}}}^\ell
\bar{\boldsymbol{\mathsf{S}}}^\ell} \right\} \right \rangle ={-}\frac{16}{3}
\ell^2\, \left \langle {\rm tr}\left\{ {\bar{\boldsymbol{\mathsf{S}}}^\ell_\omega
\bar{{\boldsymbol{\mathsf{\Omega}}}}^\ell \bar{\boldsymbol{\mathsf{S}}}^\ell} \right\} \right\rangle .
\end{equation}
3. Numerical details and data
Data has been generated by direct numerical simulation of the incompressible 3-D Navier–Stokes equations (2.1) and (2.2) on a triply periodic domain of size  $L_{box} = 2{\rm \pi}$ in each direction, where the forcing
 $\boldsymbol {f}$ is a random Gaussian process with zero mean, fully helical
 $\boldsymbol {f} = \boldsymbol {f}^+$, and active in the wavenumber band
 $k \in [0.5,2.4]$. The spatial discretisation is implemented through the standard, fully dealiased pseudospectral method with
 $1024$ collocation points in each direction. Further details and mean values of key observables are summarised in table 1.
Simulation parameters and key observables, where  $N$ is the number of collocation points in each coordinate,
 $E$ the (mean) total kinetic energy,
 $\nu$ the kinematic viscosity,
 $\varepsilon$ the mean energy dissipation rate,
 $\varepsilon _H$ the mean helicity dissipation rate,
 $L = (3 {\rm \pi}/4 E) \int _0^{k_{max}} \,\mathrm {d}{k} \ E(k)/k$ the integral scale,
 $\tau = L/\sqrt {2E/3}$ the large-eddy turnover time,
 ${Re}_\lambda$ the Taylor-scale Reynolds number,
 $\eta = (\nu ^3/\varepsilon )^{1/4}$ the Kolmogorov microscale,
 $k_{max}$ the largest wavenumber after de-aliasing,
 $\Delta t$ the sampling interval which is calculated from the length of the averaging interval divided by the number of equispaced snapshots, and ‘No.’ the number of snapshots. The data corresponds to run 22 of Sahoo et al. (Reference Sahoo, Alexakis and Biferale2017). It is available for download using the SMART-Turb portal http://smart-turb.roma2.infn.it.

Figure 1(a) presents the time series of the total kinetic energy per unit volume,  $E(t)$. Time-averaged kinetic energy spectra of positively and negatively helical fluctuations,
 $E^\pm (k) = \langle \tfrac {1}{2}\sum _{k \leq |\boldsymbol {k}| < k + 1} |\hat {\boldsymbol {u}}^\pm (\boldsymbol {k})|^2 \rangle$ and the total energy spectrum
 $E(k) = E^+(k) + E^-(k)$, are shown in Kolmogorov-compensated form in figure 1(b). As can be seen by comparison of
 $E^+(k)$ and
 $E^-(k)$, the large-scale velocity-field fluctuations are dominantly positively helical, which is a consequence of the forcing. Decreasing in scale, we observe that negatively helical fluctuations increase in amplitude, and approximate equipartition between
 $E^+(k)$ and
 $E^-(k)$ is reached for
 ${k \eta \geq 0.2}$. That is, a helically forced turbulent flow, where mirror symmetry is broken at and close to the forcing scale, restores mirror symmetry at smaller scales through nonlinear interactions (Chen et al. Reference Chen, Chen and Eyink2003a; Deusebio & Lindborg Reference Deusebio and Lindborg2014; Kessar et al. Reference Kessar, Plunian, Stepanov and Balarac2015).
(a) Time evolution of the total energy normalised by its mean value,  $E$. Time is given in units of large-eddy turnover time
 $\tau$. The red dots correspond to the sampled velocity-field configurations. (b) Time-averaged energy spectra in Kolmogorov-compensated form. The grey-shaded area indicates the forcing range. The dashed line indicates a Kolmogorov constant
 $C_K \approx 1.6$.

4. Numerical results for mean subfluxes and fluctuations
Figure 2 shows the total helicity flux and all subfluxes, normalised by the total helicity dissipation rate  $\varepsilon _H$. As can be seen in the figure, the term
 $\langle \varPi ^{H,\ell }_{s,\varOmega \varOmega }\rangle$ is identically zero, which must be the case according to (2.18). Moreover, the helicity Betchov relation (2.19) derived here is satisfied as it must be – the terms
 $\langle \varPi ^{H,\ell }_{s,S\varOmega }\rangle$ and
 $3\,\langle \varPi ^{H,\ell }_{s,SS}\rangle$ are visually indistinguishable, with a relative error between them of order
 $10^{-6}$ (not shown). A few further observations can be made from the data. The non-vanishing multi-scale terms,
 $\langle \varPi ^H_{m,S\varOmega } \rangle$,
 $\langle \varPi ^H_{m,SS} \rangle$ and
 $\langle \varPi ^H_{m,\varOmega \varOmega } \rangle$ are comparable in magnitude across all scales. They are approximately scale-independent in the interval
 $10^{-2} \leq k\eta \le 10^{-1}$, with each accounting for approximately 15–20 % of the total helicity flux in this range of scales. Even though clear plateaux are not present for the two non-vanishing single-scale terms,
 $\langle \varPi ^H_{s,S\varOmega } \rangle$ and
 $\langle \varPi ^H_{s,SS} \rangle$, one could tentatively extrapolate that at higher
 $Re$, approximately
 $30\,\%$ of the mean flux originates from scale-local vortex twisting and
 $10\,\%$ from vortex flattening. That is, the multi-scale contributions amount to 50–60 % and the scale-local contributions to 40–50 % of the total helicity flux across scales, at least for this particular simulation.
Decomposed helicity fluxes normalised with the mean helicity dissipation rate  $\varepsilon _H$. Filled markers correspond to single-scale contributions while empty symbols are related to multi-scale contributions. The error bars indicate one standard error. The subflux
 $\langle \varPi _{s,S\varOmega }^{H,\ell }\rangle$ has been superposed with
 $3\langle \varPi _{s,SS}^{H,\ell }\rangle$ in order to highlight the Betchov-type relation (2.19).

Having discussed the mean subfluxes, we now consider the fluctuations of each subflux term, in order to quantify the level of fluctuations in each term and the presence and magnitude of helicity backscatter. Figure 3 presents standardised probability density functions (p.d.f.s) of all helicity subfluxes at  ${k \eta = 5.5 \times 10^{-2}}$, which is approximately in the inertial range. These p.d.f.s have wide tails, and are strongly non-Gaussian. Single- and multi-scale terms all have strong fluctuations between 60 and 75 standard deviations. Interestingly, the subflux term
 $\varPi _{s,\varOmega \varOmega }^{H,\ell }$, which necessarily vanishes in mean (see (2.18)), has the strongest fluctuations (i.e. is the most intermittent).
Standardised p.d.f.s of helicity subfluxes  $\varPi _X^{H,\ell }$, where
 $X$ refers to the subflux identifier, for (a) single-scale and (b) multi-scale contributions;
 $\sigma _X$ denotes the standard deviation of each respective term. Values of
 $\sigma _X$ are provided in table 2.

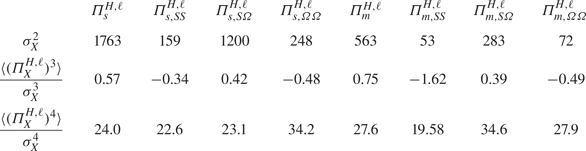
Values of variance, skewness and flatness for the subflux p.d.f.s at  $k\eta = 0.055$ shown in figure 3.

Values of the variance, skewness and flatness for each of the p.d.f.s shown in figure 3 are provided in table 2. All p.d.f.s are more symmetric than for the kinetic energy fluxes (Johnson Reference Johnson2021) (not shown) with generally low skewness values. The p.d.f.s of  $\varPi _{s}^{H,\ell }$,
 $\varPi _{s,S\varOmega }^{H,\ell }$,
 $\varPi _{m}^{H,\ell }$ and
 $\varPi _{m,S\varOmega }^{H,\ell }$ are slightly positively skewed while the p.d.f.s of
 $\varPi _{s,SS}^{H,\ell }$,
 $\varPi _{m, SS}^{H,\ell }$ and
 $\varPi _{m,\varOmega \varOmega }^{H,\ell }$ are slighly negatively skewed. The symmetry is more pronounced in the single-scale rather than the multi-scale terms, as can be seen by comparison of the left and right panels of figure 3, and by comparison of the skewness values reported in table 2. As all averaged fluxes (except
 $\langle \varPi _{s, \varOmega \varOmega }^{H,\ell } \rangle$ which is zero) transfer positive helicity from large to small scales, symmetry in the p.d.f.s indicates strong backscatter of positive helicity, or forward scatter of negative helicity. The p.d.f.s become even broader with decreasing filter scale (not shown). A comparison between the p.d.f.s of
 $\varPi ^{H, \ell }$ and the alternative description based on SGS stresses related to vortex stretching,
 $\tilde \varPi ^{H, \ell }$, has been carried out by Yan et al. (Reference Yan, Li, Yu, Wang and Chen2020), indicating more intense backscatter in the latter compared with the former. Adding or removing a total gradient can strongly reduce the negative tail of the SGS energy transfer (Vela-Martín Reference Vela-Martín2022), and the same may apply to the helicity flux.
5. Conclusions
We have derived an exact decomposition of the helicity flux across scales in terms of interactions between vorticity gradients and velocity gradients, and in terms of their scale locality. Decomposing all gradient tensors into symmetric and antisymmetric parts allows for a discussion and quantification of different physical mechanisms that constitute the helicity cascade. Simulation results indicate that all subfluxes transfer helicity from large to small scales, albeit with strong backscatter. In the inertial range, approximately 50 % of the total mean helicity flux is due to the action of two scale-local processes: (i) vortex flattening and (ii) vortex twisting. We have also shown that these two effects are related in mean through a newly derived exact (Betchov-type) relation, which implies that the contribution of the former is exactly three times larger than that of the latter. Multi-scale effects account for the remaining 50 %, with approximate equipartition between multi-scale versions of the two aforementioned effects and multi-scale vortex entangling. Thus, it seems likely that, in LES contexts, accurate modelling of the helicity cascade should not neglect the multi-scale contributions. Although our numerical quantification of the fluxes is obtained using data from a single simulation with an inertial range of limited length, we conjecture that the results obtained are robust in the sense that we expect them to hold for flows with larger Reynolds numbers. Increasing resolution and Reynolds number is certainly a key step to understand whether single-scale and multi-scale contributions are Reynolds-number independent in the asymptotic limit. We may address this point quantitatively in the future. A brief discussion of Reynolds-number effects and results at lower Reynolds number is provided in the Appendix. Similar flux decompositions can be derived for magnetohydrodynamics. We will report results of these investigations elsewhere in due course.
Funding
Computational resources were provided through Scottish Academic Access on Cirrus (www.cirrus.ac.uk), and the UK Turbulence Consortium on ARCHER2 (www.archer2.ac.uk). This work received funding from the European Research Council (ERC) under the European Union's Horizon 2020 research and innovation programme (grant agreement no. 882340) and from the Priority Programme SPP 1881 ‘Turbulent Superstructures’ of the Deutsche Forschungsgemeinschaft (DFG, Li3694/1).
Declaration of interests
The authors report no conflict of interest.
Appendix. Reynolds-number effects
In order to discuss Reynolds-number effects in connection with the formation of plateaux for the subfluxes, we carried out an additional simulation at lower Reynolds number,  $Re_\lambda = 240$, on
 $512$ collocation points in each spatial direction and a resolution of
 $k_{max}\eta = 1.25$. Data was averaged over 40 equispaced snapshots separated in time by
 $0.6$ large-eddy turnover times. Figure 4 presents the helicity subfluxes. In comparison with the data shown in the figure and the higher-
 $Re_\lambda$ data presented in figure 2, we note that plateaux are less extended for the multi-scale terms in the lower-
 $Re_\lambda$ data, and that no plateau-formation is visible in the single-scale terms. In contrast, for the higher-
 $Re_\lambda$ data, the single-scale terms are less scale-dependent in the (approximate) inertial range. It is thus plausible that with increasing Reynolds number plateaux form, and indeed become more extended, for all non-vanishing mean subfluxes.
Decomposed helicity fluxes normalised with the mean helicity dissipation rate  $\varepsilon _H$ for
 $Re_\lambda = 240$. Filled markers correspond to single-scale contributions while empty symbols are related to multi-scale contributions. The error bars indicate one standard error.