Implications
Adding significant amounts of either linseed or nitrate in ruminant diet was shown to decrease enteric methane production. In this experiment, the combination of linseed and nitrate in a fattening bull diet both in moderate supply (1.0% nitrate and 1.9% linseed fatty acid (FA) on a dry matter (DM) basis) did not impair animal health, did not result in nitrite or nitrate residues in offal but was not enough to mitigate enteric methane yield and decreased BW gain. Before using this strategy in beef production, additional research is necessary because of the variability of results among experiments, and for evaluating trade-offs between methane mitigation, animal liveweight gain and health.
Introduction
Mitigation of enteric methane emission is a major challenge for the future of livestock farming. Indeed, according to recent estimations, enteric methane represents 39% of greenhouse gas emissions by livestock, expressed in CO2-equivalents, and the livestock sector represents 14.5% of anthropogenic emissions of greenhouse gases worldwide (Gerber et al., Reference Gerber, Steinfeld, Henderson, Mottet, Opio, Dijkman, Falcucci and Tempio2013). The addition of lipids has been proposed for a few years as an effective dietary means for methane mitigation (Martin et al., Reference Martin, Ferlay, Mosoni, Rochette, Chilliard and Doreau2010), and linseed, which is rich in linolenic acid, has recently been confirmed as one of the most efficient lipid sources (Martin et al., Reference Martin, Morgavi and Doreau2016). The effect is mainly due to a decrease in protozoa, as protozoa drive enhanced hydrogen production in the rumen, and thus methanogenesis (Guyader et al., Reference Guyader2014). The use of unsaturated lipids in ruminant diets may result in significant methane abatement, but the process remains expensive (Doreau et al., Reference Doreau, Bamière, Pellerin, Lherm and Benoit2014). Another mitigation technique is the use of nitrates in the diet. Nitrate drives a shift in the use of hydrogen produced in the rumen towards ammonia production instead of methane production, which thus contributes to methane mitigation (Van Zijderveld et al., Reference Van Zijderveld, Gerrits, Dijkstra, Newbold, Hulshof and Perdok2011). Obviously, it has to be used in diets low in fermentable N to avoid an excess of urinary N losses. However, a major drawback of this technique is the risk of elevated blood methaemoglobin (metHb) for animals due to intoxication by nitrite that gets produced from nitrate in the rumen then absorbed. This risk has been evaluated by Lee and Beauchemin (Reference Lee, Araujo, Koenig and Beauchemin2014). They concluded that this risk is limited when (i) nitrate inclusion in the diet is progressive, in order to acclimate rumen microbes to nitrate supply; (ii) feed consumption rate is low, for example by ad libitum feeding, in order to prevent a too rapid intake of nitrate. They observed a linear effect of the level of nitrate supply on blood metHb, but they did not suggest a maximum level of inclusion. Moreover, the presence of residues of nitrate and nitrite in food would be a cause of consumer concern. The absence of residues has been shown in milk and dairy products (Guyader et al., Reference Guyader, Eugène, Nozière, Morgavi, Doreau and Martin2016) but, to our knowledge, only one detailed paper is available for beef (Hegarty et al., Reference Hegarty, Milelr, Oelbrand, Li, Luijben, Robinson, Nolan and Perdok2016).
Lipids and nitrate are complementary, since lipids act on hydrogen production whereas nitrate acts on hydrogen utilisation. Their additive effect has been recently shown in dry cows (Guyader et al., Reference Guyader, Eugène, Meunier, Doreau, Morgavi, Silberberg, Rochette, Gérard, Loncke and Martin2015) and their efficiency in the mid-term (5 months) has been validated in dairy cows (Guyader et al., Reference Guyader, Eugène, Nozière, Morgavi, Doreau and Martin2016). However, there is limited information on the effect of lipids plus nitrate in fattening ruminants: a trial by Troy et al. (Reference Troy, Rooke, Wallace, Duthie, Hyslop, Ross, Waterhouse and Roehe2016) combined lipids from maize and nitrate in steers, but only nitrate supply decreased methane emission. Most relevant experiments carried out to date have used linseed or nitrate separately. Linseed was often studied for a supply of more than 3% FA in the diet; such a linseed level may prohibitively increase the cost of the ration for on-farm use, as until now positive effects of linseed on liveweight gain and reproduction have not been demonstrated (Doreau and Ferlay, Reference Doreau and Ferlay2015). Most studies with nitrate were carried out at levels comprised between 1.5% and 3% of the diet; the trade-off between methane mitigation and risks of misuse and toxicity for animals at such levels can present nitrate use on-farm. For these reasons, we hypothesised that the combination of linseed and nitrate, both supplied in lower amounts than in the above-mentioned experiments, defined below as ‘moderate’, could be efficacy for methane mitigation. We set out to estimate the effect on methane emission of the combination of linseed and nitrate in moderate amounts, and to determine the possible adverse effects on animal liveweight gain and health and nitrate residues in offal. Complementary data on the effect of this feeding strategy on microbial ecosystem have been published in a companion paper (Popova et al., Reference Popova, McGovern, McCabe, Martin, Doreau, Arbre, Meale, Morgavi and Waters2017).
Material and methods
Experimental design, animals and diets
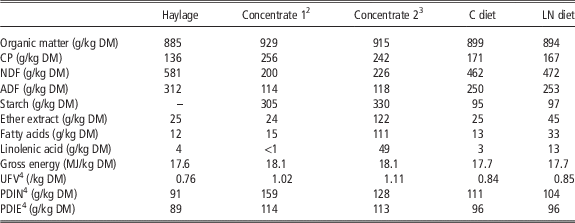
In total, 16 Charolais bulls, aged 245±6 days and weighing 275±20 kg on average at weaning, were used in this trial. All animals were housed in the same pen of a semi-open barn bedded with straw. Individual troughs were equipped with electronic gates linked to a computer (Dairy Gate, Etudes Fabrications Electronique Industrielle, Villeroy, France) accessed by bulls via a transponder ear tag, so that feed intake was determined individually. Methane emission was measured individually using the GreenFeed system (C-Lock, Rapid City, SD, USA), according to the procedure described by Arbre et al. (2016). This technique is one of the two main methods which can be used for measuring methane emission in animals housed in pens; the other one is the SF6 technique. We used the GreenFeed system because the implementation of the SF6 technique is very difficult in bulls at the end of fattening because animals break the gas collection devices. In brief, the GreenFeed device is an automatic feeder filled with a concentrate made available for each animal up to 6 times a day (ca. 2 kg concentrate available per animal). The number of daily visits to the feeder per animal was on average 3.0 (2.2 to 4.3 according to animals). A device for air extraction allows the measurement of air outflow and methane concentration in the extraction pipe by a non-dispersive IR sensor. The GreenFeed device was placed in a corner of the pen. A first phase lasted from mid-November 2015 to mid-April 2016 during which all animals received the same control (C) diet offered ad libitum, composed, on a DM basis, of 67% baled haylage of permanent grassland harvested at early-heading stage in a semi-mountainous area and 33% concentrate. Chemical composition and ingredient composition of concentrate, called concentrate 1, are given in Table 1. A fraction of the concentrate was delivered by the GreenFeed while the bulk was put in the trough. The amount of concentrate offered in the trough was calculated every week according to the amount of concentrate effectively consumed in the GreenFeed. At the end of this phase, the study was conducted as a randomised block design where bulls were assigned to two groups balanced for feed intake, BW gain and methane emission. The bulls remained in the same single pen. The second phase started in mid-April and lasted at least 8 weeks until slaughter, which was staggered over 6 weeks. During this phase, the first group received the same C diet as in phase 1. As the GreenFeed device used in this experiment could contain only one concentrate, the second group received two concentrates: a minor fraction of concentrate 1 delivered by the GreenFeed, as in the first phase, and a major fraction of another concentrate, called concentrate 2, containing 24.5% extruded linseed in replacement of wheat, beet pulp and rapeseed meal, and 6% calcium ammonium nitrate (75% nitrate in DM) in replacement of urea. Composition of concentrate 2 was calculated by accounting for the expected amount of concentrate 1 eaten by bulls (Table 1), and in order to achieve 1.9% FA supply from linseed and 1.0% nitrate supply in the diet, on a DM basis. The bulls were given a 2-week transition period between the C and LN diets in order to minimise risks of high blood metHb (Lee and Beauchemin, Reference Lee, Araujo, Koenig and Beauchemin2014). Age at slaughter was 480±10 days for C-diet bulls and 470±15 days for LN-diet bulls. Haylage was offered ad libitum throughout the whole trial using an automatic feeding system (Dessertine, Buxières-les-Mines, France) in individual troughs, and the amount of concentrate offered to bulls was distributed manually in individual troughs and calculated each week according to offered feed and refusals of the previous week in order to maintain a constant forage : concentrate ratio. Haylage was offered at 0900 h, and concentrate was top-dressed in two equal amounts at 0900 and 1600 h. Animals were tethered in feed fences between 0900 and 1000 h and between 1600 and 1700 h in order to maximise concentrate intake.
Chemical composition and nutritive value of experimental feeds and diets as consumedFootnote 1

C diet=control diet; LN diet=diet containing linseed and nitrate; DM=dry matter.
1 Composition of diets as consumed is calculated from the amount of each feed effectively consumed by animals.
2 Composition of concentrate 1, in % of fresh weight: maize 28.4, wheat 15.0, middlings 6.8, wheat bran 5.7, dehydrated beet pulp 5.0, rapeseed meal 33.7, urea 1.7, sugarcane molasses 2.0, calcium carbonate 0.5, mineral–vitamin premix 0.75, vegetal extracts 0.45.
3 LN: composition of concentrate 2, in % of fresh weight: maize 30.0, barley 6.3, wheat bran 10.5, soyabean hulls 5.0, soyabean meal 3.2, rapeseed meal 7.8, sunflower meal 2.0, extruded linseeds 24.5, beet molasses 3.0, calcium ammonium nitrate 6.0, dicalcium phosphate 0.65, sodium chloride 0.45, mineral–vitamin premix 0.5, fungicide 0.05, flavouring 0.05.
4 Net energy value for fattening under French feeding system standards (INRA, 2010), where 1 UFV=7.61 MJ; protein digestible in the intestines of feeds as energy (PDIE) or fermentable N (PDIN) is the limiting factor of microbial synthesis in the diet. Intestinal digestible protein amount of the whole diet is the lower of the two values; the difference between PDIE and PDIN indicates a lack or an excess of fermentable N in the diet.
Measurements and analyses
Animals were weighed every 2 weeks throughout the two phases of the experiment (ID5 Multirange weighing machine; Mettler-Toledo, Viroflay, France). From these data liveweight daily gain was calculated for the last 4 weeks of phase 1, and for the last 4 weeks before the first slaughter in phase 2. Feed intake was determined throughout the two phases of the experiment every day by weighing offered feeds, refusals of forage and refusals of concentrates which were separated by sorting. Dry matter content was determined on an aliquot by oven-drying at 103°C for 24 h. Chemical composition of feeds was determined in an aliquot from regular feed samplings (500 g twice a week for haylage, 200 g once a week for concentrates). Organic matter was determined by ashing at 550°C for 6 h. N was determined by the Dumas method (method 968-06, Association of Official Analytical Chemists, Reference Arbre, Rochette, Guyader, Lascoux, Gómez, Eugène, Morgavi, Renand, Doreau and Martin2005). Neutral detergent fibre and ADF were determined sequentially (Van Soest et al., Reference Van Soest, Robertson and Lewis1991) after treatment by amylase for concentrates, and inclusive of ash. Starch was determined by an enzymatic method using amyloglucosidase after washing sample with ethanol (AFNOR NF V18-121). Ether extract was determined after acid hydrolysis according to the official EU method given in Commission Regulation (EC) 152/2009. Fatty acid content and composition was analysed on methyl esters after transmethylation by GLC according to ISO 12966 procedure. Gross energy was determined by using a calorimeter (model C 200; IKA, Staufen, Germany) operating according to an isoperibolic mode.
Methane emission (g/day) was calculated throughout the two phases of the experiment from methane concentration and air flow during the animal’s visits to the feeder, corrected by background methane concentration, air flow and air temperature. Data were transferred to the C-Lock server and handled by C-Lock. According to Arbre et al. (2016), when the GreenFeed system is used for studying differences between a standard diet and a diet aiming to mitigate methane emission, six dairy cows per treatment for a 17-day period of measurement were necessary for evidencing a decrease in methane emission by 20%.
Blood was sampled for metHb determination. A 4-ml sample was taken at 1300 h at the tail vein for all animals at the beginning of the second phase, then once a week until slaughter for animals receiving the LN diet (9 to 13 weeks according to animal). Samples were collected into a K2-EDTA tube (Venosafe; Terumo, Guyancourt, France) then stored at 4°C until analysis, which was performed within 1 h post-sampling by spectrophotometry (UV-160; Shimadzu, Marne-la-Vallée, France) according to Kaplan (Reference Kaplan1965) at Gabriel Montpied University Hospital, Clermont-Ferrand, France.
Animal slaughtering occurred in the morning between 0800 and 1000 h. Bulls were conducted at slaughterhouse at 0700 h, and had access to their feed during the night before slaughtering. Liveweight, hot carcass weight and weight of total fat in viscera were determined. A 200-g sample of tongue, rumen tissue (mucosa and muscular-serosa layers) and liver was taken and kept at 4°C until analysis, which was performed within 24 h post-sampling. Nitrate and nitrite were determined using a method derived from Follett and Ratcliff (Reference Follett and Ratcliff1963) after hot water extraction, deproteinisation and filtration, reduction of nitrates in nitrites with cadmium (for nitrates+nitrites) or not (for nitrites), and spectrophotometry with measurement at 538 nm (AFNOR NF V 04-409 and 04-410).
Statistical analysis
Daily feed intake and methane emissions have been averaged for each 4-week period before statistical analysis. Methane yield per kg DM intake, in % of GE intake, and per kg liveweight gain was calculated by dividing methane emission par day by DM intake, GE intake or liveweight gain during the same 4-week period. Dry matter intake, liveweight gain, and methane emission and yield were analysed by analysis of covariance using the mixed model of SAS (2008) with treatment as fixed effect. As all animals were not slaughtered at the same date, data from the last 4 weeks before the date of first slaughter were considered. Covariates were DM intake, liveweight gain and methane emission during the 4 weeks preceding the experimental phase. Nitrate and nitrite concentration in offal was analysed by ANOVA with treatment as fixed effect. For all analyses, the threshold for significance was set at P<0.05.
Results
During the last 4 weeks before splitting the animals into experimental groups, bulls consumed 6.62±0.87 of haylage and 3.23±0.65 kg DM of concentrate 1, that is giving an average forage : concentrate ratio of 67:33. Total DM intake was 9.85±1.10 kg/day (on average 9.62 and 10.08 for bulls allocated to C and LN diets, respectively). Liveweight gain was 1.65±0.26 g/day (on average 1.66 and 1.64 for bulls allocated to C and LN diets, respectively) and methane yield was 27.3±4.5 g/kg DM intake (on average 27.7 and 26.9 for bulls allocated to C and LN diets, respectively).
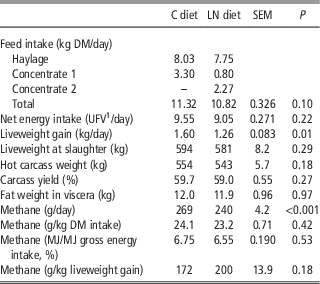
Amount of haylage and concentrates effectively fed by bulls during the last month of the experimental period is shown in Table 2. Percentage of haylage was 70.9 and 71.6 for C and LN diets, respectively. Percentage of each concentrate in the LN diet was 7.4 and 21.0 for concentrates 1 and 2, respectively. Chemical composition and nutritive value of the diets, as computed from the intake of each feed, are shown in Table 1. Total DM intake and net energy intake were numerically 4.4% and 5.2% lower with LN diet than C diet, respectively, but did not significantly differ between diets. Liveweight gain was 21% lower (P=0.01) on average for LN diet than C diet; this level of significance was similar when covariable was not included in the analysis.
Intake, liveweight gain, characteristics at slaughter and methane emission and yield in two groups of eight bulls fed either a control diet (C) or a diet containing linseed and nitrate (LN)

1 Net energy value for fattening under French feeding system standards (INRA, 2010), where 1 UFV=7.61 MJ.
Liveweight at slaughter, hot carcass weight, carcass yield and fat weight in viscera did not vary significantly with diet.
Methane emission (Table 2) was significantly higher with C diet than LN diet when expressed in g/day (P<0.001); this level of significance was similar when covariable was not included in the analysis. However, as a consequence of the difference in feed intake between diets, methane yield per kg DM intake or per MJ gross energy intake did not differ among diets. Due to the difference in liveweight gain among diets, methane emission per kg liveweight gain was numerically 16% higher for LN diet than C diet, but this difference was not statistically significant.
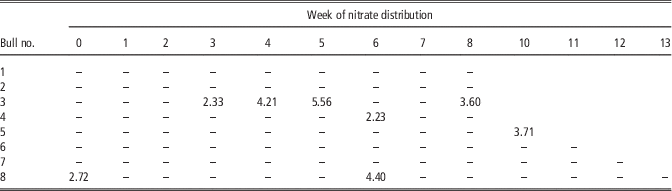
Blood metHb was not detectable (<2% of total haemoglobin) in all samples taken at the beginning of the period for bulls receiving C diet. Blood metHb was under detectable levels in most samples taken throughout the period for bulls fed LN diet (73 among 81) and was <5.6% of total haemoglobin in all other samples (Table 3). Four animals had only non-detectable blood metHb concentrations, and only one among eight detectable concentrations was observed during the first 2 weeks of adaptation to the diet.
Blood methaemoglobin (% of total haemoglobin) in bulls fed the LN diet during the whole period of nitrate distributionFootnote 1

1 Week 0 is the week before the beginning of the experimental phase. Weeks 1 and 2 correspond to progressive adaptation to nitrate supply, with final nitrate concentration reached in week 4. All bulls received the LN diet for at least 8 weeks; some received the LN diet for 9 to 13 weeks as slaughters were spread over several weeks. Analyses could not be performed in week 9.
–, methaemoglobin was not detectable in blood (<2% of total haemoglobin).
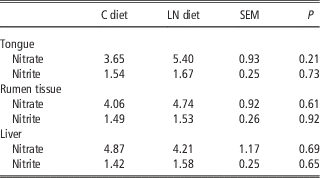
Nitrate and nitrite concentration in tongue, rumen and liver samples did not differ significantly between C and LN diet, although nitrate concentration in tongue was numerically 48% higher with the LN diet (P=0.21) (Table 4).
Nitrate and nitrite concentration (mg/kg fresh tissue) in tongue, rumen tissue and liver of two groups of eight bulls fed either a control diet (C) or a diet containing linseed and nitrate (LN)

Discussion
Blood metHb was very low in our trial. According to the meta-analysis by Lee and Beauchemin (Reference Lee, Araujo, Koenig and Beauchemin2014) who gave a linear regression between metHb and nitrate supply per kg BW, the probable concentration should have been close to 10%. In fact, very few experiments have been carried out with nitrate supplies as low as ours (ca. 0.2 g/kg liveweight daily), and the response may be non-linear, as suggested by data in Lee et al. (Reference Lee and Beauchemin2015). In addition, ad libitum feeding reduces risks of elevated metHb compared with restricted feeding (Lee et al., Reference Lee and Beauchemin2015; Nolan et al., Reference Nolan, Godwin, de Raphélis-Soissan and Hegarty2016). In our study, the concentrate containing nitrate was top-dressed in two equal parts at 0900 and 1600 h, whereas samplings occurred at 1300 h. This distribution scheme may have limited metHb concentration, but it is unlikely that hour of sampling underestimated metHb concentration, which is maximal at between 2.5 and 3 h (Lee and Beauchemin, Reference Lee, Araujo, Koenig and Beauchemin2014; Nolan et al., Reference Nolan, Godwin, de Raphélis-Soissan and Hegarty2016) after ruminal nitrate administration. The absence of relation between metHb concentration when detectable and time after starting nitrate distribution is surprising, as it is generally thought that acclimation of rumen microbes to nitrate is required for nitrate reduction in the rumen and thus avoiding high nitrate concentrations (Shi et al., Reference Shi, Meng, Hou, Ren and Zhou2012). Such an absence of effect of number of weeks after nitrate distribution had been observed by Duthie et al. (Reference Duthie, Rooke, Troy, Hyslop, Ross, Waterhouse and Roehe2016a). Our results show that in controlled distribution conditions, the risk of toxicity for animals is very low.
Dry matter intake tended to be lower with LN diet. As linseed supply in the diet does not result in a decrease in DM intake and liveweight gain (see the review by Doreau and Ferlay, Reference Doreau and Ferlay2015) it is likely that this trend is due to nitrate supply, despite its moderate content in the diet. A low palatability of nitrate due to a bitter taste is not excluded (Lee and Beauchemin, Reference Lee, Araujo, Koenig and Beauchemin2014). In our experiment, both forage and concentrate intake decreased due to the feeding design aiming to maintain forage : concentrate ratio. In the literature, the effect of nitrate on intake differs among experiments. For example, Hulshof et al. (Reference Hulshof, Berndt, Gerrits, Dijkstra, Van Zijderveld, Newbold and Perdok2012) observed that the inclusion of 2.2% of nitrate in the diet tended to decrease intake in steers. In their extensive review, Lee and Beauchemin (Reference Lee, Araujo, Koenig and Beauchemin2014) stated that (i) a decrease in feed intake is uncommon at nitrate levels that do not lead to high level of blood metHb; (ii) the decrease in feed intake occurs more often when animals are not enough acclimated to nitrate; (iii) there is no relationship between the level of nitrate supply and the change in feed intake, and sometimes nitrate supply results in an increase in feed intake. Taken together, experimental data do not allow to know the causes of the decrease in DM intake with nitrate supply.
The trend towards a lower DM intake with the LN diet could not be compensated for by its slightly higher net energy value, so net energy intake predicted according to INRA (2010) tended to be 0.5 UFV/day lower with the LN diet than the C diet. This level of difference in net energy intake could lead to a difference in liveweight gain of ca. 170 g/day, whereas the effective difference in liveweight gain between the two groups was 340 g/day. This surprising discrepancy is not likely to be due to a shortage in protein with the LN diet, as protein supply and fermentable protein in the rumen were enough to ensure normal growth (INRA, 2010). The important decrease in liveweight gain may be due to a decrease in digestibility, not predicted by feeding systems. In dairy cows, the association of linseed and nitrate in the diet tended to decrease DM intake and milk yield, but not digestibility (Guyader et al., Reference Guyader, Eugène, Nozière, Morgavi, Doreau and Martin2016). Marais et al. (Reference Marais, Therion, Mackie, Kistner and Dennison1988) hypothesised that nitrite could reduce microbial activity in the rumen, but the low blood metHb suggested that nitrite concentration was low in the rumen. In addition, Popova et al. (Reference Popova, McGovern, McCabe, Martin, Doreau, Arbre, Meale, Morgavi and Waters2017) did not find any difference between C and LN diets in volatile fatty acid concentration in the rumen by sampling the same bulls at slaughter. A lower digestibility of LN diet compared with C diet is thus not likely. The extent of liveweight gain decrease may be due to its determination on a short period of 4 weeks, which can result in a lack of accuracy of liveweight gain measurement. In the literature, changes in DM intake and in liveweight gain of fattening ruminants are logically related. For example, Duthie et al. (Reference Duthie, Rooke, Troy, Hyslop, Ross, Waterhouse and Roehe2016a) reported no effect of nitrate supply at 1.8% of diet on DM intake and liveweight gain. Using a large number of steers, Hegarty et al. (Reference Hegarty, Milelr, Oelbrand, Li, Luijben, Robinson, Nolan and Perdok2016) showed concomitant decreases in DM intake and liveweight gain due to nitrate supply. In a trial combining the supply of lipids from maize and nitrate, Duthie et al. (Reference Duthie, Rooke, Troy, Hyslop, Ross, Waterhouse and Roehe2016b) observed a decrease in liveweight gain but did not mention changes in DM intake.
To our knowledge, the only other study of the effect of combination of lipids and nitrate on methane emission in fattening cattle is that of Troy et al. (Reference Troy, Rooke, Wallace, Duthie, Hyslop, Ross, Waterhouse and Roehe2016), but these authors observed a mitigating effect of nitrate, but not of lipids from maize. In our experiment, the decrease in methane emission expressed in g/day with the LN diet is a consequence of a lower feed intake, but the absence of difference in methane yield expressed in g/kg DM intake suggests the absence of difference in rumen function. In this experiment, protozoa population and composition of bacterial communities in samples taken at slaughter in the same animals did not vary between diets, and the activity of methanogenic species was unchanged (Popova et al., Reference Popova, McGovern, McCabe, Martin, Doreau, Arbre, Meale, Morgavi and Waters2017). Dose–response experiments with linseed fed to dairy cows have demonstrated that a moderate linseed supply (2% FA in DM, as here in this experiment) results in relatively little mitigation of methane yield (Martin et al., Reference Martin, Morgavi and Doreau2016). The absence of mitigating effect of linseed is sometimes observed even when linseed supply is higher than here (Veneman et al., Reference Veneman, Muetzel, Hart, Faulkner, Moorby, Perdok and Newbold2015). Similarly, in young bulls fed concentrate-rich diets, no difference in methane yield was found between a fibre-rich concentrate and concentrate rich in starch plus 2% linseed FA (Eugène et al., Reference Eugène, Martin, Mialon, Krauss, Renand and Doreau2011). The only viable cause of methane mitigation would have been the replacement of carbohydrate by dietary lipids.
Literature data analysed by Lee and Beauchemin (Reference Lee, Araujo, Koenig and Beauchemin2014) suggest a linear decrease in methane yield with nitrate addition. However, there is a lack of experiments testing low nitrate supply as used here. The methane-mitigating effect of nitrate is due to nitrate-reducing bacteria which compete successfully with methanogens for hydrogen use in the rumen. Providing only a moderate amount of nitrate in the diet may limit the population or activity of nitrate-reducing bacteria. In rumen contents of these bulls sampled at slaughter, Popova et al. (Reference Popova, McGovern, McCabe, Martin, Doreau, Arbre, Meale, Morgavi and Waters2017) did not find a change in the relative abundance of nitrate-reducing bacteria of the genus Selenomonas. Furthermore, the decrease in methanogen population observed with higher doses of nitrate (Guyader, Reference Guyader, Doreau, Morgavi, Gérard, Loncke and Martin2015; Veneman et al., Reference Veneman, Muetzel, Hart, Faulkner, Moorby, Perdok and Newbold2015) may have not occurred. It has been shown in dairy cows that lipids and nitrate have an additive effect for methane mitigation (Guyader et al., Reference Guyader, Eugène, Meunier, Doreau, Morgavi, Silberberg, Rochette, Gérard, Loncke and Martin2015), so we expected a moderate supply of each (1% nitrate and 1.9% of linseed FA in the diet) to have the same effect as a higher supply of each (e.g. 2% nitrate or 4% of linseed FA in the diet); however, this was not the case, probably because the amount of each supplement was too low to activate changes in rumen processes. It can be noted that although the difference between C and LN diets was not significant, methane yield was numerically 3.7% lower with LN diet than with C diet. It may be hypothesised that the GreenFeed method for methane measurement is not accurate enough to evidence a statistical difference at a 5% level.
Measurements of nitrate and nitrite in beef products were carried out in organs expected to accumulate them more than muscle or fat, that is tongue and rumen tissue, which can absorb these compounds, and liver, which can metabolise them. The nitrate and nitrite concentrations found in these organs did not differ between C and LN diets and correspond to very low intakes in humans: the recommended daily allowances for nitrate and nitrite in humans are 3.75 and 0.13 mg/kg BW, respectively, according to the European Food Safety Authority (2009). By comparison, nitrate concentration in non-organic vegetables (cabbage, beetroot, lettuce, radish, etc.) is often over 1000 mg/kg fresh product (Schuddeboom, Reference Schuddeboom1993). This absence of accumulation in products after 2 months of nitrate distribution reinforces results obtained in dairy products by Guyader et al. (Reference Guyader, Eugène, Nozière, Morgavi, Doreau and Martin2016) who found non-detectable concentrations of nitrate (<5 mg/kg) and nitrite (<0.5 mg/kg) in milk and 1.5 mg/kg nitrite in cheese from cows fed a diet with 1.8% nitrate. In beef muscle, an ancient publication (Davison et al., Reference Davison, Hansel, Krook, McEntee and Wright1964) showed that a supply of ca. 2% or 3% nitrate in the diet resulted in a linear increase in meat nitrate, reaching 21 g/kg for the highest level of inclusion. To our knowledge, there are two recent publications in ruminant meat. El-Zaiat et al. (Reference El-Zaiat, Patiño, Soltan, Morsy, Araujo, Louvandini and Abdalla2013) found extremely low nitrate concentrations (<0.5 mg/mg) and non-detectable nitrite concentrations in Longissimus dorsi of lambs fed 4.5% calcium nitrate in the diet. Hegarty et al. (Reference Hegarty, Milelr, Oelbrand, Li, Luijben, Robinson, Nolan and Perdok2016) comparing two diets containing 0.45% non-protein nitrogen in the diet from urea or calcium nitrate found non-detectable nitrate concentrations in both groups, but significant nitrite amounts in both groups, averaging 10 g/mg, in raw meat but not in cooked meat. This discrepancy between results probably comes from the accuracy of analytical methods for nitrate and nitrite determination. However, taken together, recent results demonstrate the safety of ruminant products when animals receive nitrate in their diet in controlled conditions of delivery.
Conclusion
Most experiments aiming to mitigate enteric methane by using lipids or nitrate have given these agents in higher amounts than in effective or potential on-farm conditions. Here we tested the combination of linseed and nitrates with a moderate supply of each, but their action was expected to be additive. This combination not only failed to mitigate methane yield but also impaired bull liveweight gain as a consequence of a trend in decreasing DM intake, probably due to nitrate rather than to linseed supply. This is a surprising outcome given the relatively moderate nitrate supply used, and explanations remain to be found. To date, it is not possible to suggest the use of nitrate in moderate amounts (1% of diet on DM basis). However, the low level of blood metHb in the animals and the absence of residues in their products are encouraging, and needs to be confirmed with higher nitrate supply before a potential proposal of the use of nitrate for on-farm methane mitigation.
Acknowledgements
This experiment is a part of a large collaborative project led by INRA with grant funding from a consortium of 11 R&D institutes and private companies: Adisseo France SAS (Antony, France), Agrial (Caen, France), Apis Gene (Paris, France), Deltavit (Janzé, France), DSM Nutritional Products AG (Kaiseraugst, Switzerland), Institut de l’Elevage (Paris, France), Lallemand (Blagnac, France), Moy Park Beef Orléans (Fleury-les-Aubrais, France), Neovia (Saint-Nolff, France), Techna France Nutrition (Couëron, France), Valorex (Combourtillé, France). This project aims to reduce enteric methane emission via nutritional strategies. Animals were managed in the experimental facilities of INRA Experimental Unit Herbipôle, and we thank the Herbipôle staff, especially Pascal Faure. The authors also thank Clothilde Lascoux for her help in obtaining and analysing data.