I. INTRODUCTION
Red mud (RM), the waste product after caustic digestion of bauxite during extraction of alumina, consists of a heterogeneous mixture of minerals such as quartz, goethite, hematite, calcite, sodalite, and gibbsite.Reference Sahu, Patel and Ray1–Reference Palmer, Frost and Nguyen3 RM is highly alkaline with a pH of 10–12.5.Reference Wang, Ang and Tade4 Because of the alkalinity as well as chemical and mineralogical properties, RM is classified as toxic industrial wasteReference Hind, Bhargava and Grocott5 that requires treatment before discharging to the environment. However, because it is expensive to dispose of large quantities of alkaline RM after due treatment meeting the environmental concerns,Reference Wang, Ang and Tade4,Reference Zhang, Qu and Wu6 large quantities of RM are either stored in impoundmentsReference Brunori, Cremisini, Massanisso, Pinto and Torricelli7 or dumped into the sea.Reference Paramguru, Rath and Misra8 The storage and maintenance of RM is a challenging environmental problem, which is a risk for living organisms. RM also has adverse impact on soil properties, ground water and air borne dust.Reference Sahu, Patel and Ray1 Researchers have recently paid attention to environmentally benign applications of RM. RM presents a prospective application in water treatment for the removal of toxic heavy metals, inorganic anions, metalloid ions, as well as organics including dyes, phenolic compounds and bacteria. For optimizing the pollutant removal capabilities of RM, the RM from bauxite mines and similar mineral extraction and process plants/refineries need to be activated by acidification, heat activation, or a combination of several treatments.Reference Liu, Naidu and Ming9
Bacteria are ubiquitous and are present abundantly in natural surroundings and specifically near the surfaces of aqueous environment.Reference Barns, Nierzwicki-Bauer, Banfield and Nealson10 For assessing the risk of microbiological pollution or predicting how far a wastewater plume and its microbiological load can travel in aquifers, the potential of Escherichia coli (E. coli) to travel in aquifers has been assessed.Reference Foppena, Liemb and Schijvenc11 E. coli broadly indicates risk of pathogensReference Dorner, Anderson, Gaulin, Candon, Slawson, Payment and Huck12–Reference Guo, Cao, Su, Li, Hu and Xu14 and is transported in water as free cells or cells attached to soil or manure particles.Reference Muirhead, Collins and Bremer15,Reference Oliver, Clegg, Heathwaite and Haygarth16
The interactions between bacteria and primary minerals such as hematite,Reference Zhang, Rittmann and Chen17 quartz,Reference Johnson and Logan18 montmorillonite,Reference Guo, Cao, Su, Li, Hu and Xu14 dolomite, and apatiteReference Zheng, Arps and Smith19 have been investigated by a number of laboratory studies over the past years. The adsorption properties of Cu2+-loaded montmorillonite clays (MMT-Cu) for E. coli were investigated. The mechanism of adsorption of E. coli onto MMT-Cu involves electrostatic attraction and physiochemical properties of bacterial cell walls and minerals surfaces.Reference Guo, Cao, Su, Li, Hu and Xu14 Ho et al.Reference Ho, Gibbs and Mathew20 removed E. coli. and viruses by filtering primary sewage effluent through mixtures of RM and sandy soil packed into plastic columns. Zhen et al.Reference Zhen, Zhang, Ji, Yin, Tong and Chu21 reported the adsorption properties of the RM, diatomite, zeolite, meerschaum, and montmorillonite on the microbes in the air and RM gained the highest level of adsorption at 400 cfu/dm2 and was better than other samples. However, the mechanism of adsorbing bacteria, the influence of the porosity of red mud on the ability to adsorb bacteria, or the detailed interactions between red mud and bacteria has not been reported yet. Therefore, the causative factors for adsorption of E. coli on red mud were investigated in the present article. The influence of adsorption on RM activated by heat activation with the changes of pore structure, morphology, and phase composition was investigated. RM processed at different calcination temperatures and the effects on the changes in the specific surface area, pore volume, phase composition, microstructure and zeta potential were investigated by thermogravimetric analysis (TGA), x-ray diffraction (XRD), scanning electron microscopy (SEM), Brunauer, Emmett, Teller (BET) method of surface area measurement/N2 adsorption, and zeta potential analysis, respectively. The correlation between the adsorption efficacy and surface properties of RM was studied experimentally and theoretically. The objective is to elucidate the fundamental mechanisms pertaining to bacterial adhesion on RM.
II. MATERIAL AND METHODS
A. Characterization of RM
1. Powder XRD
The correlation between the calcination temperature and phase composition of the RM was investigated by XRD. The operating parameters of the x-ray generator were 40 kV and 100 mA and patterns were collected in the angular range from 3 to 70° with a step size of 8°.
2. Thermal analysis
The RM sample weighing about 5.4 mg was heated from room temperature to 900 °C at the rate of 10 °C/min in a thermogravimetric analyzer (TGA; NETSZCH model No. STA449C, Selb, Freistaat Bayern, Germany) under a nitrogen atmosphere.
3. Nitrogen adsorption-desorption isotherms
The specific surface area, pore volume, and pore size were determined by the Brunauer, Emmett, Teller method of surface analysis/N2 adsorption method (BET; Accelerated Surface Area and Porosimetry, model No. ASAP2000). To investigate the correlation between the temperature and surface properties, surface area and pore characteristics were examined. The properties of RM are listed in Table I.
Characteristics of RM.

4. Scanning electron microscopy
The microstructures of the RM produced at different calcination temperatures were characterized by scanning electron microscopy (SEM; Hitachi model No. 4300, Tokyo, Japan). To investigate the morphological changes at different calcinated temperatures, the surface morphology and pore structure of the minerals were examined.
5. Measurement of zeta potential
A known weight of RM was suspended in distilled water to reach a final concentration of 0.1 mg/mL. The zeta potentials of the RM were measured on a ZetaPALS Zeta Potential Analyzer (Brookhaven Instruments Corporation, New York, NY) at 25 °C. A 5-mL suspension was introduced to the electrophoretic cell. Each assay was performed on five replicated samples and the values obtained were averaged to give the final data with standard deviations as shown in Table I.
B. Cultivation of E. coli
To prepare a homogenized bacterial culture suspension, the multi-step dispersion method was adopted. The E. coli (ATCC 25922) was initially dispersed in 10 mL of sterile distilled-deionized water to form the bacteria culture suspension of 5.0 × 10¹⁰ cfu/L. The suspension was dispersed in 10 mL of sterile distilled-deionized water again. The suspension was diluted several times in the second step and the final homogenized bacteria culture suspension with 5.0 × 10⁵ cfu/L was obtained.
C. Effects of calcination on RM properties
The RM samples of 325 meshes were obtained from Shandong Weiqiao Company, Shandong, China. They were washed, air-dried and subjected to calcination. The calcination process was as follows. The RM samples placed in porcelain dishes were treated for 2 h in an oven and stored in a purified workstation. Five different calcination temperatures of 300, 400, 500, 600 and 700 °C were selected for the experiments. The samples of RM with different calcination temperatures were called RM300, RM400, RM500, RM600, and RM700 respectively.
D. Effects of changed RM properties on adsorption of RM on E. coli cells
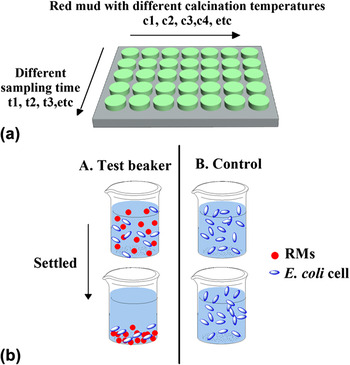
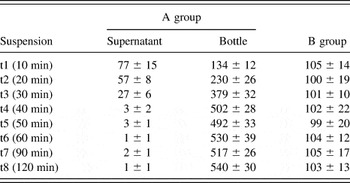
Figure 1(a) presents a schematic of the adsorption experiments and Fig. 1(b) provides a conceptual diagram of how E. coli cells mixed with RM could be separated from the supernatant by settlement. For studying the adsorption quantities, we monitored the decrease in the concentration of the suspended E. coli cells in the bulk liquid. At each sampling point of time (10 min, 20 min, etc.), one beaker dispersed with bacteria and a specific temperature calcination of RM was taken for settlement separation. The adsorption time was the sampling time for that beaker. Group A indicated the mixed suspension with E. coli cells and RM divided into different groups based on adsorption time and calcination designated with different temperature-labeled RM. t1, t2, t3, etc. indicated the sampling time (different adsorption times), and c1, c2, and c3 etc. indicated the calcination designated with different temperature-labeled RM in each group. As shown in Fig. 1(b), group A represented a typical test beaker in which the RM settled and was separated from the supernatant of the mixture. Group B, a control group, represented a negative control in which only E. coli cells were dispersed and allowed to settle for enabling examination of the residual E. coli cells in the supernatant. Three replicated samples were measured and averages were shown in the final data with standard deviations. An example is shown in Table II.
(a) Schematic of the adsorption experiments. (b) Schematic representation of settlement separation of E. coli cells from the mixture with RM.

Number of adsorbed E. coli cells on RM700.

III. RESULTS AND DISCUSSION
A. Effects of calcination temperature on RM properties
1. XRD and thermal properties
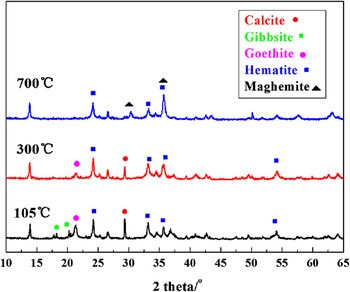
For studying the effects of calcination temperature on composition and phase of RM, the samples prepared at different calcination temperatures were characterized by XRD and thermogravimetric analysis. The raw RM (RM0) is composed by a mixture of different mineral phases mainly containing calcite, goethite, hematite, sodalite, gibbsite and quartz (Fig. 2). After the heat treatment at 300 °C, the gibbsite peak in the XRD patterns disappears. The calcite and goethite peaks in XRD patterns also disappear after calcination at 700 °C. The absence of the peak indicates decomposition of calcite (26 wt%) and goethite. The RM contains a considerable amount of iron oxides and hydroxides. The total hematite (iron oxides) and goethite (iron hydroxides) of the sample are around 30 wt%.
XRD patterns of the samples: raw red mud, red mud calcinated at 300 °C, and red mud calcinated at 700 °C.

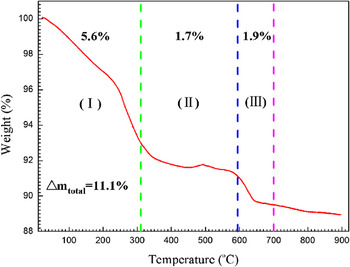
The TGA curve illustrates the change in the RM compositions partially. The total mass loss is 11.1% until 900 °C and thermal decomposition of RM exhibits three stages (Fig. 3). In the first stage between 20 and 310 °C, the mass loss is 7%. The mass loss is related to free water evaporation, decomposition of gibbsite, and loss of hydroxyl groups to form cryptocrystalline alumina.Reference Castaldi, Silvetti, Santona, Enzo and Melis22–Reference Mercury, Cabral, Paiva, Angelica, Neves and Scheller24 The reactions are shown in Eqs. (1) and (2). The second mass loss observed between 311 and 594 °C is attributed to goethite dehydration into hematiteReference Huang, Wang, Zhu, Lia, Yao, Rudolph and Haghseresht2,Reference Laskou, Margomenou-Leonidopoulou and Balek25 as shown in Eq. (3). The last one occurs between 595 and 700 °CReference Alp and Goral26,Reference Atasoy27 and it is associated with calcite decomposition as shown in Eq. (4). The TGA curve gives the same conclusion as XRDs.
 $${\rm{H}}_{\rm{2}} {\rm{O}}_{{\rm{(1)}}} \to {\rm{H}}_{\rm{2}} {\rm{O}}_{{\rm{(g)}}} \quad,$$
 $$2{\rm{Al(OH)}}_{{\rm{3(s)}}} \to {\rm{Al}}_{\rm{2}} {\rm{O}}_{\rm{3}} - k_{{\rm{(s)}}} + 3{\rm{H}}_{\rm{2}} {\rm{O}}_{{\rm{(g)}}} \quad,$$
 $${\rm{2FeO(OH)}}_{{\rm{(s)}}} \to {\rm{Fe}}_{\rm{2}} {\rm{O}}_{\rm{3(s)}} {\rm{ + H}}_{\rm{2}} {\rm{O}}_{{\rm{(g)}}} \quad,$$
 $${\rm{CaCO}}_{{\rm{3(s)}}} \to {\rm{CaO}}_{{\rm{(s)}}} {\rm{ + CO}}_{{\rm{2(s)}}}\quad .$$
TGA curves of red mud. (Heating rate = 10 °C/min under a nitrogen atmosphere).

2. Morphology and structure
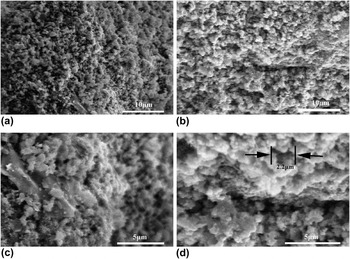
The changes in specific surface area, pore volume, and pore size were measured by the BET/N2 adsorption method (Table I). The specific surface area of RM0 is 14.134 m2/g and the average pore size is 13.43 nm. From sample RM0 to sample RM500, specific surface area increases to 48.432 m2/g with the average pore diameter decreasing to 6.1 nm. A great number of small pores were formed with the free water evaporation and decomposition of gibbsite and goethite. When the calcination temperature reaches 600 °C, the average pore diameter of RM increases rapidly and the specific surface area decreases. The average pore diameter of RM700 reaches 16 nm, which is larger than others. Decomposition of calcite (CaCO3) increases the pore volume, and average pore diameter of the RM.Reference Sglavo, Maurina, Conci, Salviati, Carturan and Cocco28 In addition, the morphology changes at different calcination temperatures, the surface and porous structure of RM were examined by SEM. RM is made of many mineral crystals. Multiple small mineral crystals form the aggregates of RM and the morphology of RM is not regular (Fig. 4). The surface of RM300 is rough and has porous structure [Fig. 4(a)]. When RM was calcinated at 700 °C, CaCO3 was endothermically decomposed leaving more pores [Fig. 4(b)].Reference Sglavo, Maurina, Conci, Salviati, Carturan and Cocco28,Reference Linares, Sanchez, de Navarro, Rodriguez and Goldwasser29 At a higher magnification, the actual volume of the pores is larger than the one used in the calculation, because additional voids such as empty channels are formed when CaCO3 escapes from the RM. The macropores in the RM are 1–3 μm in size [Fig. 4(d)]. Individual cells of E. coli with a rod shape, length of approximately 1.5–2.1 μm, and diameter of 0.4–0.6 μmReference Ma, Yang and Xie30 can easily adhere onto the RM and so after the heat treatment, a more macroporous structure appears.
Low-magnification SEM images of (a) red mud calcinated at 300 °C and (b) red mud calcinated at 700 °C and high-magnification SEM images of (c) red mud calcinated at 300 °C and (d) red mud calcinated at 700 °C.

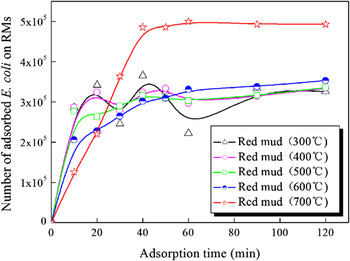
Variation of the adsorption capacity with adsorption time at various red mud calcination temperature.

3. Zeta potential
The E. coli cells adsorption experiments were conducted at a pH of 11.0. The zeta potentials of RM0 and RM700 are −10.93 and −10.21 mV, respectively. The charges on the surface of E. coli cells are negative and the zeta potential is around −40 mV.Reference Foppena, Liemb and Schijvenc11,Reference Guo, Cao, Su, Li, Hu and Xu14 Therefore, repulsion forces exist between the RM and E. coli cells.
B. Effects of RM surface properties on E. coli adsorption capacity
Table II shows the reduction in E. coli cell numbers in the supernatant. The reduction is related to adsorption onto RM. In addition, the increasing number of E. coli cells in the bottle means the E. coli cells still have multiple properties at the high pH for 18 h. The variation of the adsorption capacity with adsorption time at various red mud calcination temperature is shown in Fig. 5. According to the vertical axis, the number of adsorbed E. coli on RM indicates the adsorption capacity of RM. The number of adsorbed E. coli cells of the RM calcinated below 600 °C is smaller than that at 700 °C. When the adsorption reaches equilibrium, the adsorption capacity of 700RM is largest and the number of adsorbed E. coli on the RM700 is almost 5 × 10⁵. The larger pores formed lead to more active sites and more places on RM to load E. coli. Although RM500 has the high specific surface area, the small pores on RM500 are too difficult to improve the capacity to load more bacteria. The adsorption number on the RM calcinated below 600 °C increases linearly with time in the first 20 min and is almost constant afterward. This is due to the decreased diffusion rate of E. coli cells to RM with decreasing concentration of E. coli cells.Reference Karaca, Gurses, Ejder and Acikyildiz31 With regard to RM700, adsorption occurs quickly in the first 40 min and in the subsequent hour, the uptake slows until adsorption reaches equilibrium. Thus, RM700, which gains a high level of adsorption in a short time, has good adsorption efficacy.
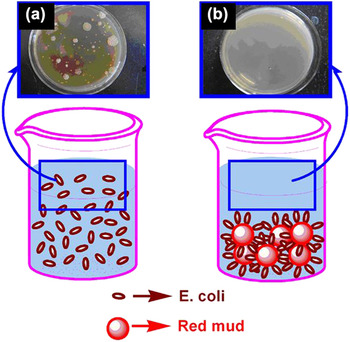
For studying the adsorption process in more detail, images are taken. The E. coli cells are randomly dispersed in the aqueous solution without adding RM after settling for 18 h [Fig. 6(a)]. In the suspension with RM and after settlement for 18 h, the bacteria disappear from the upper clear liquid [Fig. 6(b)] meaning that the bacteria adsorb onto the RM surface.
Bacteria quantity calculated by the flat colony counting method: (a) before adsorption and (b) after adsorption.

C. Interaction energy between RM and E. coli cells
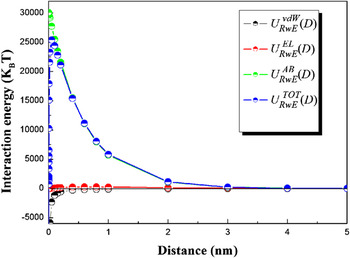
Extended Derjaguin-Landau-Verwey-Overbeek (EDLVO)Reference Zhang, Rittmann and Chen17 theory is used to deal the interaction between RM0 and E. coli cells and the result is shown in Fig. 7. Adsorption is an interfacial interaction mediated by the balance between interparticle forces arising from a combination of van der Waals, electrostatic, and acid-base forces.Reference He, Wan and Tokunaga32,Reference Snoswell, Duan, Fornasiero and Ralston33 The total interaction energies between RM and E. coli cells calculated by Eq. (5) are shown in Fig. 7:
 $${\rm{U}}_{{\rm{RwE}}}^{{\rm{TOT - EDLVO}}} (D) = {\rm{U}}_{{\rm{RwE}}}^{{\rm{vdW}}} (D) + {\rm{U}}_{{\rm{RwE}}}^{{\rm{EL}}} (D) + {\rm{U}}_{{\rm{RwE}}}^{{\rm{AB}}} (D)\quad,$$
where  ${\rm{U}}_{{\rm{RwE}}}^{{\rm{TOT}}} (D)$ is the total interaction energy (
 $k_{\rm{B}} T$) between a single red mud (denoted R) and a single E. coli cell (denoted E) in water (denoted w), D is the interacting distance (nm), and
 ${\rm{U}}_{{\rm{RwE}}}^{{\rm{TOT}}} (D)$ is comprised of its three energy components:
 ${\rm{U}}_{{\rm{RwE}}}^{{\rm{vdW}}} (D)$ is the van der Waals interaction energy (
 $k_{\rm{B}} T$),
 ${\rm{U}}_{{\rm{RwE}}}^{{\rm{EL}}} (D)$ is the electrostatic interaction energy (
 $k_{\rm{B}} T$), and
 ${\rm{U}}_{{\rm{RwE}}}^{{\rm{AB}}} (D)$ is the acid-base interaction energy (
 $k_{\rm{B}} T$). The values used are colloid diameter = 2.4 µm, colloid surface potential = −40 mV, collector surface potential = −10.2 mV, temperature = 298 K, Hamaker constant = 2.4 × 10⁻²¹ J, and Born collision parameter = 6 × 10⁻¹⁰ m.
Total interaction energy and interaction energy components between RM and E. coli cells calculated from the EDLVO theory.

Figure 7 displays the three components of the interaction energies. Van der Waals force produces negative interaction energies acting as the attractive force. In contrast, the positive acid-base interaction energy and electrostatic force results in repulsion due to the hydration force and electrostatic repulsion. In general, the E. coli cells have a higher energy barrier to overcome before they contact or adsorb on RM0. In the RM–E. coli system, the EDLVO theory does not adequately explain the adhesion phenomena. However, other surface properties such as particle roughness, surface charge heterogeneity, and polymer content may affect the interaction energy, but their effects have not been quantitatively represented in the EDLVO theory.Reference Hermansson34–Reference Bostrom, Williams and Ninham36 RM comprising a heterogeneous mixture of different minerals contains lots of hematite and goethite analyzed to some extent in Sec. III. A. 1. dealing with XRD analysis, which have the ability to adsorb E. coli cells as reported previously.Reference Foppena, Liemb and Schijvenc11,Reference Zhang, Rittmann and Chen17 Hematite and goethite act as active sites for the adsorption of RM to E. coli. Thus, hydrogen bonding, chemical interactions, and active sites are probably involved in the ability of RM to adsorb E. coli cells.
The max  ${\rm{U}}_{{\rm{RwE}}}^{{\rm{TOT}}} (D)$of RM700 is 25392 (
 $k_{\rm{B}} T$). It is less than the max
 ${\rm{U}}_{{\rm{RwE}}}^{{\rm{TOT}}} (D)$ of RM0 25451 (
 $k_{\rm{B}} T$) due to the decrease of
 ${\rm{U}}_{{\rm{RwE}}}^{{\rm{EL}}} (D)$ caused by the decreasing zeta potential. It means the E. coli have to overcome a smaller energy barrier to adsorb onto the RM. In addition, RM700 has larger pore volume and average pore diameter derived from CaCO3 decomposition. When the calcination temperature is 700 °C at which complete decomposition of CaCO3 occurs, removal of E. coli from the solution is improved as compared with that on the sample treated at below 600 °C. For RM, adsorption of E. coli shows the same trend as that of phosphatesReference Huang, Wang, Zhu, Lia, Yao, Rudolph and Haghseresht2 and nitrates.Reference Cengeloglu, Tor, Ersoz and Arslan37 Hence, the rougher surface on the RM may constitute another important factor in the adsorption to E. coli.
IV. CONCLUSION
E. coli cells can adhere onto RM and the efficacy depends on the RM calcination temperature. A larger adsorption capacity is observed in RM700 processed at 700 °C. The larger pores formed by the decomposition of calcite leads to more active sites and more places on RM to load E. coli. The EDLVO theory explains the increased adsorption based on the smaller energy barrier between E. coli cells and RM700 as compared with that between E. coli cells and RM0. The active sites on the RM, such as hematite and goethite, and rough surface are also important factors affecting the ability of E. coli cells to adhere.
ACKNOWLEDGMENTS
This study was jointly supported by National High Technology Research and Development Program (863 Program 2012AA06A109) of China, the open foundation of National Laboratory of Mineral Materials of China University of Geosciences (Grant Nos. 519002310062 and 08A005), as well as Hong Kong Research Grants Council (RGC) General Research Funds (GRF) Nos. CityU 112510 and 112212.