1. Introduction
Boundaries form an important feature of any environment for navigation. Some geographical boundaries, such as rivers or train tracks, can affect navigation and cause diversions by forcing travel to flow through bottlenecks, such as bridges and tunnels. Other boundaries, allocated by countries, states or local administrations, may not always be clearly visible, yet they can become important in restricting movement or affecting the way movement of individuals occurs. These boundaries can affect how the environment is represented cognitively, such as via cognitive maps (cf. Tolman, Reference Tolman1948; O'Keefe and Nadel, Reference O'Keefe and Nadel1978). Boundaries can cause distortions of spatial memory and erroneous distance estimates (e.g. Stevens and Coupe, Reference Stevens and Coupe1978; Chase, Reference Chase1983; Okabayashi and Glynn, Reference Okabayashi and Glynn1984; McNamara, Reference McNamara1986; Klippel et al., Reference Klippel, Knuf, Hommel and Freksa2004). Often locations are also recalled faster (e.g. Chase, Reference Chase1983) and more precisely (e.g. Stevens and Coupe, Reference Stevens and Coupe1978) within than across neighbourhoods. In this context, as boundaries geographically separate neighbouring areas from each other and mark area limits, they can globally facilitate a segregation of the entire environment into smaller, well-defined regions.
Why might boundaries be important for navigation? Computational models of route planning have shown that boundaries are critical in segregating the environment into ‘chunks’ for efficiently planning of routes (e.g. McNamee et al., Reference McNamee, Wolpert and Lengyel2016; McNamee, Reference McNamee2019). For example, a simple route plan would consider the sequence of streets across the environment one step at a time and sequentially build a route all the way to the goal. This is computationally quite demanding. More efficiently, it is possible to use the regional and boundary information in the environment for a higher-level hierarchical plan of how to reach the goal, e.g., planning across regions (high level) before detailed (low level) planning of the exact streets within regions (McNamee et al., Reference McNamee, Wolpert and Lengyel2016; McNamee, Reference McNamee2019). Such a hierarchical planning process allows one to eliminate irrelevant information and focus on information from a subset of regions that is relevant for planning. Behavioural support for such a hierarchical organisation of space has also been found (e.g. Wiener et al., Reference Wiener, Schnee and Mallot2004; Hurts, Reference Hurts2005; Wiener and Mallot, Reference Wiener and Mallot2009; Balaguer et al., Reference Balaguer, Spiers, Hassabis and Summerfield2016; Schick et al., Reference Schick, Halfmann, Hardiess, Hamm and Mallot2019). In these studies, a hierarchical segregation was artificially imposed on a virtual environment through semantic object (Wiener et al., Reference Wiener, Schnee and Mallot2004; Wiener and Mallot, Reference Wiener and Mallot2009) or language cue categories (Schick et al., Reference Schick, Halfmann, Hardiess, Hamm and Mallot2019), or through colours (e.g. Wiener et al., Reference Wiener, Ehbauer and Mallot2009; Balaguer et al., Reference Balaguer, Spiers, Hassabis and Summerfield2016). These types of segregation of the artificial environment explained behavioural preferences for route choices. For instance, Balaguer et al. (Reference Balaguer, Spiers, Hassabis and Summerfield2016) imposed a hierarchy on a subway network using different colours for train lines. Here, variables related to the hierarchical segregation of the environment (e.g. number of different lines to the goal) explained the response times of individuals who planned routes through the virtual environment.
However, in contrast to many artificial environments, it remains unclear if individuals also cognitively represent a real-world environment by segregating it, and which features of the environment would determine the boundaries of such a regionalisation. For instance, in an urban environment like London, UK, it remains unclear which features of the street network might determine the boundaries of individual regions. Yet, this information could crucially affect how humans plan routes. If individuals rely on such a segregation of the environment during their route planning processes, planning along or across streets that are considered boundaries might have a different effect on the planning behaviour than streets that are within a region. In particular, such boundary streets might require different planning actions, such as planning ahead or the selection of future sub-goals, which might coincide with street network boundaries, similar to planning across hierarchically organised, abstract spaces (McNamee et al., Reference McNamee, Wolpert and Lengyel2016). Here, individuals might use these boundaries to plan across an upcoming region from one boundary, where they enter the region, to the boundary where they leave it. Therefore, understanding where individuals perceive boundaries in the street network and what determines the boundary character of a street, can provide important information to explain route planning in a real-world environment.
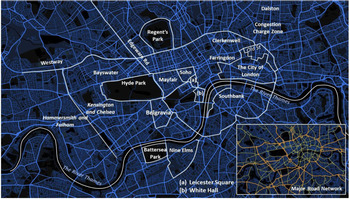
Historically, medieval cities like London often lack a clear, regular structure of the street network, in contrast to many modern cities that have been carefully designed and built in a square-shaped pattern to save space and allow easier navigation (e.g. Manhattan, New York, USA, or Brasilia in Brazil; cf. Epstein, Reference Epstein1973). Instead, London displays a largely irregular street network. Here, boundaries (related to the street network) might not exist for some areas which are highly complex because they originate from multiple, merging, unstructured, medieval settlements along important arterial roads. Owing to the unstructured merging of settlements, some London areas do not have clear boundaries. Such areas include Bayswater, Clerkenwell, Farringdon and Dalston (Figure 1).
Areas and districts of London. Overview of London and the street network, with boundaries for expected areas (bold), streets (italic) and the River Thames. The major street network has been highlighted in orange and yellow (bottom right). Source: © Mapbox, © OpenStreetMap

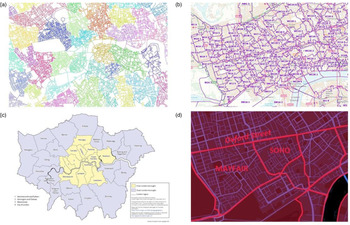
However, the arterial roads that have survived over centuries and become major roads in contemporary London (MOLA, 2014; Layers of London, 2020) might still be important for the perception of the city (Lynch, Reference Lynch1960) and be perceived as boundaries for areas that developed on each side of those important roads. Examples include Watling Street, which once ran north along Edgware Road (O'Brien, Reference O'Brien2013; Lordan, Reference Lordan2018), and Portway, which continued west from Farringdon Road along Oxford Street, at the northern edge of Soho and Mayfair (O'Brien, Reference O'Brien2013). In line with this, past research suggests that road categories (Figure 1) may be a key factor in determining which regions in an environment become used as boundaries in mental representations (Pailhous, Reference Pailhous1969, Reference Pailhous1984). In this context, Parisian taxi drivers have been found to represent the street network in a hierarchical manner, using two layers: a basic network consisting of major roads (orange and yellow roads in the example from such roads in London, Figure 1) and a secondary network of minor roads (blue roads, Figure 1; Pailhous, Reference Pailhous1969, Reference Pailhous1984). However, this might only reflect a preference for major roads over minor roads and be only linked to the purpose of route planning, rather than a regionalised representation as suggested by McNamee et al. (Reference McNamee, Wolpert and Lengyel2016). The clusters of minor roads that are surrounded and segregated by major roads might not be considered as individual regions. Ultimately, this would not necessarily facilitate a global selection of those clusters for local planning across each individual region, using its boundaries (i.e. from main road to main road). Other geographical approaches have used traffic flow (e.g. Manley, Reference Manley2014; Manley et al., Reference Manley, Orr and Cheng2015) and topological clustering of the street network (e.g. Jiang and Claramunt, Reference Jiang and Claramunt2004; Masucci et al., Reference Masucci, Smith, Crooks and Batty2009, Reference Masucci, Arcaute, Hatna, Stanilov and Batty2015; Filomena et al., Reference Filomena, Verstegen and Manley2019) to identify potential regions in London or in other cities. On the other hand, these approaches were mainly based on street network analytics and do not account for the visual features of the environment that might make an area distinct, such as buildings of a similar style. This means that the resulting clusters from the analysis of the street network often only reflect spatial features but lack information on how regions and their boundaries are perceived by humans (Figure 2a).
Types of boundaries in London. London has been segregated into areas with specific, well-defined boundaries with different purposes. Administrative boundaries include small postal areas (a) or larger, locally governed boroughs (b). Computational clustering (c) based on street network properties highlight clusters with no clear street network boundaries as for postal areas and boroughs. Districts, such as Soho, Mayfair, Leicester Square and Covent Garden (d) partially reflect clustering features and bridges between fine-grained postal areas and large-scale boroughs. Sources: (a) © Crown copyright and database rights [2021] Ordnance Survey (100025252); (b) Office for National Statistics; (c) Gabriele Filomena, based on Lynch (Reference Lynch1960); (d) © Mapbox © OpenStreetMap

More closely related to daily life experiences that could affect human perception and more likely be represented cognitively by individuals might be boundaries that serve an administrative purpose (Campari, Reference Campari1996). In London, these could include postal (Figure 2b), electoral, census and healthcare areas (Open Geography Portal, 2020) or boroughs (Figure 2c; London Councils, n.d.). These administrative areas define local competencies and responsibilities for a collection of households (London Councils, n.d.) rather than geographical features of the environment (i.e. paths, edges, nodes, districts and landmarks; Lynch, Reference Lynch1960) and can vary in their size and layout. While postal areas (Figure 2b) appear to enclose extremely fine-grained areas through complex outlines, boroughs (Figure 2c) might be placed at the other end of the spectrum as they enclose large regions. Thus, both might be suboptimal for a segregation and result in a higher cognitive effort if plans had to be formed across those regions (McNamee et al., Reference McNamee, Wolpert and Lengyel2016). Therefore, it seems plausible that smaller areas with specific and well-defined outlines might better meet the requirements of a more optimal segregation of the environment. This paper will therefore refer to these specific London areas as ‘districts’ to distinguish them from the general, less specific term of ‘areas’ that might cover entire regions or parts of the city without fixed boundaries in place.
For such districts, street network boundaries might have developed historically with the purpose of the areas they are expected to enclose. Thus, they might be conceptually distinct and serve a particular purpose (cf. Lynch, Reference Lynch1960). For instance, Soho (Figure 2d) initially served as a park, before it was turned into an upper-class living area, then a red-light district, and now stands out because of theatre productions, night life and hosting the gay community. Additionally, Soho is enclosed by streets that clearly separate it from neighbouring areas and districts, such as Mayfair (Figure 2d).
In general, a regionalisation might thus be caused by perceptual features related to regions that make them distinguishably different from their surrounding areas. For instance, specific visual features of spatial layouts (e.g. colours, shapes or symmetry) were found to explain spatial clustering (e.g. Okabayashi and Glynn, Reference Okabayashi and Glynn1984; Hommel et al., Reference Hommel, Gehrke and Knuf2000; Klippel et al., Reference Klippel, Knuf, Hommel and Freksa2004; Hurts, Reference Hurts2005; Clements-Stephens et al., Reference Clements-Stephens, McKell-Jeffers, Maddux and Shelton2011). Similarly, in an urban environment, visual and perceptual features that might facilitate a clustering to distinguish areas from their surroundings might include specific architecture, the density and type of businesses (i.e. restaurants, clubs, shops), or the purpose of that area (Lynch, Reference Lynch1960). Thus, areas such as Whitehall, Southbank and Soho might be perceived as distinct for their unique political, touristic or cultural purpose which is also visually reflected through the buildings in the area. Inversely, parks might be distinguishable from their surrounding urban environment by their green space character. Outlines of these areas might be affected by perceptual biasing effects, such as the simplification of irregularly shaped boundaries through more linear outlines (e.g. Milgram, Reference Milgram, Proshansky, Ittelson and Rivlin1976; Tversky, Reference Tversky1981; Costa and Bonetti, Reference Costa and Bonetti2018). This might facilitate a perception, where linear streets are more likely identified as boundaries of districts rather than streets with an irregular and more complex outline. Additional support can also be found in essential properties that made a street identifiable as an important structure of a city. This includes, amongst others, the distinctiveness, continuity or importance of that street (Lynch, Reference Lynch1960).
Thus, it is hypothesised that street network-related boundaries will depend on (1) the distinctive purpose of the district they enclose and (2) the degree of regularity in the geometry of the street network that forms the outlining boundary. In particular, it is expected that prominent, topical districts with a distinct function that are embedded in a straight, regular street network are more likely to be surrounded by streets that are perceived as boundaries. Furthermore, there also exist prominent, straight main roads that separate areas and thus are expected to function as perceptual boundaries in themselves. Additionally, boundary streets will emerge around fully bounded geographical features, such as parks, as they form important geographical landmarks and contribute to the recognisability of a city (Lynch, Reference Lynch1960). In particular, the River Thames is predicted to be highly conserved and to act as a major barrier (Lynch, Reference Lynch1960). Finally, the majority of boundaries are expected to be main roads. For London streets, the following predictions about boundaries were consequently derived (cf. Table 1). Districts that fall within the above category of prominent districts with a regular street network include: Soho, Mayfair, Belgravia, Nine Elms, White Hall and the Congestion Charge Zone. These will be more consistently identified than districts with an irregular outline (i.e. polygons) and containing streets that are minor roads, such as the City of London, Leicester Square and Southbank. Streets enclosing prominent parks, such as Hyde Park, Regent's Park and Battersea Park, will be more consistently identified as boundaries. The River Thames constitutes a prominent geographical feature that will be identified as a natural boundary separating areas south of the river from the rest of London.
Expected boundary list

One challenge in attempting to understand how the structure of a city affects cognitive representations is having a sample of participants with enough breadth and depth of experience of the city to provide consistent data over the city. London offers a rare opportunity to achieve this – licensed London taxi (cab) drivers. To qualify as a black cab driver in London, applicants have to attain the ‘Knowledge of London’. This knowledge consists of a profound knowledge of the street network, the street names, the location of places of interest and precise driving instructions (e.g. TFL, n.d.; Lordan, Reference Lordan2018; Electronic Blue Book, 2019; Griesbauer et al., Reference Griesbauer, Manley, Wiener and Spiers2021). As a result, licensed London taxi drivers daily navigate across sections of the ~56,000 streets that form London (OS MasterMap Integrated Transport Network, 2018) without relying on any physical navigation aids. Their almost perfect knowledge, in contrast to the fragmented knowledge of lay people, makes them appropriate subjects to test the cognitive representation of boundaries in all areas of London without limitations. Additionally, the taxi drivers’ formal training is not explicitly based on boundaries, which therefore provides an opportunity to test the naturally developed perception of boundaries, based on training and years of experience driving a taxi. In the past, this knowledge of taxi drivers has also provided insight into the neural basis of navigation (Maguire et al., Reference Maguire, Gadian, Johnsrude, Good, Ashburner, Frackowiak and Frith2000, Reference Maguire, Woollett and Spiers2006a, Reference Maguire, Nannery and Spiers2006b; Spiers and Maguire, Reference Spiers and Maguire2006, Reference Spiers and Maguire2007), as well as the dynamics of cognition during navigation (Spiers and Maguire, Reference Spiers and Maguire2008). Yet, it remains unclear which regions of London the taxi drivers consistently perceive as the boundaries of London.
2. Methods
For this study, licensed London taxi drivers were recruited. The taxi drivers’ extensive knowledge is based on years of training and daily experience of navigating around London that the general population would not be able to achieve without years of specific training as done in ‘knowledge’ schools (e.g. TFL (n.d.)). Such an exhaustive knowledge makes it possible to test each individual's perception of ‘semantic boundaries’ (i.e. boundaries with a defined name that outline regions, e.g. Soho, Hyde Park) across different areas in London.
2.1 Participants
Fourteen male licensed London taxi drivers were recruited from the taxi rank at Russell Square, London, and all gave written informed consent to participate in the study approved by the ethics committee (ethics number: EP/2018/008). One participant failed to perform the task correctly. His data was removed, leaving a total of N = 13 taxi drivers. All but one of the taxi drivers reported their age (M = 45⋅86, SD = 10⋅77 years) and their experience driving a taxi (M = 9⋅54, SD = 8⋅77 years). The taxi drivers were also asked to indicate the areas in which they preferred to work. The reported areas of preference were areas in Central London: the West End, the City of London, Camden, St Pancras, Chelsea and Fulham.
2.2 Material
A black-and-white paper map of London was printed in A4 landscape format with a scale of 1:31,520. The map displayed an area of London extending from Acton in the west to Limehouse in the east, and from Swiss Cottage in the north to Clapham Junction in the south. Street and area labels were removed to avoid bias in the drawings of areas originating from the positioning of street and area labels in the map.
Since London consists of multiple areas with undefined boundaries (e.g. Bloomsbury), the study focused on prominent, topical districts with distinct functions that were expected to be consistently understood to form potential boundaries. Initially, a list of potential district and area names was derived based on a London A to Z wall map for the area of Central London (i.e. displaying the boroughs of City of Westminster and City of London and central parts of Kensington & Chelsea, Wandsworth, Lambeth, Southwark, Tower Hamlets, Hackney, Islington and Camden). For each district, an online search was carried out to check for official sources that classified potential streets and other street network features as boundaries of those districts that would support a potential boundary perception. If two or more reliable websites indicated a major consensus on area boundaries (i.e. agreement on most boundaries with only few exceptions, e.g. Whitehall, Southbank), the district or area was included as a task in this study. Additionally included were the extension of Edgeware Road to the north and the Westway to the west beyond the Congestion Charge Zone limits (Figure 1), as these major roads naturally continue beyond their intersection. Furthermore, the potential western boundary for Central London (i.e. the boundary between the boroughs of Kensington and Chelsea and Hammersmith and Fulham) was added. Finally, geographical features with boundaries (e.g. major parks) and geographical features that were expected to be a boundary in themselves (i.e. the River Thames) were included.
The final list of districts and areas with potential boundaries is displayed in Table 1. A map, summarising the potential boundaries that taxi drivers were expected to draw, can be found in Figure 2b.
2.3 Procedure
The taxi drivers received a paper map and were asked to mark the boundaries of each area that they were told by the experimenter. To focus them on generally perceived rather than individually perceived boundaries, they were asked to only mark streets (or other features, e.g. rivers and train tracks) only if they were sure that nine out of 10 other taxi drivers would agree with them on that boundary. Boundaries were defined to them as a street (or structure) that enclosed a distinct or area in London or divided two districts or areas from each other. In this sense, any place or street within an area would be unambiguously divided from a place outside that area through a boundary street (e.g. someone would be considered ‘in Russell Square’ if they were within the area that the roads around the square enclosed). Roads with this function should be marked as boundaries on the map (e.g. all roads around Russell Square that enclose the square).
The experimenter read out the list of districts and areas in a random order to avoid ordering effects. After the last area was mentioned, they were asked if they perceived any boundary to divide (1) Hammersmith and Fulham from Kensington and Chelsea, (2) Maida Hill from Lisson Grove and (3) the area from Paddington to White City from the north west. Finally, to account for potential areas that might have been excluded by the above criteria but might be important street network features forming boundaries in London, taxi drivers had the chance to add any features that were not included but which they perceived as boundaries in this context.
3. Results
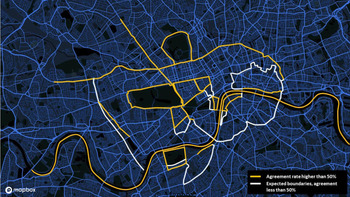
In this study, licensed London taxi drivers drew the boundaries of London districts as they were prompted on a paper map. With these drawings, the aim was to gain a better understanding of area boundaries of the street network in Central London as perceived by expert navigators, such as taxi drivers, who know the whole street network of London extremely well. The analysis of the boundary drawings on paper maps was carried out in two layers. First, an initial understanding was gained from the overlay of all map drawings, showing all boundaries that were perceived across drivers. Additionally, agreement rates across drivers were calculated for each street as the percentage of drivers that indicated a street to be a boundary. The average percentage across all agreement rates of surrounding boundary streets for a district or area was used to represent the agreement of that district or area. An overlaid mapping of boundaries was created and districts with agreement rates above average (more than 50%) and total agreement (100%) were identified across all drawings. Agreement rates above average (more than 50%) were then compared with the boundaries the taxi drivers were expected to draw (Figure 1).
3.1 Overlaid mapping of all drawings
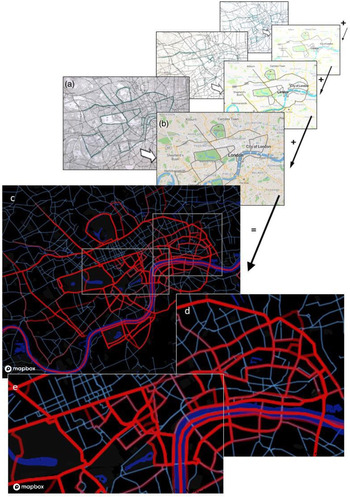
An overlaid mapping of all boundary drawings was used to identify differences in agreement that indicate how manifest a boundary is across individuals. For this overlaid mapping, the individual drawings (Figure 3a) were each digitised (Figure 3b) using the website GeoJSON.IO (Hanson and Seeger, Reference Hanson and Seeger2016) and saved individually in JeoJSON format. For each taxi driver, each street that was highlighted as a boundary was represented through polyline segments. The same polyline segments were used where multiple drivers highlighted the same streets. An overlay of the digitised boundary maps was then created with Mapbox (Figure 3c), a platform that supports customised processing and design of geospatial maps (Mapbox, 2020). The boundaries were displayed with increased transparency to create higher opacity for boundaries that are overlaid with higher frequency.
Overlay of boundaries. The original paper drawings (a) were digitised in geoJSON.IO (b). A layover of all drawings (c) was created. Lines with higher opacity, e.g. boundaries around Mayfair and Soho (e), indicate a higher agreement across drivers on a boundary street than for streets with low opacity, e.g. City of London (d). Sources: (a) © Crown copyright and database rights [2021] Ordnance Survey (100025252); (b) Hanson and Seeger (Reference Hanson and Seeger2016); (c–e) Overlaid mapping created by Melda Salhab (Salhab, Reference Salhab2020)

The resulting map that contained all drawings (Figure 3c, for an interactive map, see Salhab, Reference Salhab2020) was then also used in subsequent analysis to identify differences between areas with varying levels of agreement.
The map showed a good agreement for the major parks, Mayfair, Soho, the Congestion Charge Zone, Westway, Edgware Road extending north and the River Thames. Parts of Belgravia, Whitehall and the boundary between Hammersmith and Kensington indicated agreement across drivers, but also highlighted some ambiguity for individual boundaries. More fuzzy boundaries appeared to be in areas around Leicester Square (Figure 3e), Nine Elms, South Bank and the City of London (Figure 3d).
3.2 Overlay of major boundaries
Since this study aimed to understand the emerging pattern of perceived boundaries for the majority of drivers (more than 50% consensus), streets with an agreement of at least two drivers were transcribed. These created a frequency count to determine consensus across all boundary drawings. Streets with an increased frequency count (>50%) and a high frequency count (>80%) were then cumulatively mapped to identify streets that had a high likelihood of being perceived as a boundary and potential features of the street network linked to this perception.
3.3 Agreement
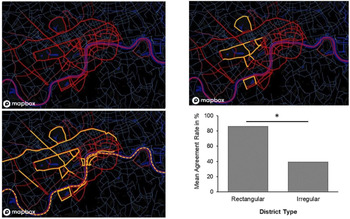
For each London district with expected boundaries as listed in Table 1, the streets that were identified by at least two taxi drivers were transcribed. This frequency was then transformed in an agreement rate as the number of identified boundary streets over the total number of participants. The overall agreement for districts indicated the average agreement rate for boundary streets surrounding that district (see Table 2). Three levels of agreement were distinguished to understand general tendencies: low (less than 50%), increased (more than 50%, but less than 80%) and high consensus (more than 80%). On the overlaid map that contained all boundary data (Figure 4a), increased consensus (Figure 4b) and 100% consensus (Figure 4c) were then visualised to indicate the two extreme levels of boundary agreement rates.
Agreement rates across boundary drawings. The overlay of all boundary drawing indicates areas of different rates of agreement. (a) All boundaries that were overlaid and highlighted in red (Salhab, Reference Salhab2020). (b) Boundaries where the agreement was higher than 50% across drawings highlighted in yellow. (c) Individual streets of regions that were identified as boundaries with 100% of agreement across taxi drivers highlighted in yellow. (d) Comparison of mean agreement rates for districts with almost rectangular (Soho, Mayfair, Belgravia, Whitehall) and irregular shape (Southbank, Leicester Square, Nine Elms, City of London) show significantly higher agreement (t(6) = 3⋅1, p < 0⋅05) for almost rectangularly shaped districts (86%) than for irregularly shaped districts (39%). Source: Overlaid mapping created by Melda Salhab (Reference Salhab2020)

Consensus of boundary drawings across licensed London taxi drivers

a All streets north of the River Thames from Victoria St (south west) to Commercial Street (east).
b Refers only to Upper Thames St and Lower Thames St.
c Holland Rd and Warwick Rd only.
d All remaining streets from the Congestion Charge Zone from Whitechapel High St (east) to Vauxhall Bridge Rd (south west).
Boundaries with high consensus included the three major parks, with consensus ranging from 88⋅46% (Hyde Park) to 95⋅38% (Regent's Park), and district boundaries for Mayfair and Soho above 90%, Belgravia (88⋅46%), the northern parts of the Congestion Charge Zone between Victoria Street and Commercial Street (85⋅71%) and the southern boundary along the river for the City of London (80⋅77%).
Increased consensus was found for the two districts of South Bank (67⋅69%) and Whitehall (63⋅08%). All linear boundaries (the continuation of Edgware Road northbound, the division of Hammersmith and Kensington, the Westway and Nine Elms) and the River Thames ranged between 69⋅23% at the higher end and 61⋅54% at the lower end.
Fuzzy boundaries with low consensus (<50%) were below 45% of agreement. These areas included Nine Elms, Leicester Square, the remaining part of the Congestion Charge Zone as well as the City of London, and all other remaining boundaries from the complete overlaid mapping.
A comparison of mean agreement rates of districts with a near rectangular shape and districts of irregular shape was carried out (Figure 4d). Here, Soho, Mayfair, Belgravia and Whitehall were classified as districts with an almost rectangular outline, whereas Southbank, Leicester Square, Nine Elms and the City of London were contained in the group of irregular shaped districts. Not included in this comparison were the major parks, as these were conceptually different due to their green space character from the surrounding urban environment, the Congestion Charge Zone due its dual shape (near rectangular in west and north, but round in the east and south), as well as other linear boundaries. Mean agreement rates were significantly higher (t(6) = 3⋅1, p < 0⋅05) for almost rectangular districts (M = 86, SD = 16) than for irregular districts (M = 39, SD = 25).
3.4 Perceived boundaries and expected boundaries
The impact of culturally defined boundaries for districts was studied by comparing the list of expected boundaries with the boundaries that showed high or increased consensus (Figure 5). This comparison indicates an overlap for Hyde Park, Regent's Park, Mayfair, Soho, the Westway, the extension of Edgware Road towards the north, and the River Thames. A partial match was obtained for Battersea Park (except for the Prince of Wales Drive), Belgravia (except the boundary between Sloane Square and Grosvenor Place), South Bank (except for the extension along the River Thames), the riverside area of Whitehall, the riverside boundary of the City of London and the northern boundaries of the Congestion Charge Zone. Deviations were found for the boundary between Hammersmith and Kensington (streets parallel to the train tracks) and Nine Elms (Nine Elms Lane). The area of Leicester Square and the majority of the City of London, as well as the southern part of the Congestion Charge Zone, had low or hardly any overlap with expected boundaries due to low agreement across the drivers.
Comparison of expected and perceived boundaries. The agreement rate on drawn boundaries that surpassed 50% across taxi drivers was used to highlight above-average agreement on perceived boundary streets. Yellow: agreement across drivers above average. White: Expected boundaries, that did not surpass average agreement level (50%). Map source: © Mapbox, © OpenStreetMap

4. Discussion
To study if humans mentally segregate an environment through geographical boundaries related to the street network, data were collected from boundaries drawn on maps by London taxi drivers. Taxi drivers were chosen because they are trained on the ‘Knowledge of London’ (e.g. TFL (n.d.)), which requires them to learn the entire London street network in order to navigate flexibly between places without consulting additional navigation aids (see Griesbauer et al., Reference Griesbauer, Manley, Wiener and Spiers2021). Years of training and extensive experience driving a taxi ensure exceptional familiarity within streets and districts in the six-mile area around Charing Cross station (e.g. TFL (n.d.)) and allows for testing of perceptual street network boundaries of districts and regions that the general population would not be able to display. Based on this extensive knowledge, data from boundary drawings on maps provided initial insight into the mental representation and a potential segregation of a complex urban space. Results highlight in particular how mental representations of spatial features can vary between individuals and that often clearly defined boundary features based on historical records and legislation might not be perceived as such mentally. In the following, these results will be considered in the light of general, geographical and behavioural findings.
4.1 Conceptual limitations
It would have been useful to test both male and female taxi drivers of a wide range of experience and age. Both age and gender have been shown to affect navigation (Malinowski and Gillespie, Reference Malinowski and Gillespie2001; Coluccia and Louse, Reference Coluccia and Louse2004; Coutrot et al., Reference Coutrot, Silva, Manley, de Cothi, Sami, Bohbot, Wiener, Hölscher, Dalton, Hornberger and Spiers2018; van der Ham and Claessen, Reference van der Ham and Claessen2020). However, it would be difficult to recruit such a diverse participant group as 98% of drivers are male with an average age of 50 years (GOV.UK, 2020). This limited what was possible for data collection. Nonetheless, due to the extensive experience required to train as a London taxi driver and the continual updating as part of the job, the authors anticipate that the results would be similar across genders and a range of ages.
4.2 General observations
In this study, mental representations of street network-related boundaries were assessed through boundary drawings on paper maps by taxi drivers. An overlay of these drawings (Figure 3) indicated areas with highly agreed boundaries, such as Mayfair or Soho, as well as areas with hardly any agreement on one particular boundary, such as Leicester Square and the City of London. Agreement rates on whether a street was a boundary or not varied even for the series of streets that enclosed individual regions (e.g. South Bank) or formed linearly separating boundaries (e.g. Westway to City Road). However, real-world spatial boundaries that stem from geographical features or serve a conceptual purpose (e.g. Lynch, Reference Lynch1960) in general often rely on precise definitions. In this study, there is evidence that even such obvious geographical features do not always reflect on a perceptual level the clarity with which they are defined. For instance, the River Thames only minimally exceeded the agreement rate threshold required to be categorically considered as a boundary in this study (see Table 2). Such a discrepancy between geographical or conceptual definitions and perception might pose a problem for many spatial studies on navigation as they might wrongly assume a clear perception of boundaries where disagreement of boundaries might prevail. Additionally, the low agreement rates for the River Thames might also be explained through conceptual differences between street network boundaries and geographical features that form boundaries in themselves. For the purpose of this study, boundaries were defined as specific streets of the street network that segregate particular areas or districts from each other and could be used for route planning purposes. In contrast, other definitions of boundaries (e.g. Lynch, Reference Lynch1960) regarding survey knowledge of individuals also involve geographical features, such as waterways, railway lines or concrete barriers that similarly separate areas, but are not necessarily used for travelling purposes. The River Thames would thus fall under the latter definition and not entirely be in line with the current definition of a street network boundary that can be travelled on. However, it was included as a prominent boundary that indirectly affects the street network, as it separates South London from the rest of London, with connections via bridges – special and often prominent forms of street network features. Thus, studies on navigation in a real-world environment will have to take into account how such discrepancies in perceptual spatial boundaries can affect human navigation.
It is challenging in this context to identify and predict which spatial features ultimately qualify as boundaries with a high agreement and which do not. In general, perceived street network boundaries, in contrast to their administrative or geographical definition, show a range of deviations and inconsistencies in which streets are perceived as boundaries by individuals. Entire agreement on one particular street was rarely given. Instead, the perception of boundaries was best described through agreement rates rather than a binary classification into ‘boundaries’ and ‘non-boundaries’, due to these inconsistencies in perception. Still, to allow for categorical references, low (<50%), increased (>50%) and high (>80%) agreement rates were used to classify different levels of agreement. These only aimed to explore general tendencies to gain an initial understanding of prominent boundaries in the London street network and contribute to a potential segregation of the environment. Even though the collected data is preliminary, it already highlights interesting tendencies that can be used for subsequent studies to test if districts and regions are bound by boundaries or if boundaries divide areas from one another as discussed in the following.
Initial expectations of potential perceptual boundaries were based on geographical features, such as parks or the River Thames, as well as prominent, topically distinct districts, such as Soho or Mayfair that are enclosed by a regular street network structure (see also Table 1). These expectations were met in general as street network boundaries for the three major parks, the River Thames, several districts (e.g. Soho, Mayfair and Belgravia) and areas (e.g. Congestion Charge Zone north of the river), as well as some linearly separating boundaries (e.g. Westway, Edgeware Road northern extension) were identified. Other areas, such as the City of London, Leicester Square, Nine Elms or the Congestion Charge Zone south of the River Thames, were not found to have perceptual street network-related boundaries despite their popularity or topical distinctness. Here, additional factors influence whether spatial features are mentally perceived as boundaries or not. These factors go beyond geographical features, popularity or a distinct purpose alone for which the districts and areas were initially chosen, as several of these proposed boundaries of the districts were not considered as boundaries by taxi drivers. Additionally, relevant factors also include the geometric shape of the surrounding street network (i.e. linear streets and rectangular layout), put an emphasis on main roads, and require familiarity or experience with the areas, such as frequent visits and travelling around those areas.
Popularity and topical distinctness alone are not sufficient for such a perception, as the areas of Leicester Square or the City of London show. The regularity of the street network, i.e., long straight streets, or near rectangular structure of districts seems to play an important role as well. Streets that are linearly linked to separate areas (e.g. Westway, Marylebone Rd, Euston Rd, Pentonville Rd, City Rd, Old St) or enclose areas in an almost rectangular shape (e.g. Soho and Mayfair) are more likely to be perceived as boundaries than non-linear roads (e.g. Charing Cross Rd in the east of Leicester Square) or irregularly shaped boundaries, such as the boundaries of the City of London.
Perceived boundaries also coincide with main roads (see Figure 2), increasing the likelihood of a boundary being an important street network connection between places. Streets that are not main roads, but administrative boundaries, such as the northern outline of the City of London, were less likely to be perceived as boundaries in this study. Furthermore, not all major roads are perceptual boundaries, despite evidence from Parisian taxi drivers (Pailhous, Reference Pailhous1969). However, degrees of perception of the main road network that highlight which main roads are perceived as boundaries of the network features were not studied. In this context, spatial analysis of street network properties, as through space syntax (Hillier, Reference Hillier2007), could provide important insight into how centrality measures affect mental representations of spaces and should be considered for future research, in particular, into how this might affect neural representations of city street networks (Javadi et al., Reference Javadi, Emo, Howard, Zisch, Yu, Knight, Silva and Spiers2017).
Additionally, distance to the centre of London also seems to have an effect on agreement rates. Districts with high agreement rates, including Soho, Mayfair and Belgravia, were located centrally, within or near the Congestion Charge Zone, which is also a more prominent boundary north of the River Thames than south (see Figure 4). Increased agreement rates were found for partial boundaries of the central London districts of Whitehall and South Bank along the River Thames. South of the River Thames, Nine Elms and the southern boundaries of the Congestion Charge Zone, despite being straight and regular, had low agreement rates. However, in this context, tightly linked to proximity is the taxi drivers’ familiarity with central London areas. As the drivers’ reported areas of preference were in West and Central London, which are areas where boundary agreement rates were at an increased or high level, their familiarity with areas south of the River Thames might be limited and affect their boundary perceptions and agreement rates in those areas.
Interestingly the River Thames, a prominent geographical landmark running through London, was not identified as a boundary with high agreement rates. Contrary to this expectation, only about 62% of drivers perceived it as a structure separating South London from the rest of the city, rendering it categorically a boundary with one of the lowest agreement rates that surpassed the 50% agreement level. However, the River Thames seems to be special in this context, as for districts and regions taxi drivers were expected to indicate bounding streets, but for the Thames it was the river itself, rather than streets, that was expected to have a boundary effect. This conceptual difference between street network and survey boundaries might have affected responses. Support for this effect could be indications of the riverside boundary of the City of London that runs along the river. Furthermore, it can be argued that the River Thames itself does not necessarily separate prominent, confined and topically distinct areas, as do the boundaries of Soho. Instead, on a larger scale, districts along the river might fade into each other or even span across the river as touristic areas of Central London not only include areas north of the River Thames, but also stretch from Waterloo along South Bank to Tower Bridge at the southern back of the River Thames. Such a general perception of large-scale areas (i.e. when considering the global environment) might interfere and explain deviations from the perception, when studying differences across conceptually different areas and their boundaries on a smaller, more locally perceived scale (i.e. specific districts and areas).
Finally, it is interesting to note that few taxi drivers indicated additional features that they would perceive as boundaries in this context. Where they did, the streets judged as boundaries were not agreed on by other drivers (e.g. Camden, King's Cross and Greenwich). These regions, similar to the City of London and other areas with diffused boundaries across the street network, were only perceived on an individual level. This result suggests that the approach of prompting the drivers with specific options was a useful approach to explore taxi drivers’ explicit awareness of boundaries when they consider London. Nonetheless, it is acknowledged that, had they been asked to note on a map of London any boundaries they considered important, they may have produced a different set of results, and it would be useful in future research to explore this.
In summary, a variety of factors affect whether streets are perceived as boundaries of districts by taxi drivers. It is likely that the effect of familiarity and the extent to which taxi drivers travel in certain districts and areas might have an obvious contribution to such a perception. Areas that are travelled frequently might be better mentally represented for recall and thus perceived to have more pronounced boundaries than other, less frequently travelled districts where memory about boundaries might be less salient, such as south of the River Thames, where there was less agreement on the boundary of the Congestion Charge Zone. Additionally, geometric effects, such as linear streets and a rectangular surrounding street network, as well as the main road character expressed through wide, busy and important streets, might contribute to the salience of such a representation. In particular, the geometric effect of boundaries seems to have a big impact, as high boundary agreements for Soho, Mayfair and Belgravia and low agreement for the irregularly shaped districts of the City of London or Leicester Square show (e.g. Milgram, Reference Milgram, Proshansky, Ittelson and Rivlin1976; Tversky, Reference Tversky1981; Costa and Bonetti, Reference Costa and Bonetti2018). Taken together, it is thus possible that a combined effect of all these factors might explain general tendencies and discrepancies across areas. For instance, even though the City of London possesses specific, historically developed boundaries and is often visited by taxi drivers, the lack of a regular and linear outline of the district in the north and the use of predominantly minor roads might explain why agreement rates were low in this case. In contrast, the boundary between Hammersmith and Kensington, the Westway and Nine Elms, even though linear in their outline, were less agreed on, possibly because they are further from Central London and taxi drivers were less familiar with those areas. In general, it is possible that a combination of these factors can better explain why some boundaries are more likely perceived as such than others.
4.3 Boundaries and urban geography
From a geographical point of view, these findings are also in line with previous approaches that studied, for instance, how individuals mentally represented cities through paths, edges, districts, nodes and landmarks (Lynch, Reference Lynch1960). In his studies, Lynch (Reference Lynch1960) highlighted several properties of streets, such as width, distinctiveness, continuity, directionality or importance in terms of being a major path, that were central for its identification and can also be attributed to boundary properties, such as linearity or almost rectangularity, topical segregation of distinct areas, or high likelihood of being a major road. Similarly, edges, defined by Lynch (Reference Lynch1960) as boundaries between different types of areas, such as waterways, were found to be important spatial features of the mental representation of individuals. Parallels can be drawn between edges in Lynch's study (Reference Lynch1960) and the street network boundaries of parks, or the River Thames itself. Additionally, Lynch (Reference Lynch1960) also points out a gradual change of path properties along a path that also cause a gradual change in its perception. Changes in boundary agreement along linear sequences of boundary streets could also relate back to such a topological gradient along those boundaries.
Retrospectively seen, previous approaches of segregating an urban environment based on street network properties (e.g. Filomena et al., Reference Filomena, Verstegen and Manley2019) have not matched the perceptual findings of this study and are not reflective of how humans ultimately perceive their environment. These approaches seem too fine-grained for human perception and do not include additional perceptual or conceptual factors such as popularity, topical distinctness or regularity of the street network that were found to drive human perception. More important factors include whether streets can be classified as main roads (Pailhous, Reference Pailhous1969). While almost all boundary roads were main roads, there were many main roads that were not perceived as boundary roads (see Figure 1). Since main roads are often important arteries and overlap with critical streets (cf. Palominos and Smith, Reference Palominos and Smith2020) of the street network, spatial analysis as through space syntax is a method for analysing the spatial layout of environments in relation to peoples movement and use of the space (Hillier, Reference Hillier2007), could provide further insight in terms of spatial properties and should be included in future analysis.
4.4 Boundaries and behavioural science
The finding that boundaries were more likely to emerge around prominent, topically distinct areas, surrounded by main roads with a regular, linear shape, seems to be in line with findings on distortion effects of mental representations of space (e.g. Milgram, Reference Milgram, Proshansky, Ittelson and Rivlin1976; Stevens and Coupe, Reference Stevens and Coupe1978; Tversky, Reference Tversky1981, Reference Tversky1992; Bomba and Siqueland, Reference Bomba and Siqueland1983; Okabayashi and Glynn, Reference Okabayashi and Glynn1984; Costa and Bonetti, Reference Costa and Bonetti2018). In particular, geographical shapes of irregular borders are often simplified and represented as straight lines (Milgram, Reference Milgram, Proshansky, Ittelson and Rivlin1976; Tversky, Reference Tversky1981) and angular irregularities in the street network are often aligned in a parallel, grid-like shape (e.g. Byrne, Reference Byrne1979). Such tendencies towards simplification might ultimately also determine which spatial features are more likely to be remembered (Lynch, Reference Lynch1960) and thus recalled and identified as potential boundaries.
In contrast to the spatial boundaries as defined in this or other studies (e.g. Lynch, Reference Lynch1960), spatial boundaries have been studied in wider terms as well. Turns (Brunec et al., Reference Brunec, Javadi, Zisch and Spiers2017, Reference Brunec, Ozubko, Ander, Guo, Moscovitch and Barense2020) or doorways in an indoor setting (Horner et al., Reference Horner, Bisby, Wang, Bogus and Burgess2016; Robinson, Reference Robinson2020) seem to form a mental barrier that affected spatial memory. While doorways, similar to the current study, establish a spatial boundary that separates two distinct spaces (i.e. rooms), they are more obvious features than streets that segregate a complex outdoor environment based on its topical distinctness. Turns, in contrast, are less obvious boundaries and do not fit the concept of spatial boundaries as assumed in this study. Instead of marking spatial places where spatial regions differ, turns as studied by Brunec et al. (Reference Brunec, Ozubko, Ander, Guo, Moscovitch and Barense2020) mark a particular event in a route that leads to a segmentation of a mental representation and thus affects spatial memory recall.
Other studies that relied on spatial segmentation or hierarchical representations of the environment (e.g. Wiener et al., Reference Wiener, Schnee and Mallot2004; Büchner et al., Reference Büchner, Hölscher and Strube2007; Wiener and Mallot, Reference Wiener and Mallot2009; Balaguer et al., Reference Balaguer, Spiers, Hassabis and Summerfield2016; Schick et al., Reference Schick, Halfmann, Hardiess, Hamm and Mallot2019) created those artificially through themed areas, such as visually cued areas (Wiener et al., Reference Wiener, Schnee and Mallot2004; Wiener and Mallot, Reference Wiener and Mallot2009) and language cues (Schick et al., Reference Schick, Halfmann, Hardiess, Hamm and Mallot2019). Here, boundaries were not explicitly studied or perceptible, but were implicitly included as transitions between areas occurred. However, in real-world navigation, boundary streets can affect how individuals make use of their mental representations to travel in an environment. This understanding might allow for novel ways of studying navigation in the future. For instance, when planning routes between places in a city, boundary streets, which might be more saliently represented in memory, might be recalled more often, faster or with less errors. Thus, route planning and wayfinding can be affected by such features and are thus important to be considered. Such considerations might be useful in the development of improved navigation guidance. For example, if salient boundaries that would likely be useful to expert navigators are visually marked or identified in some way during the exposure to a new route, this may aid the better memory for the regions of space navigated and better planning on a novel route.
Finally, from a behavioural perspective it might be interesting to explore whether learning these boundaries should be included where spatial learning is carried out, and particularly in the training of London taxi drivers. Learning these boundaries might facilitate such a representation and help better structure spatial information in some areas, where they are perceived, but it will not be sufficient to understand the entire street network. Areas with low agreement on boundaries or no boundaries are not necessarily poorly represented or more complex. For instance, there was low or no agreement on the boundaries of Leicester Square, an area in Central London that taxi drivers are familiar with and visit frequently. There are also no boundaries in areas north of Mayfair and Soho, where the street network is regular and complexity very low. Additionally, there are large areas in the north, west and south of Hyde Park with no boundaries, but areas of regular (e.g. Brompton in Chelsea, Holland Park) and irregular (e.g. South Kensington, Notting Hill/Westbourne Green) street network. Such potential variation in street network complexity is captured in the training material of student taxi drivers, but not in the boundary representation. Here, future work to explore the connections between learning and a potential boundary representation would be useful.
5. Conclusion
The current study identified several features of the environment that may make them a boundary for experts navigating in the street network. These boundary features were identified by examining agreement rates across the streets identified by London taxi drivers. Areas with perceived boundaries were found to share common properties: being prominent and distinct from their surrounding areas, and having a regular, linear or near rectangular outline. These findings will be useful for predicting when a new region of space or a new city region will be treated as a separate area with a boundary in a mental map for navigation.
Acknowledgements
The authors thank Melda Salhab for digitising the boundary mappings and Gabriele Filomena for his permission to include his computational clustering of central London districts based on street network properties (Figure 1c). This project was also supported by Ordnance Survey, UK and an EPSRC CASE studentship to Eva-Maria Griesbauer.