INTRODUCTION
Tropical regions are the most deforested and fragmented regions of the world (FAO 2012). Many tropical species exist only as small fragmented populations (Turner Reference TURNER1996). The remaining trees survive in forest fragments with reduced effective population size, and disruptions to ecological and genetic processes (Aguilar et al. Reference AGUILAR, ASHWORTH, GALETTO and AIZEN2006, Vranckx et al. Reference VRANCKX, JACQUEMYN, MUYS and HONNAY2012). For example, fragmentation is expected to increase spatial genetic structure (SGS), the non-random spatial distribution of genotypes in a population, but the effects of fragmentation on gene flow and genetic structure remain highly debated (Bacles & Jump Reference BACLES and JUMP2011, Kramer et al. Reference KRAMER, ISON, ASHLEY and HOWE2008). Accordingly, examining the genetic effects of fragmentation on trees furthers our understanding of the ecological consequences of tropical forest fragmentation.
Spatial genetic structure is shaped by dispersal, distribution, natural selection and drift (Hamrick & Nason Reference HAMRICK, NASON, Rhodes, Chesser and Smith1996, Vekemans & Hardy Reference VEKEMANS and HARDY2004, Wright Reference WRIGHT1940). While seed dispersal and spatial distribution are the primary influences on SGS within a tree population (Fuchs & Hamrick Reference FUCHS and HAMRICK2010, Hamrick & Nason Reference HAMRICK, NASON, Rhodes, Chesser and Smith1996, Ismail et al. Reference ISMAIL, GHAZOUL, RAVIKANTH, KUSHALAPPA and KETTLE2012), demographic thinning due to density-dependent processes may weaken SGS (Hamrick et al. Reference HAMRICK, MURAWSKI and NASON1993). Specifically, survival may be higher for seeds dispersed away from parent trees and areas of high conspecific density (Connell Reference CONNELL, den Boer and Gradwell1971, Janzen Reference JANZEN1970), weakening SGS. Alternatively, young life stages may aggregate in specific microhabitats that enhance survival and strengthen SGS (Lan et al. Reference LAN, ZHU, CAO, HU, WANG, DENG, ZHOU, CUI, HUANG, HE, LIU, XU and SONG2009). Zhou & Chen (Reference ZHOU and CHEN2010) proposed two scenarios of SGS resulting from these selective forces. (1) Density-dependent processes will reduce the aggregation of seeds and young life stages and weaken SGS. (2) Seeds and young life stages will aggregate in microhabitats with favourable conditions for recruitment and growth, enhancing SGS.
Studies of SGS are improved by using a multiple life stage approach (Choo et al. Reference CHOO, JUENGER and SIMPSON2012, Fuchs & Hamrick Reference FUCHS and HAMRICK2010), and considering seed-dispersal patterns (Heuertz et al. Reference HEUERTZ, VEKEMANS, HAUSMAN, PALADA and HARDY2003). Comparing patterns of spatial distribution and SGS between different life stages allows us to better understand the influence of ecological and evolutionary factors that are shaping SGS (Aguinagalde et al. Reference AGUINAGALDE, HAMPE, MOHANTY, MARTÍN, DUMINIL and PETIT2005, Benard & McCauley Reference BENARD and MCCAULEY2008, Duminil et al. Reference DUMINIL, FINESCHI, HAMPE, JORDANO, SALVINI, VENDRAMIN and PETIT2007, Fuchs & Hamrick Reference FUCHS and HAMRICK2010, Zhou & Chen Reference ZHOU and CHEN2010). Younger life stages are more structured than older life stages when mating and dispersal shape SGS and demographic thinning occurs from density-dependent processes (Choo et al. Reference CHOO, JUENGER and SIMPSON2012, Fuchs & Hamrick Reference FUCHS and HAMRICK2010, Kalisz et al. Reference KALISZ, NASON, HANZAWA and TONSOR2001). Alternatively, if several younger individuals survive into older life stages, then SGS is expected to be relatively consistent over time if selection is minimal (Chung et al. Reference CHUNG, EPPERSON and CHUNG2003), though SGS may increase over time if there is selection on older life stages (Kalisz et al. Reference KALISZ, NASON, HANZAWA and TONSOR2001, Tonsor et al. Reference TONSOR, KALISZ, FISHER and HOLTSFORD1993).
In this study, our aim was to examine the effects of fragmentation on spatial genetic structure and compare patterns of distribution and SGS to understand better the ecological and evolutionary processes influencing the SGS of Manilkara maxima T.D Penn. (Sapotaceae). We hypothesized the SGS of the adult life stage would not be different among small and large forest fragments given the long lifespan of this species and the recent fragmentation of the study area. We hypothesized weaker SGS of saplings in small fragments compared with large fragments given the potential for long-distance gene flow. For both life stages, we hypothesized weak yet significant SGS, a pattern common for animal-dispersed neotropical tree species (Azevedo et al. Reference AZEVEDO, KANASHIRO, CIAMPI and GRATTAPAGLIA2007, Hardy et al. Reference HARDY, MAGGIA, BANDOU, BREYNE, CARON, CHEVALLIER, DOLIGEZ, DUTECH, KREMER, LATOUCHE-HALLÉ, TROISPOUX, VERON and DEGEN2006) and stronger SGS in saplings compared with adults indicating dispersal- and density-dependent processes shape the SGS of this species.
METHODS
Study species
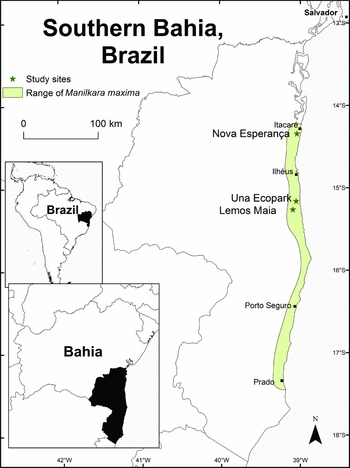
Manilkara maxima, a tree species that naturally occurs in low-density populations (Ganzhorn et al. Reference GANZHORN, PEREZ-SWEENEY, THOMAS, GAIOTTO and LEWIS2015), is endemic to the southern Bahia, Brazil (Jardim Reference JARDIM, Prado, Landau, Moura, Pinto, Fonseca and Alger2003, Pennington Reference PENNINGTON1990) region (Figure 1). This tree grows to 30 m in height with a diameter of 100 cm, and can be identified by the presence of latex, broad cuneiform leaves with abaxial, appressed, ferruginous indumentum, and solitary white flowers with six staminodes (Pennington Reference PENNINGTON1990). The genus Manilkara has a mating system which is predominately outcrossed by pollen vectors that include flies, bees, bats and primates, and has seed vectors that include birds, bats and primates (Azevedo et al. Reference AZEVEDO, KANASHIRO, CIAMPI and GRATTAPAGLIA2007, Pennington Reference PENNINGTON and Kubitzki2004).
Locations of study sites – green star symbols (Nova Esperança, Una Ecopark and Lemos Maia) and cities – black square symbols. The range of Manilkara maxima is shaded in light green.

Study area
The study was conducted at three sites in the southern Bahia region (Figure 1) of the Brazilian Atlantic forest biodiversity hotspot (Myers et al. Reference MYERS, MITTERMEIER, MITTERMEIER, DA FONSECA and KENT2000). Only 18% of the original forest remains in the southern Bahia region, and 95% of the remaining fragments are < 100 ha (Landau et al. Reference LANDAU, HIRSCH, MUSINSKY and Thomas2008, Ribeiro et al. Reference RIBEIRO, METZGER, MARTENSEN, PONZONI and HIROTA2009). Fragmentation of the study area occurred about 35 y before this study in the early 1970s (Mendonça et al. Reference MENDONÇA, CARVALHO, SILVA and THOMAS1994, Mori & Silva Reference MORI and SILVA1979). This region has an average temperature of 24°C, annual average relative humidity of 80–90%, and evenly distributed annual average precipitation of 2000 mm (Mori et al. Reference MORI, BOOM, CARVALHO and SANTOS1983, Rocha Reference ROCHA1976). The natural vegetation of the study area is classified as lowland tropical moist forest or, locally, tabuleiro forest (Thomas & Barbosa Reference THOMAS, BARBOSA and Thomas2008).
The three sites appeared to be well preserved, with a mature forest structure (a canopy c. 25 m tall and numerous large epiphytes and lianas) and a mean canopy cover of 94%. The Nova Esperança (NE) study site (Figure 1) is 200 ha of privately owned forest 50 km north of Ilhéus, Bahia, Brazil (14°20′31′′S, 39°02′33′′W). The Una Ecopark (UE) study site (Figure 1) is a 400-ha Private Natural Heritage Reserve owned and managed by the Institute for Social and Environmental Studies in Southern Bahia (IESB) located 45 km south of Ilhéus, Bahia, Brazil (15°10′04′′S, 39°03′07′′W). The Lemos Maia Experimental Station (LM) study site (Figure 1) is a 400-ha agricultural field station owned and managed by the Executive Cocoa Planting Commission (CEPLAC) located 52 km south of Ilhéus, Bahia, Brazil (15°15′5′′S, 39°05′34′′W). Much of the fragmentation in southern Bahia occurred in the early 1970s (Mendonça et al. Reference MENDONÇA, CARVALHO, SILVA and THOMAS1994) and many forests are remnants of this recent fragmentation. The station was established in 1975 (J. I. Lacerda, per. comm.), and is a mosaic of recently fragmented forests, surrounded by dirt roads, agricultural fields, regenerating forests and agroforests. We selected eight forest fragments from the small-forest-fragment site (LM): three 25-ha forests, two 10-ha forests and three 5-ha forests. Forest fragment distance to closest forest (large fragment > 100 ha) ranged 1.5–3.5 km and had a mean distance of 2.6 km. The distance among fragments ranged 0.2–1.6 km and had a mean distance of 0.5 km.
Sample collection
One 10-ha sampling area (250 × 400 m) was surveyed at each of the two large fragment sites (NE and UE) and at each of the 25-ha forests for the study species. The one 10-ha sampling area was used instead of smaller replicated plots to sample enough individuals at the large fragment sites (NE and UE), due to the low density and patchy distribution of this species. The entire area of the forest was surveyed for the study species at each of the two 10-ha forests and three 5-ha forests. We defined adult trees as plants > 1 cm dbh and saplings as plants ≤ 1 cm dbh and ≥ 20 cm height. Tropical trees ≤ 1 cm dbh are estimated to be < 20 y old (Hubbell Reference HUBBELL, Losos and Leigh2004, Welden et al. Reference WELDEN, HEWETT, HUBBELL and FOSTER1991). These life stages allow a conservative estimation of SGS of adults and saplings that were established before and after fragmentation respectively. In total, we mapped and sampled 222 trees from the three study sites (NE, N = 60; UE, N = 54; and LM, N = 108). Density was calculated as N (number of individuals per sample area). Cambium and leaf material were collected and placed in resealable plastic bags with 50–60 g of self-indicating silica gel (Chase & Hills Reference CHASE and HILLS1991, Colpaert et al. Reference COLPAERT, CAVERS, BANDOU, CARON, GHEYSEN and LOWE2005).
Genetic analysis
Genomic DNA was extracted from cambium and leaves of M. maxima using the DNeasy™ Plant Mini Kit (Qiagen, Valencia, CA, USA). The DNeasy™ extraction protocol was followed with the addition of 2% PVP- 40 (polyvinyl-pyrrolidone) to the lysis buffer.
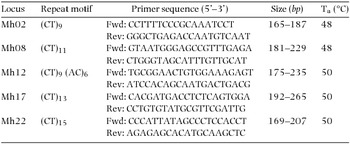
The five microsatellite loci used in this study (Table 1) were selected from those developed for the congener Manilkara huberi Ducke (Azevedo et al. Reference AZEVEDO, VINSON and CIAMPI2005). Details of the reagents used for the PCR reactions can be found in Ganzhorn et al. (Reference GANZHORN, PEREZ-SWEENEY, THOMAS, GAIOTTO and LEWIS2015). The PCR amplifications were carried out on an Eppendorf Mastercycler Pro S thermocycler (Eppendorf North America, Haupauge, NY, USA) with the following conditions: 95°C for 2.5 min, 10 cycles at 95°C for 30 s, locus-specific annealing temperatures (Table 1), 64°C extension for 1 min, and then 30 cycles at 88°C for 30 s, locus-specific annealing temperatures (Table 1) and 64°C extension for 1 min. After 40 cycles, a final extension at 64°C for 10 min was used. The PCR products were sized with a Beckman Coulter CEQ 8800 sequencer using the Beckman Coulter DNA Size Standard Kit – 400 and running the software package CEQ 8800 Genetic Analysis System version 9.0 (Beckman Coulter, Fullerton, CA, USA). Allele sizes were estimated using the GeneMarker Software V.1.90 (SoftGenetics, State College, PA, USA).
Five microsatellite loci characteristics for 222 individuals of Manilkara maxima: locus identifications; repeat motif; oligonucleotide primer sequences; fragment sizes (bp); annealing temperatures (Ta) °C.

Genetic diversity
Null alleles, stuttering and allelic drop out were tested with Micro-Checker V2.2.3 (Van Oosterhout et al. Reference VAN OOSTERHOUT, HUTCHINSON, WILLS and SHIPLEY2004). Errors due to stuttering or allelic drop out were not detected, but null alleles were found across all loci ranging in frequencies of 7%–16%. Null alleles were corrected using the Brookfield method in Micro-Checker V2.2.3 (Brookfield Reference BROOKFIELD1996, Van Oosterhout et al. Reference VAN OOSTERHOUT, WEETMAN and HUTCHINSON2006) and used for the genetic analyses. Data with corrected null alleles and uncorrected null alleles provided similar results. Deviation from Hardy–Weinberg Equilibrium (HWE) was examined with an exact test using the Markov chain (Guo & Thompson Reference GUO and THOMPSON1992, Levene Reference LEVENE1949) and linkage disequilibrium was assessed with a likelihood ratio test (Excoffier & Slatkin Reference EXCOFFIER and SLATKIN1998) in Arlequin V3.5 (Excoffier et al. Reference EXCOFFIER, LAVAL and SCHNEIDER2005). Genetic diversity indices were estimated for both life stages at the study sites using GenAlEx V6.4 (Peakall & Smouse Reference PEAKALL and SMOUSE2006) for the number of alleles per locus (A), private alleles (PA), observed heterozygosity (HO) and expected heterozygosity (HE), and using Arlequin V3.5 (Excoffier et al. Reference EXCOFFIER, LAVAL and SCHNEIDER2005) for the inbreeding coefficient (FIS). The private allele method (Barton & Slatkin Reference BARTON and SLATKIN1986) was used to estimate the effective number of migrants per generation (Nm) using GENEPOP V4.2 (Raymond & Rousset Reference RAYMOND and ROUSSET1995, Rousset Reference ROUSSET2008).
Spatial genetic structure
Mean pairwise FST calculated as FST/ (1-FST) (Rousset Reference ROUSSET1997) were estimated for each sampling area and an analysis of molecular variance (AMOVA) was performed using Alrlequin V3.5 (Excoffier et al. Reference EXCOFFIER, LAVAL and SCHNEIDER2005). A Mantel test was used to examine if isolation by distance was present at the landscape scale using correlation analysis between genetic distance (pairwise FST) and geographic distance (Mantel Reference MANTEL1967). The analysis was performed with 10000 permutations using zt software (Bonnet & Van de Peer 2002).
Spatial genetic structure of adults and saplings at each site was examined using autocorrelation analysis between all pairs of individuals at each distance class. The samples from the seven fragments at the LM site were pooled to ensure sufficient number of pairwise comparisons at each distance class. Seven distance classes were chosen to ensure the maximum number of pairs at each distance class was obtained (mean pairs/distance class = 62): within the first 100 m, four intervals of 25 m; between 100 and 200 m two 50-m intervals; and between 200 and 300 m one 100-m interval. The multilocus relatedness coefficient (r) was estimated for all individuals within a life stage for each distance class with GenAlEx 6.41 (Peakall & Smouse Reference PEAKALL and SMOUSE2006). Positive r values indicate that pairs of individuals at a specific distance class share more alleles than expected by chance (Peakall & Smouse Reference PEAKALL and SMOUSE2006). Statistical significance of the autocorrelation is tested by comparing the r value with 95% confidence intervals (CI) with the null hypothesis of no SGS (Peakall & Smouse Reference PEAKALL and SMOUSE2006). The 95% CI were generated by randomly permuting individuals among geographic locations (10000 permutations). Correlograms were created for adults and saplings at each study site. To test for overall significance of the correlograms and differences across sites, life stages and distance classes a non-parametric heterogeneity analysis (Smouse et al. Reference SMOUSE, PEAKALL and GONZALES2008) was performed in GenAlEx 6.41 (Peakall & Smouse Reference PEAKALL and SMOUSE2006). The heterogeneity multiclass statistic ω tests the overall significance of the correlogram and heterogeneity among correlograms (Smouse et al. Reference SMOUSE, PEAKALL and GONZALES2008). Comparisons of correlograms at individual distance classes were completed using the single-class test statistic t2 (Smouse et al. Reference SMOUSE, PEAKALL and GONZALES2008). Additionally, SGS was estimated for both life stages at each site using the statistic Sp (Vekemans & Hardy Reference VEKEMANS and HARDY2004) to allow for comparison across other studies. The regression slope of pairwise kinship coefficients and the logarithm of distance between individuals are used to calculate Sp described by Vekemans & Hardy (Reference VEKEMANS and HARDY2004). We used the kinship coefficient (F) (Loiselle et al. Reference LOISELLE, SORK, NASON and GRAHAM1995). The Sp statistic was calculated using SPAGeDI 1.4 (Hardy & Vekemans Reference HARDY and VEKEMANS2002) as Sp = −bf /(1−F(1)), where −bf is the regression slope of the kinship coefficient and logarithm of distance, and F(1) is the mean kinship coefficient between individuals as described by Vekemans & Hardy (Reference VEKEMANS and HARDY2004). The significance of the slope was estimated by comparing the observed value with randomly permuting individuals among geographic locations (10000 permutations).
Additionally, the locations of the saplings and adults trees were used to examine distribution patterns. A nearest-neighbour analysis was performed using Point Pattern Analysis (PPA) program (San Diego State University, San Diego, CA, USA). This analysis uses a Z statistic to indicate the type of spatial clustering among individuals. A negative Z value indicates clustering and a positive value indicates even dispersal patterns. Higher absolute values indicate greater clustering or more dispersed spatial patterns.
RESULTS
Genetic diversity
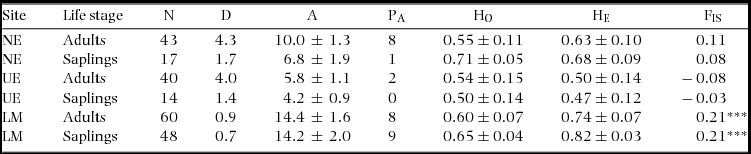
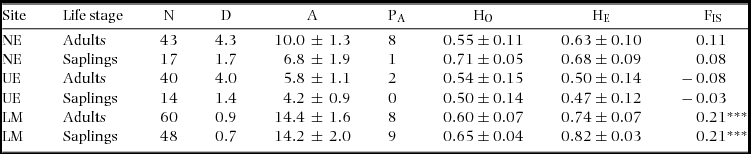
The five loci exhibited significant departure from Hardy–Weinberg equilibrium, but no pairs of loci had significant linkage disequilibrium. A total of 222 individuals were analysed across the two life stages within the study sites. An overview of the genetic diversity indices is given in Table 2. The large number of alleles was similar to those found in two other congeners (Azevedo et al. Reference AZEVEDO, VINSON and CIAMPI2005, Moraes et al. Reference MORAES, VIVAS, OLIVEIRA, MENEZES, BERG and GAIOTTO2013), demonstrating the informative value of our five loci. Allelic diversity was generally higher in the adult life stage, and both adults and saplings at the LM study site exhibited significant inbreeding (Table 2). However, no significant differences were found for the genetic diversity indices between adults and saplings or among the study sites.
Population and genetic diversity estimates for Manilkara maxima at three sites, Nova Esperança (NE), Una Ecopark (UE) and Lemos Maia (LM) near Ilhéus, Bahia, Brazil: sample size (N); density (stems ha−1) (D); average alleles per locus (A); private alleles (PA); average expected heterozygosity (HE); and average inbreeding coefficient (FIS). * P < 0.05, ** P < 0.01, *** P < 0.001.
Spatial genetic structure and gene flow
At the landscape scale, the Mantel test indicated the genetic structure of M. maxima was not shaped by isolation by distance (r = 0.205, P = 0.156). The hierarchical analysis of molecular variance (AMOVA) revealed most of the genetic diversity was found within the study sites (92.1%, P < 0.001). Only 7.87% (P < 0.001) of the genetic variation was partitioned among the three study sites. All populations exhibited significant SGS based upon the Sp statistic, with a mean SGS of Sp = 0.0198 across sampled individuals. The effective number of migrants per generation (Nm) for both life stages across the three study sites was Nm = 6.49 after correction for sample size and was estimated using the 28 private alleles (Table 2).
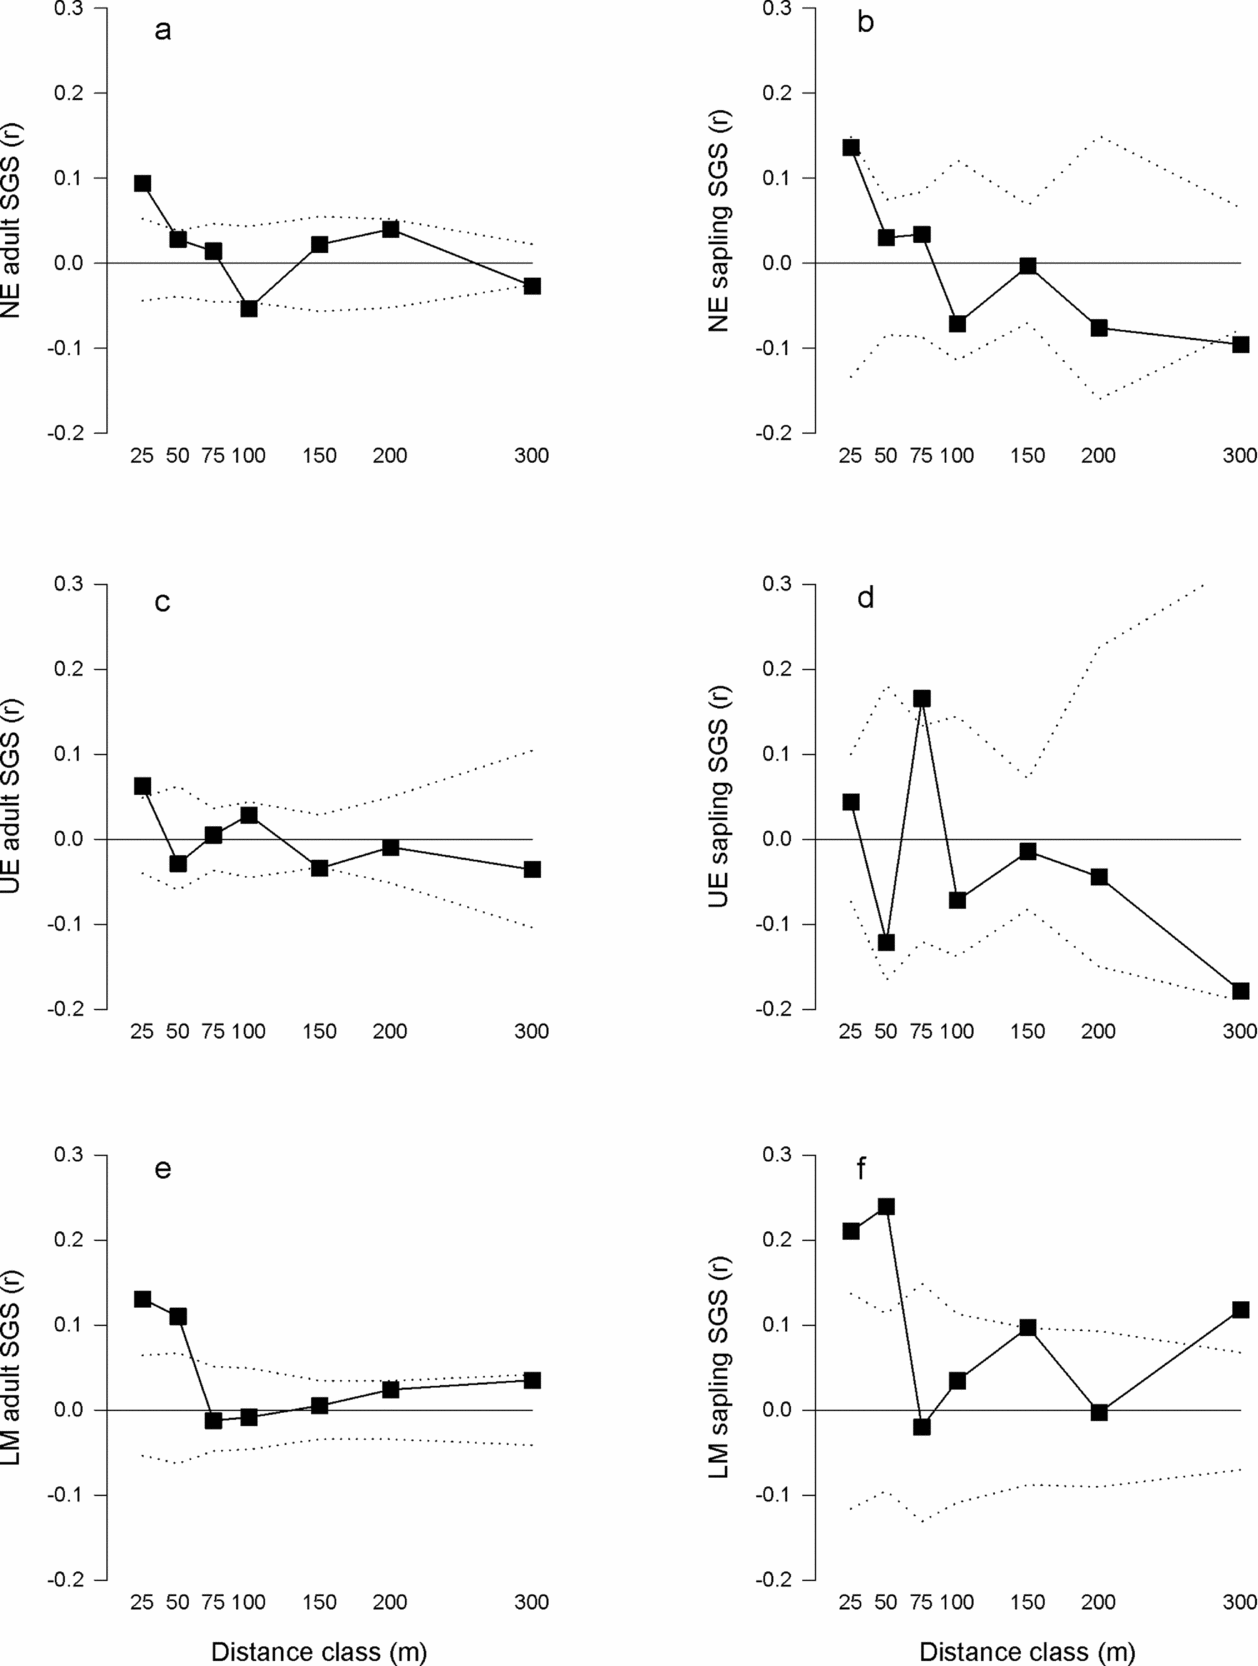
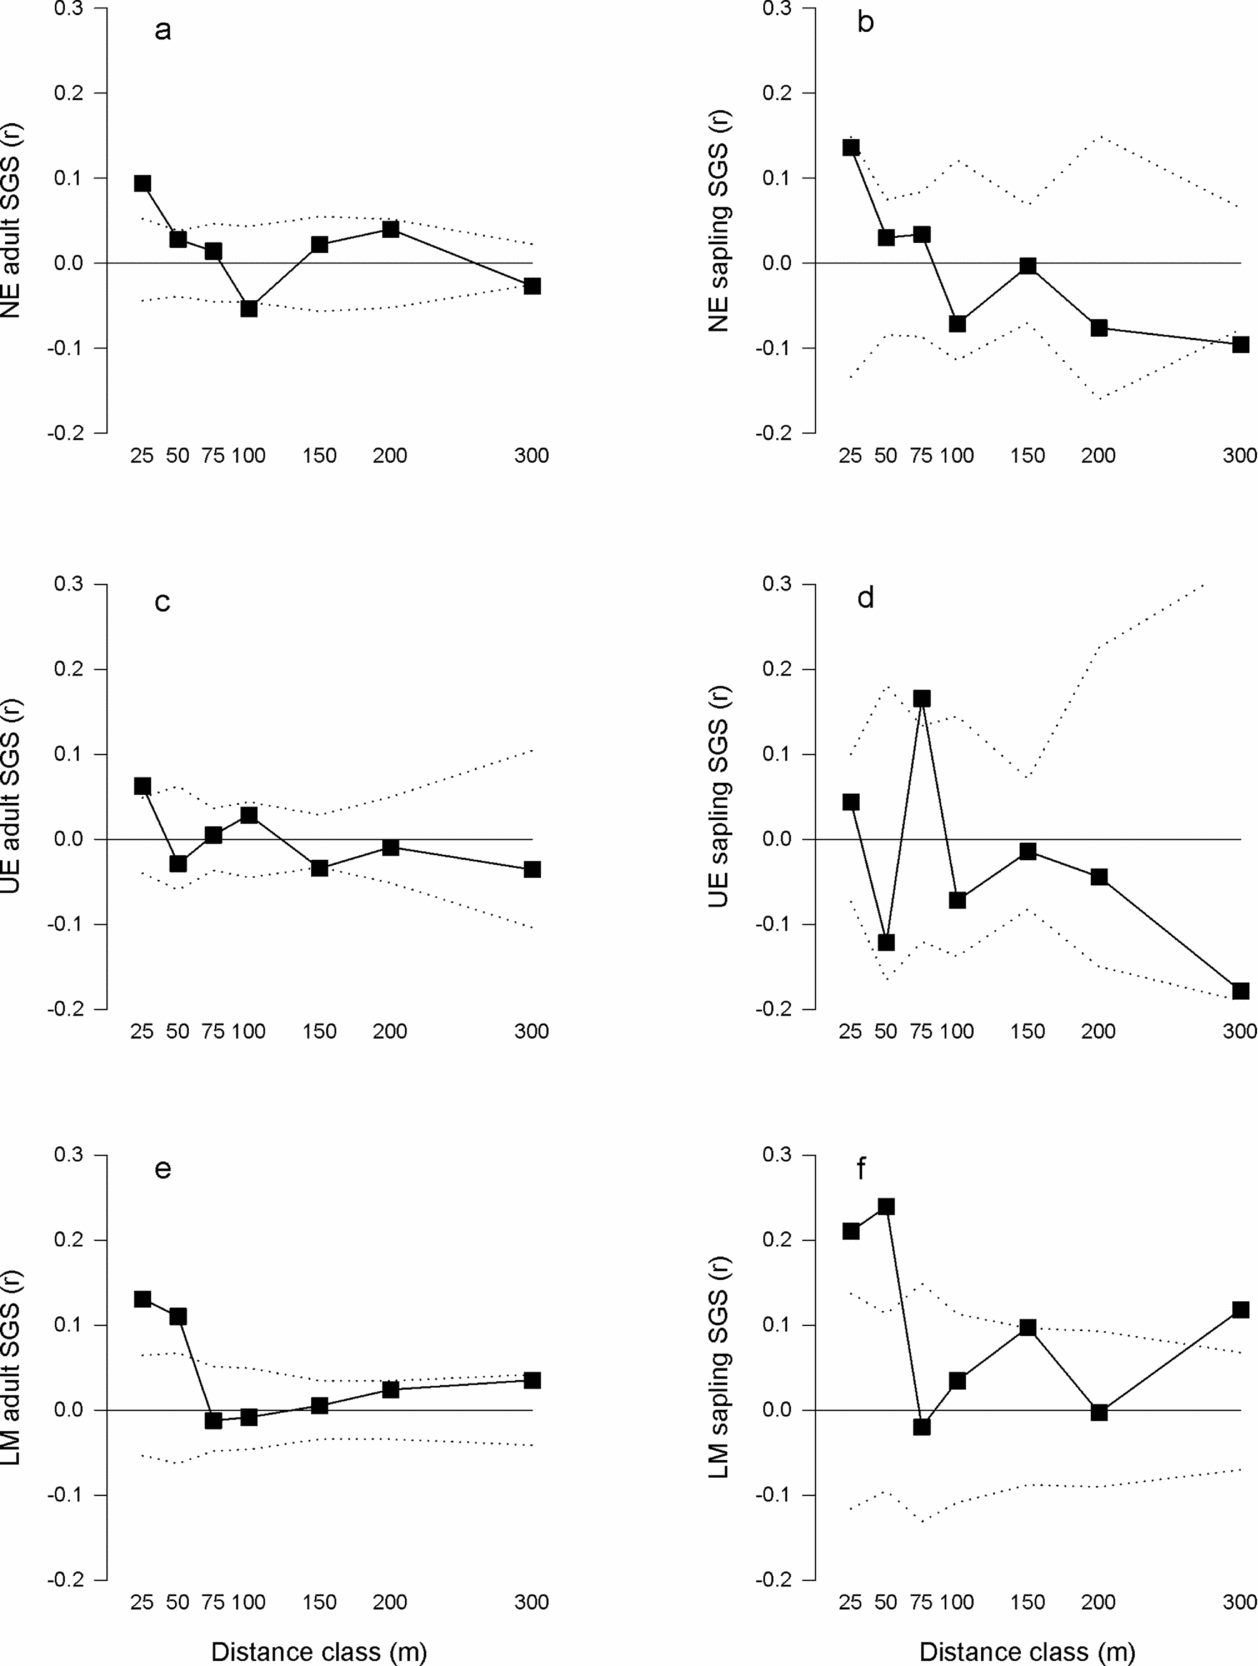
Among the three study sites, the adult SGS multiclass test (ω) indicated the correlograms (Figure 2a, c, e) were significantly different (ω = 21.5, P = 0.037). The LM site significantly differed from the UE (ω = 25.7, P = 0.029), but not NE (ω = 19.3, P = 0.152) and the UE and NE sites were not significantly different (ω = 19.5, P = 0.146). Significant SGS multiclass tests (i.e. correlograms were significantly different from the null hypothesis of no SGS) and significant Sp statistics (Table 3) were observed for the adult trees at each site (NE: ω = 47.0, P = 0.001, Sp = 0.018, P = 0.001; UE ω = 32.4, P = 0.011, Sp = 0.013, P = 0.011; LM ω = 48.6, P = 0.001, Sp = 0.014, P = 0.001). Adults at each of the three study sites exhibited significant positive genetic correlations at the distance class ≤ 25 m (Figure 2a, c, e, Table 3). Additionally, adults at the LM site had significant positive genetic correlations at the 50-m and 300-m distance classes (Figure 2e, Table 3). In contrast, significant negative genetic correlations for the adults at the NE (100 and 300 m) and UE (150 m) sites were found (Figure 2a, c, Table 3).
Correlograms for estimated multilocus relatedness coefficient (r) of Manilkara maxima and seven distance classes for the study sites Nova Esperança (NE) adults (a) and saplings (b), Una Ecopark (UE) adults (c) and saplings (d), and Lemos Maia (LM) adults (e) and saplings (f). The square symbol represents the estimated multilocus relatedness coefficient (r). The dashed lines represent the upper and lower 95% confidence intervals from 10000 permutations.
Spatial pattern and genetic structure estimates for Manilkara maxima at three study sites, Nova Esperança (NE), Una Ecopark (UE) and Lemos Maia (LM) near Ilhéus, Bahia, Brazil: degree of clustering (Z) – negative value indicates clustering and positive value indicates dispersion, and higher absolute values indicate the intensity of the spatial pattern; multi-class test statistic (ω); spatial genetic structure test statistic (Sp); and multi-locus genetic correlation coefficient (r) for each distance class (25, 50, 75, 100, 150, 200 and 300 m distance classes). * P < 0.05, ** P < 0.01, *** P < 0.001.

Overall, among the three study sites, the sapling SGS multiclass test (ω) indicated the correlograms (Figure 2b, d, f) were not significantly different from each other (ω = 20.0, P = 0.067). Significant SGS multiclass tests (i.e. correlograms were significantly different from the null hypothesis of no SGS) and significant Sp statistics (Table 3) were observed for the saplings at all three study sites (NE: ω = 29.7, P = 0.022, Sp = 0.024, P = 0.010; UE: ω = 27.4 P = 0.020, Sp = 0.015, P = 0.045; LM: ω = 44.9, P = 0.010, Sp = 0.036, P = 0.001). Significant positive genetic correlations were found at the 25-m distance class for the saplings at the NE site, at the 75-m distance class for the saplings of the UE site, and at the 25-, 50-, 150- and 300-m distance classes for the saplings of the LM site (Figure 2b, d, f, Table 3). However, a significant negative genetic correlation at the 300-m distance class was observed for saplings at the NE site (Figure 2b, Table 3).
At the large-fragment sites (NE and UE), the adult and sapling SGS multiclass test statistics were not significantly different (NE ω = 5.52, P = 0.972 and UE ω = 11.7, P = 0.633). However, the Sp test statistic was consistently higher for the saplings than the adults from the two large-fragment sites (Table 3). The adult and sapling SGS at the small-fragments site (LM) was significantly different (ω = 25.1, P = 0.034). Specifically the differences were found at the 150-m (t = 4.32, P = 0.038) and 300-m (t = 4.87, P = 0.027) distance classes. Additionally, stronger SGS was observed in the saplings (Sp = 0.036) compared with the adults (Sp = 0.014) from the LM small-fragments site (Table 3).
Point pattern analysis indicated that Z-values of both life stages at each study site were negative, indicating clumped distributions (Table 3). Additionally, absolute Z-values at each site appeared to increase from the sapling life stage to the adult life stage (Table 3), but were not significantly different between saplings and adults (F = 0.48, P = 0.525).
DISCUSSION
Overview
Our results suggest the landscape-scale genetic structure of M. maxima has not been shaped by isolation by distance. Indeed, most of the genetic variation (92.1%) was found within study sites rather than among the sites. These results likely reflect in part the restricted geographic scale of this study. In addition, long-lived woody tree species with animal-dispersed seeds and outcrossing breeding systems often maintain more genetic variation within habitat patches than across patches (Hamrick et al. Reference HAMRICK, GODT and SHERMAN-BROYLES1992). In the present study, the overall mean SGS as measured by the Sp statistic (Sp = 0.019) was similar to the Sp statistic proposed for trees (Sp = 0.010) and the mating system values for outcrossing species (Sp = 0.013) (Vekemans & Hardy Reference VEKEMANS and HARDY2004). Additionally, these results are supported by the high rate of migrants per generation (Nm = 6.49), indicating extensive gene flow for M. maxima. Similar results of partitioning genetic variation within and among fragments have been found for other Atlantic forest tree species growing in a fragmented landscape (Auler et al. Reference AULER, REIS, GUERRA and NODARI2002, Seoane et al. Reference SEOANE, KAGEYAMA and SEBBENN2000, Reference SEOANE, KAGEYAMA, RIBEIRO, MATIAS, REIS, BAWA and SEBBENN2005; Silva et al. Reference SILVA, DE OLIVEIRA, LINS-E-SILVA and RODAL2008). These results suggest extensive gene flow and common ancestry may minimize the effects of habitat fragmentation on genetic structuring in these tree species that normally exist at low densities across the landscape.
Fragmentation and life stages
Consistent with our hypotheses, overall significant weak to moderate SGS was detected for adults and saplings from across the three study sites for both the multiclass test statistic (ω) and the Sp statistic (Table 3, Figure 2a-f). We expected this pattern of SGS for M. maxima because it is common for animal-dispersed neotropical tree species (Azevedo et al. Reference AZEVEDO, KANASHIRO, CIAMPI and GRATTAPAGLIA2007, Hardy et al. Reference HARDY, MAGGIA, BANDOU, BREYNE, CARON, CHEVALLIER, DOLIGEZ, DUTECH, KREMER, LATOUCHE-HALLÉ, TROISPOUX, VERON and DEGEN2006). Five of the six populations studied exhibited significant positive genetic correlations at the 25-m distance class indicating individuals < 25 m apart are more closely related than those at greater distances. The only significant difference in the multiclass test statistic (ω) among study sites was found for the adult life stages between the LM small-fragment site and the UE large-fragment site. These sites also exhibited a significant moderate pairwise FST value (FST = 0.10, P < 0.001), which may be historical evolutionary processes, as the adult trees were established pre-fragmentation. The Sp statistic for adult trees was similar among the sites, further suggesting patterns of pre-fragmentation SGS typical of outcrossing tree species (Vekemans & Hardy Reference VEKEMANS and HARDY2004). We expected similar SGS among the adult sites, as this species is long lived and these populations were established pre-fragmentation.
The sapling SGS measured by the multiclass test statistic (ω) was not significantly different among study sites, suggesting fragmentation has not affected sapling SGS. Although this result was not consistent with our hypothesis, similar results were found for recently fragmented populations of the neotropical tree species Tabebuia ochracea (Moreira et al. Reference MOREIRA, FERNANDES and COLLEVATTI2009). A likely explanation is that long-distance seed dispersal influences the SGS of saplings in small fragments. Six of the small fragments we sampled at the LM site had no reproductively mature trees (≥ 20 cm dbh), yet saplings were present. Additionally, we found a high rate of migrants per generation (Nm = 6.49). However, pollen dispersal may also influence the SGS. The Sp statistic was higher for saplings from both the NE and LM sites (Table 3) than expected for outcrossing tree species (Vekemans & Hardy Reference VEKEMANS and HARDY2004). These Sp statistics were similar to those found for the fragmented Atlantic forest tree Copaifera langsdorffii, which is insect-pollinated and seeds are dispersed by birds and mammals (Sebbenn et al. Reference SEBBENN, CARVALHO, FREITAS, MORAES, GAINO, DA SILVA, JOLIVET and MORAES2011). Despite the high migration rate, the NE and LM saplings exhibited the highest genetic correlation coefficients in the 25-m distance class (Table 3), suggesting limited dispersal is also shaping the SGS of these two sites.
The only significant difference between adult and sapling SGS (ω) was found at the LM small-fragment site. Chung et al. (Reference CHUNG, EPPERSON and CHUNG2003) suggested that if several younger individuals survive into older life stages, the SGS is expected to be similar between younger and older life stages. Similarly, spatial clustering was not different between life stages. The limited genetic structuring and similar spatial distribution patterns within and across the forest patches in this study does not allow us to disentangle which ecological factors are influencing the SGS of M. maxima.
Conclusion
Manilkara maxima exhibited low to moderate levels of SGS across the study sites, with about 90% of genetic variation occurring within sites. The results suggest the recent fragmentation has not negatively affected the SGS of this tree species. Long-distance gene flow is important for maintaining genetic connectivity as evidenced by the high migration rates, but limited seed dispersal also shapes SGS of saplings. However, over longer time scales and if forests become more fragmented, disruptions to pollinator and seed disperser species could result in deleterious consequences to dispersal and recruitment increasing the probability of extinction of this ecologically and economically important tree species.
ACKNOWLEDGEMENTS
We thank the Brazilian Institute for the Environment and Renewable Natural Resources (IBAMA), for authorizing this research (13291-1) and UESC for use of their laboratory. We thank: the owners of the Fazenda Nova Esperança; Marcelo Araújo and Gabriel Santos from IESB; José Inácio Lacerda at CEPLAC for allowing access to the study sites; André Amorim and Cristiane Aguiar for access to the André Maurício Vieira de Carvalho Herbarium of the Cocoa Research Center (CEPEC); Larry Kelly, Damon Little, Gregory Plunkett and Matthew Sewell at The New York Botanical Garden; and Diego Matos, Tilson Nascimento, Daniel Piotto, the late Talmon Santos, and Cristiane Tillia for field assistance; and an anonymous referee for valuable comments that helped improve the manuscript. S.M.G. received support from Fordham University's GSAS, a Fordham Biology Alumni Research Fellowship, a Fulbright Fellowship, and from The New York Botanical Garden.