


Introduction
The polar oceans with their sea-ice covet have received attention recently for two reasons. Firstly, the global conveyor-belt circulation of the ocean is believed to be forced in the North and South Atlantic through deep-water formation. Sea-ice export to lower latitudes plays a major role in the intensity of this forcing mechanism. Secondly, CO2 response experiments with coupled atmosphere-ocean circulation models show an enhanced warming in polar regions for increased atmospheric greenhouse gases. Whether this is due to real physical feedback processes or to unrealistic simplifications of the sea-ice model component remains to be determined. Coupled climate models generally use thermodynamic sea-ice models or sea-ice models with simplified advection schemes.
The importance of the role of sea ice in the climate system calls for an improved representation of sea ice in global climate models. The use of more sophisticated dynamic thermodynamic sca-ice models is required because dynamic—thermodynamic sea-ice models appear to be less sensitive to global warming than pure thermodynamic models, and, secondly, only dynamic-thermodynamic sea-ice models provide the fresh-water/salt flux (net freezing rate associated with the ice motion.
The net freezing rate, as well as the sea-ice export out of Fram Strait, exhibit a large variability, indicating the importance of the moving sea-ice cover. Presently only a few coupled general circulation models (GCMs use realistic sea-ice components (i.e. the oceanic surface buoyancy flux is not realistic in most climate simulations). The pronounced pattern of the net freezing rate with fresh-water fluxes of the order of the annual precipitation, or even larger, is not reproduced in most models.
In order to improve this situation the Sea Ice Ocean Modelling (SIOM) Panel of the Arctic Climate System Study (ACSYS) has been charged with the task of determining the optimal sea-ice component for use in coupled climate models. This task is the main focus of the Sea Ice Model Intercomparison Project (SIMIP), and includes two work packages: to produce a standard forcing and verification dataset, and to apply a model hierarchy from which the optimal model is derived through minimization of an error function that measures the deviation between model and observations.
The pattern of the net freezing rate depends mainly on the structure of the wind field and the dynamic model parameters. Thermodynamic processes can modify the freezing rates, but the effect is limited, since the freezing rates are smaller for thicker ice. Therefore, during the first phase of the model optimization, the investigations are focused on the dynamical part of the sea-ice model, but thermodynamic parameterizations will be treated as soon as possible.
Model Domain and Forcing Data
The prognostic equations are solved on a rotated spherical grid (with the model pole on the equator in the Indian Ocean) for the whole Arctic with a resolution of 1 × 1 and a daily time-step. Atmospheric forcing data are available from the European Centre for Medium-Range Weather Forecasting (ECMWF) for 1986–92. The ECMWF 10 m wind field is averaged to 24 hour means. ECMWF 2 m air temperatures and dew-point temperatures over ice-covered regions are dominated by prescribed monthly climatological surface temperatures, and show almost no variability except for the large steps at the end of each month. To smooth these step functions and to remove the difference of 2°C in the summer air temperatures for different years due to changes in the ECMWF model (in recent years the temperature of melting sea ice has been set to the freezing point of sea water instead of to 0°C), 7 year mean temperatures are derived for each month, and the model is forced with temperatures linearly interpolated between these monthly means. Since in summer the 7 year monthly mean ECMWF air temperatures are still below the observed average temperature of 0°C in the central Arctic, a lower limit for the air temperatures of 0°C is imposed for to June to 15 August as an additional correction. Dew-point temperatures are modified accordingly, so that the relative humidities are preserved. Cloudiness (Reference Ebert and CurryEbert and Curry, 1993) and precipitation (Reference Vowinckel, Orvig and OrvigVowinkel and Orvig, 1970) are prescribed as spatially constant climatological monthly means.
The ocean is represented rather crudely by a motionless, 50 m deep mixed layer. Horizontal heat transport and vertical mixing are represented by specifying a spatially varying, annual average heat flux into the underside of this mixed layer. Likewise, input of momentum from the ocean into the ice is accomplished by specifying a spatially varying, annual average geostrophic current field. Geostrophic currents and sea-surface tilt are taken from an oceanic circulation model (Reference Gerdes and KöberleGerdes and Köberle, 1995). The oceanic heat flux into the upper mixed layer of fixed depth is prescribed from a coupled sea-ice-ocean circulation model (Reference Hibler, Zhang and PeltierHibler and Zhang, 1993).
Sea-Ice Model Intercomparison
In order to derive the optimal description of the sca-ice physics, high priority is placed within the modelling program on sensitivity experiments running different sea-ice model parameterizations on the same spatial grid with the same forcing, initial values and verification data. These studies investigate the open questions concerning the dynamics and thermodynamics of sea ice:
-
(1) How many ice-thickness categories have to be resolved by the model?
-
(2) What is the optimal constitutive law?
-
(3) Which shape of the yield curve is realistic?
-
(4) What strength parameterization is appropriate?
-
(5) What is the optimal albedo parameterization, including the dependence on melt ponds, ice thickness, snow cover and snow temperature?
-
(6) How is the absorbed insolation disposed and how does it affect ice thickness and concentration (lead amount), including melting of the top, bottom or side surface of the ice, heating of the ice, enlargement of brine pockets, storage in leads and storage in the mixed layer beneath the ice?
The optimal model is determined from a model hierarchy concerning dynamics, thermodynamics and numerics using the same forcing data derived from the analyses of the ECMWF, and comparing the results with buoy trajectories and ice-thickness observations as verification data.
A variety of different yield curves may be investigated by using the viscous plastic rheology. Based on previous investigations (Reference HiblerHibler, 1979; Reference Owens and LemkeOwens and Lemke, 1990: Reference Ip, Hibler and FlatoIp and others, 1991) the most physically realistic yield curves have moderate amounts of shear strength and some type of closure, so that there is no outward pressure in the absence of deformation. Consequently the main candidates for model intercomparison would be the ellipse with replacement (i.e. the pressure laken to be a function of deformation rate so that it goes to zero in the limit of small strain rates) and the truncated ellipse that is similar except that it has no tensile strength. However, within this constraint there are still issues about what the optimal wind and water drag coefficients should lie, and how these parameters should vary with time. Also, what is the optimal strength constant and how should the strength be parameterized as a function of ice-thickness characteristics.’
With respect to simpler models that may be particularly useful in climate studies, especially when monthly mean or otherwise smoothed forcing fields are used to drive an ice model, some variation of a cavitating fluid seems most useful. The cavitating fluid approximation neglects shear and tensile strength and retains only compressive strength. One formulation of the cavitating fluid is the iterative solution of Reference Flato and HiblerFlato and Hibler (1992), which provides a precise value for the ice pressure. This iteration procedure typically begins from a free-drift velocity field that is then modified to prevent excessive ice-thickness buildup in a momentum conserving way.
Another simplified model is to make use of constant bulk and shear viscosities, even though this will lead to tensile-stresses. However, an additional problem here is that values of these viscosities large enough to restrict the ice-thickness buildup will prevent slippage and ice flow near the coast that occurs in plastic systems with the viscosities taken to be nonlinear functions of the deformation-rate invariants. The limitations of this type of model can however be tested in a model intercomparison study.
Compressive strength is a fundamental material property of pack ice that must be parameterized in a model. The stiindard parameterization used in two-level ice models is (Reference HiblerHibler, 1979):

where P is the two-dimensional (2-D) compressive strength (N m−1), P* is a strength parameter (N m−1), h is the mean ice thickness (m), K is a dimensionlcss strength parameter, and A is the sea-ice concentration. P* essentially determines the strength, whereas K controls the decay of ice strength with decreasing concentration. The value of P* has been inferred by comparison of modelled and observed buoy drift (Reference Hibler and WalshHibler and Walsh, 1982; Reference Flato and HiblerFlato and Hibler, 1992). Reference Gerdes and KöberleFlato (1994) compared this strength parameterization to that proposed by Reference RothrockRothrock (1975) based on ridging energy losses in a model that explicitly treats the redistribution of ice thickness by ridging. Reference Gerdes and KöberleFlato (1994) noted that there was considerable variability in the resulting ice strength, and that alternative parameterizations based on, for example, mean thickness squared, ought to be considered. These will be investigated in this project.
The open questions concerning the thermodynamic processes are the proper albedo parameterization, the treatment of melt ponds, and snow cover. Furthermore, it is not settled how the absorbed insolation is disposed, and how it affects the ice concentration. Similarly, an improved flux parameterization is needed for the radiative and turbulent fluxes. Here the question arises as to whether the energy balance should be calculated for ice and ocean separately, or as a function of ice concentration.
Model Hierarchy
Prerequisites:
-
(1) Model grid: all models will use the same grid and land-boundary mask.
-
(2) Advection algorithm: all models will use a simple upstream—differencing advection scheme.
-
(3) Thermodynamic model: all models will use the same surface-energy budget and albedo parameterizations, and will compute thermodynamic growth assuming a linear temperature profile. Thermodynamic calculations will be performed separately for open water and seven thickness categories, assuming a uniform distribution of ice thickness between zero and twice the mean ice thickness.
-
(4) Snow model: all models will use the same snow model in which snow mass per unit area evolves according to a conservation equation, but heat conduction through the ice/snow slab is computed assuming a linear temperature profile and a conductivity obtained as a weighted mean of ice and snow conductivities. An improvement of the heat conduction model is envisaged at a later stage by implementing a consistent three-layer Reference SemtnerSemtner code (1976)
-
(5) Mixed layer: all models will include a motionless, fixed-depth mixed layer (50m deep), which is used to store heat during the ice-free season. Only when the mixed layer cools to freezing point (271.2 K), is ice allowed to form.
-
(6) Atmospheric forcing and oceanic boundary conditions: all models will make use of the same atmospheric forcing fields and parameterizations of radiative fluxes. The models will also use specified annual mean ocean geostrophic currents and heat fluxes into the underside of the mixed layer.
-
(7) Initial conditions and integration: all models will begin with an ice-free ocean, perform a 7 year spin-up, the end of which is used as the initial condition for a subsequent 7 year analysis run. The 7 year period is 1986–92.
Several ice-dynamics schemes will be compared in this project. Each model will be optimized by adjusting both the surface wind drag coefficient and the strength parameters P* and K so as to achieve the best fit to observed buoy drift. The specific models to be compared are as follows (a more detailed description is provided in Kreyseher and others, 1997): (1) viscous-plastic with replacement closure, elliptical yield curve: (2) viscous-plastic with replacement closure, truncated elliptical yield curve: (3) viscous—plastic with zero shear viscosity; (4) cavitating fluid; (5) compressible Newtonian fluid (constant η and ζ and (6) surface current drift with step-function stoppage.
The initial focus of this project is on sea-ice dynamics. However dynamics and thermodynamics are closely coupled through the ice-strength parameterization. The thermodynamic parameters that control the partitioning of net siulace energy flux between lateral and vertical growth or melt are particularly important because of the exponential dependence of strength on compactness. This includes the parameterization of the thermodynamic source-term SA (Reference HiblerHibler, 1979) in the balance equation for the ice concentration and the inclusion of the three-layer Reference SemtnerSemtner (1976) model for the heat conduction through the ice. These parameters will also be optimized in the second phase of the project, primarily based on comparison with SSM/I-derived ice concentration.
Verification Data and Optimization Method
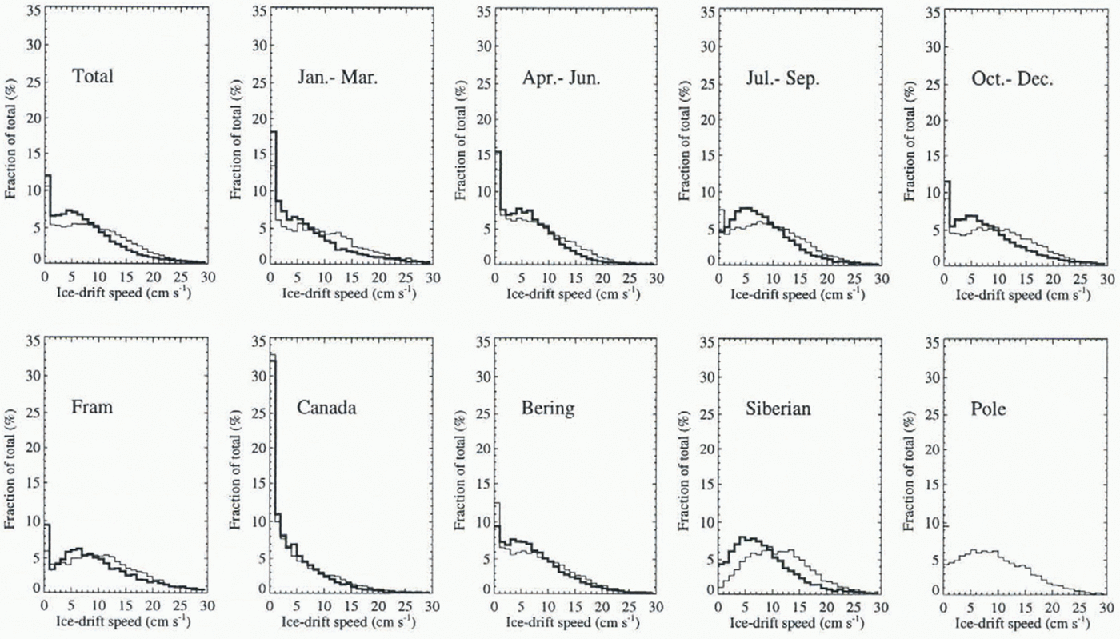
The main verification data for the model dynamics is the wealth of buoy drift data.These data can be compared with model results in v arious ways. One is to compare observed and modelled trajectories. Another is to compute drift speed over specified time intervals for both modelled and observed trajectories, and average these drift speeds (and directions) over various regions. Yet another comparison is to measure the distance or displacement between endpoints of the modelled and observed trajectories over some time interval (both trajectories having started at the same position at the beginning of the interval). The trajectory endpoint displacement is some combination of drift speed and direction discrepancies, and so is a useful single measure of the “goodness”of a modelled trajectory. Finally, one can select a region and compute the distribution of modelled and observed drift speeds. Results of such a comparison are show n in Figure 1 in the form of drift speed histograms for various sectors of the Arctic.
Observes (thick line) and simulated (thin line) daily speed distributions. The simulation results are obtained from the viscous-plastic model. Drift-speed statistics are calculated for four seasons January–March, April-June, July-September, October–December. There are five separate regions: From, south of 85° N, between 45° and 45°E; Canada, south of 85° N, between 135° W and 45° W; Bering, south of 85° N, between 135° Wand 135°E; Siberia, south of 85° N, between 135° E and 45°E; Pole, north of 85° Nand for all data (Total).
Another important dataset containing daily total ice coiicenti ation is available from the passive microwave sensors SMMR and SSM/I for the period under investigation. The ice concentrations are calculated with the NASA Team algorithm with a resolution of 25 km. For comparison with the numerical simulation the SMMR and SSM/I data are interpolated to the model grid with a grid spacing of 110km. First results with the viscous plastic model show a well-reproduced seasonal cycle of the ice extent not shown). Deviations are due to the lack of an interactive ocean model and the not-yet-tuned thermodynamic parameters. An optimal description of ice concentration will only be achieved after the second phase, when the thermodynamic code has been optimized.
Ice-thickness observations are not widely available, and most of the observations that are available are ice-draft measurements from submarine upward-looking sonar. The data available for the present project are seven 50-100 km transects across the North Pole as reported by Reference McLaren, Bourke, Walsh, Weaver, Johannessen, Muench and OverlandMcLaren and others (1994). For comparison to modelled thickness, these draft observations can be approximately converted to thickness by multiplying draft by the ocean/ice density ratio 1.12. The resulting mean thicknesses are compared to the model derived values (Reference Kreyscher, Harder and LemkeKreyscher and others, 1997).
In order to ensure a fair comparison, and to provide the most stiitalilc set of parameters for subsequent applications of the various models, each model will be optimized by-adjusting various parameters to produce the best agreement with observations. Such an optimization procedure necessarily involves the definition of an error function that measures the goodness-of-fit between model and observations. It is not obvious a priori how to define the best error function, and this will be the subject of more careful study during linearly stages ofthc intercomparison project. Nevertheless, we can outline some of the candidate error functions that might be used, either singly or in combination. Ice-motion comparisons, based on observed buoy drift, will be most important for dynamic parameters like ice strength and drag coefficients. Some example error functions are therefore:
-
(1) Average trajectory endpoint displacement after some time interval (e.g. 10 days).
-
(2) Average drift-speed and direction differences computed over some time interval.
-
(3) Difference in shape of drift-speed histograms.
Ice-concentration comparisons, based on SMMR and SSM/I data, will be most important for thermodynamic parameters like those involved in partitioning between vertical and lateral growth and melt. Some examples of error functions in this case might be:
-
(1) Difference in concentration averaged over various regions and seasons.
-
(2) Difference in ice extent in various sectors (defined as the area enclosed by the 15% concentration contour).
Ice-thickness data will be treated similarly to ice concentration, although this dataset is significantly smaller. Certain of the above error functions may not be used in the definition of optimality, but may still be useful in comparing the behavior of various models. For example, differences between the optimal viscous-plastic model and optimal cavitating fluid model might be illustrated by comparing the shape of the drift-speed histograms (see Figs 1 and 2).
First Results and Conclusions
During the first phase of SIMIP, four models have been compared: a viscous-plastic model based on Reference HiblerHibler (1979) with an elliptical yield curve and replacement closure; a cavitating fluid model (Reference Flato and HiblerFlato and Hibler 1992); a compressible Newtonian fluid model; and a free-drift model with stoppage (for details see Reference Kreyscher, Harder and LemkeKreyscher and others, 1997). All models have been optimized by minimizing an error function through tuning of the dynamic model parameters. Footnote 1 From the application of the different error functions discussed above it is obvious that the speed-distribution difference represents the most adequate error function for the optimization of dynamic model parameters.
This speed distribution is displayed in Figure 1 as annual mean and seasonal averages for the whole Arctic (upper panel) and as annual mean for live selected regions (lower panel) for the viscous plastic model (thin lines) and the buoy observations (thick lines). The viscous-plastic model represents the observations well, but certain differences are apparent.
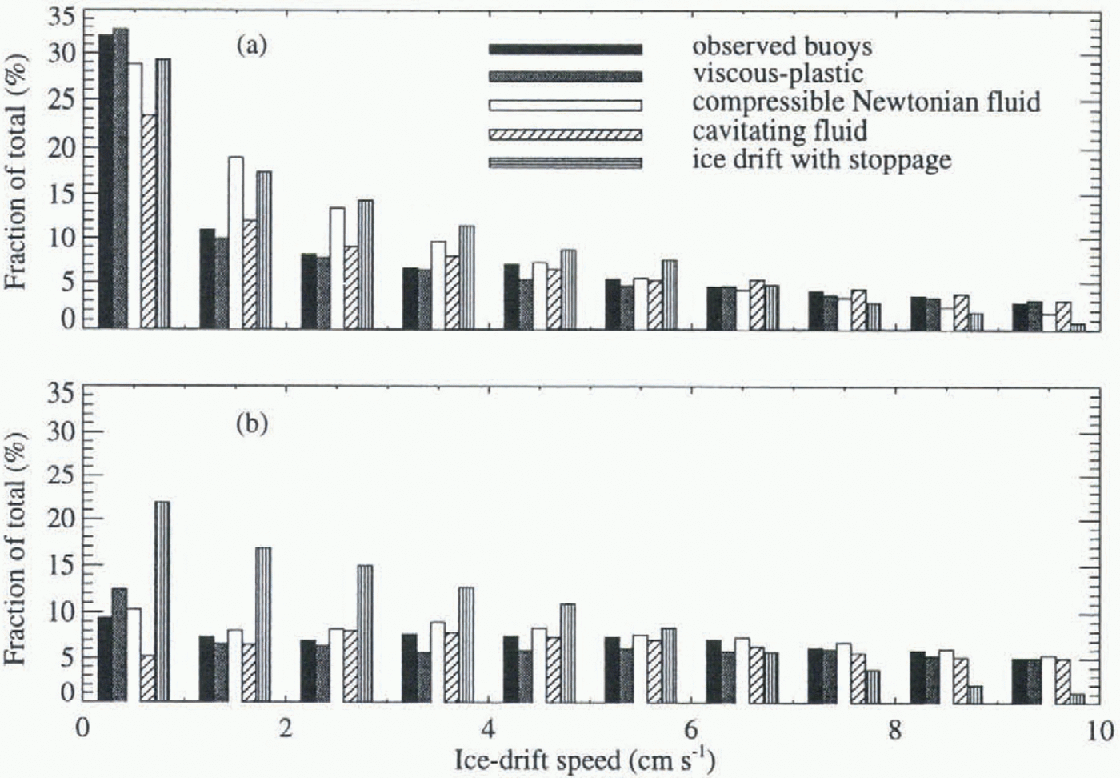
The speed distributions of the competitive models are shown in Figure 2 for the Canada region (a) and for the Bering region (b). In the Canada region the viscous-plastic model yields the best results, whereas in the Bering area the The cavitating fluid model has been implemented and optimized at the Canadian Centre for Climate Modelling and Analysis; the other models have been applied at the Alfred-Wegener-Institut. Special care has been taken to ensure the same treatment of all models through exchange of model and analysis codes. compressible Newtonian-fluid model performs best. Summed over all regions the viscous–plastic model achieves the best fit. It is, therefore, at this stage considered to be the best representation of sca-ice dynamics in large-scale models. The simple free-drift model with stoppage significantly overestimates the small drift speeds, whereas the cavitating fluid underestimates the occurrence of low speeds, especially in the Bering region (for more details see Reference Kreyscher, Harder and LemkeKreyscher and others, 1997). In conclusion, the viscous–plastic model represents the best starting point for further model improvements.
Comparison of drift-speed distributions for the observations and four different dynamics schemes. Drift statistics are shown for (a) the Canada region (south of 85° N, between 135° W and 45° W) and (b) for the Bering region (south of 85° N, between 135° W and 135° E).
Acknowledgements
The atmospheric forcing data were derived from ECMWF analyses.



