In this article, the variable influence of social and linguistic factors on language variation and change will be described and discussed based on material from a real-time study in Eskilstuna, a medium-sized Swedish town. The project Continuity and Change in Present-Day Swedish: Eskilstuna Revisited, directed by Bengt Nordberg, is a sociolinguistic investigation of variation and change, which makes comparisons to a similar study that Nordberg conducted a generation before. Recordings were made of 83 individuals in 1967–68 with the results most fully presented in Nordberg (Reference Nordberg1972, Reference Nordberg1985). The new study comprises both a panel study with 13 rerecorded informants and a trend study with 72 new informants, recorded in 1996. The informants in both corpora are natives of Eskilstuna. As a result, we can study both individual and generational language change over a period of nearly 30 years. In the present work (cf. Sundgren, Reference Sundgren2002), we examine 7 morphological and morphophonological variables.
In the 1990s, when this project started, the general opinion in Sweden, also among linguists (e.g., Lindström, Reference Lindström2000; Molde, Reference Molde, Molde and Ståhle1970; Teleman, Reference Teleman1991; Teleman, Hellberg, & Andersson, Reference Teleman, Hellberg and Andersson1999; Wellander, Reference Wellander1973), was that spoken language is changing rapidly from the local vernacular toward spoken standard. Thus, my hypothesis was that the seven variables were in the process of rapid change toward the standard forms of the written language. As we will see, however, the data show that the rate of change at the level of the community is low, with the exception of one variable (the definite plural of neuter nouns [DefPlurNeuter]). Nevertheless, although the use of standard form has not increased much on average, there have been changes in the internal relationship between the social groups, between men and women, and between age groups. The social and age differences have decreased, whereas the gender differences have increased. There has also been change in the influence of internal factors (such as stress) on the choice of standard variants over local variants. The changes in the conditioning of the variation led me to conclude that the seven variables under consideration are in a process of change, even if the overall rate of change is so slow that it does not register on the macro level.
The change over the seven variables is about the same in rate and direction, whether we apply the panel or the trend study. In this article, the focus will be on the trend study, that is the comparison of the 72 informants in the new sample with all 83 informants from 1967.
REAL-TIME STUDIES: THE PANEL VERSUS THE TREND STUDY
Explanations of how linguistic change takes place have—to a greater or lesser extent—stressed the linguistic (structural) or the extralinguistic (social) forces. The Neogrammarians stressed the linguistic forces as decisive of linguistic change; whereas James Milroy (Reference Milroy1992) claimed that social forces are crucial. Labov (Reference Labov1994) described how linguistic change depends on the linguistic system, but he also (2001) demonstrated the great importance of the social factors.
Most investigations into the social and linguistic processes of language change have been cross-sectional with very little comparable data from earlier points in time. Such apparent-time studies, where different age groups are observed at the same point in time, make it possible to make inferences about language change. A problem for the apparent-time hypothesis, however, is age-grading. It is not certain that the speech of, for example, 60-year-olds, is the same as it was when they were 40-year-olds.
In the relatively short history of sociolinguistics, possibilities to return to the surveyed communities for follow-up studies have not been exploited to any great extent. Most of the real-time investigations that actually have been carried out have been made within a relatively short time span or with only a few variables and/or speaker groups. Before the time of large-scale sociolinguistic surveys, Hermann (Reference Hermann1929) revisited the small village Charmey in Switzerland to test Gauchat's findings from Reference Gauchat1905. Labov's department store study in New York (Reference Labov1966a) was replicated by Fowler (Reference Fowler1986); Trudgill revisited Norwich (Reference Trudgill1974, Reference Trudgill1988); and Cedergren returned to Panama City for a renewed investigation (Reference Cedergren1973, Reference Cedergren and Lowenberg1987). Some Scandinavian studies have used the same methodology, for example, Steinsholt (Reference Steinsholt1964, Reference Steinsholt1972) with data from Hedrum, Norway; Thráinsson (Reference Thráinsson and Hovdhaugen1980) from Mývatn, Iceland, with some informants who also took part in a dialect study in 1942; and Paunonen (Reference Paunonen and Thelander1996), which included data from the early 1970s and the early 1990s of colloquial Helsinki speech. Other real-time studies have been conducted in Tsuoraka, Japan (see Chambers, Reference Chambers1995:194–198), different dialect areas of Finland (e.g., Kurki, Reference Kurki, Gunnarsson, Bergström, Eklund, Fridell, Hansen, Karstadt, Nordberg, Sundgren and Thelander2004), and various parts of Denmark (e.g., LANCHART).Footnote 1
There has been some discussion on the advantages and disadvantages of panel versus trend studies for research into ongoing change. In a panel study, recordings collected from the same individuals at different times are compared. However, according to Thelander (Reference Thelander, Saari and Tandefeldt1982), it is wrong to assert that the same individuals are representative of the population at the second occasion. Indeed, different comparisons (Sundgren, Reference Sundgren2002:291–295, 339–340) show that the panel speakers are not representative of the Eskilstuna population in 1996; they speak consistently more vernacular, as they also did in 1967.
Thelander (Reference Thelander, Saari and Tandefeldt1982) and Labov (Reference Labov1994:83–85) both concluded that the trend study is the best method to gather data on linguistic change, but Labov added that information from a panel study is needed to see how individuals behave over time and thus make it possible to interpret apparent-time studies.
As we will see, where there is any change at all in the seven variables between 1967 and 1996 in the direction of standard speech, this manifests itself as both individual change and generational change. Although it has been assumed that, for example, 62-year-olds speak the same way as they did when they were 42, and that there is linguistic stability in middle and old age (Chambers, Reference Chambers1995:194), the results from the Eskilstuna panel study show that older individuals change their language too. Though Labov (Reference Labov2001:447) set the age of stabilization at 17, with a reference to Nordberg and Sundgren (Reference Nordberg and Sundgren1998) he added:
The lability of speakers 30–50 may be characteristic of changes from above as opposed to changes from below, or of morphology as opposed to phonology, but it underlines the fact that the assumption of stability for young adults, built into the models that follow, may have to be revised.
The panel speakers in Eskilstuna show that individuals can change their speech also after the age of 30, well up to the age of 50.
Another argument in favor of the trend method as the main method is that the social, economic, and demographic changes in Eskilstuna from the middle of the 1960s to the middle of the 1990s were drastic.
BACKGROUND DATA ON ESKILSTUNA
Eskilstuna is a medium-sized town, situated 120 kilometers west of Stockholm in what is traditionally known as the central Swedish dialect area. In Nordberg and Sundgren (Reference Nordberg and Sundgren1996), we described the demographic, social, and economic development of the town from the 1960s to 1995 and discussed its sociolinguistic consequences. In 1967, Eskilstuna prospered as an industrial town with a growing population and a low rate of unemployment. Eskilstuna incorporated the surrounding five rural districts and the town district of Torshälla in 1971, but for the project, the informants were recruited from the two central parishes that constituted Eskilstuna until 1971. In 1971, the whole town district of Eskilstuna had about 93,000 inhabitants. The same area had a little fewer than 90,000 in 1994. Eskilstuna has been faced with a number of economic crises, factory closures, high unemployment, and a dramatic change in the structure of industry. As Eskilstuna was such a marked industrial town, with a concentration on cutlery and steel industry, the transition from an industrial to a postindustrial community has been unusually dramatic and difficult. There has been a pronounced change to more service and administration, which, linguistically, probably favors a process toward more standard speech. On the other hand, the gloomy social and economic situation in Eskilstuna in 1995, which was manifested in, for example, a lower than average income and a lower level of education than other communities of comparable size, probably contributes to maintaining the local speech norms. Perhaps more important though, for the choice of linguistic variants, is the prestige of the local variety among those who speak it, the speakers' identification with the local group and its values, and whether they feel that the community offers a good life or not.
MATERIALS AND METHODS
Both the 1967 and the 1996 corpora are substantial: 53 hours of speech and 83 informants (born 1876–1951) in the 1967 collection; 78 hours and 85 informants in the 1996 data. Of these 85 informants, 13 (born 1913–1950) also took part in 1967, and 72 (born 1904–1980) were sampled to form a cross-section of the town in 1996, with the aim of achieving as representative a sample as was achieved with the sample in 1967. The 13 rerecorded speakers from the 1960s, forming the panel study, make it possible to trace intraindividual variation over time. The trend study (the new sample as compared with that of 1967) makes it possible to discover generational differences and community change.
To find as many informants as possible for the panel study, I searched the telephone directory and population registers. The 13 persons from the 1967 sample still alive and living in Eskilstuna (7 men and 6 women) were all willing to take part in the new investigation. The selection of informants for the trend study was mainly a result of systematic sampling of population registers.
Both the 1967 and the 1996 corpora consist of conversationlike informal interviews, in 1967 between Nordberg and an informant and in 1996 between me and an informant, resulting in fairly casual speech. I tried to make the conversation as spontaneous as possible to allow the informants to forget that they were being recorded. We spoke about different things, but in most interviews, the same subjects occurred: school, work, home, family, interests, and the town of Eskilstuna. Although not a native of Eskilstuna, I have lived there since 1978 and grew up in a town 45 kilometers from Eskilstuna. I audio-recorded at least 45 minutes with each informant, on average 55 minutes.
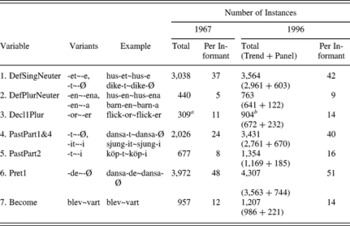
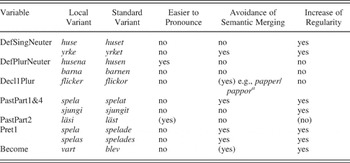
My empirical material consists of seven morphological and morphophonological variables (see Table 1). Each variable has two distinct variants, one standard form, which agrees with the written form, and one traditionally used in spoken language in Eskilstuna. The nonstandard forms of these variables are not unique for Eskilstuna; they are or have been more or less common in colloquial speech over larger or smaller areas in Central Sweden. The seven variables are:
1. The definite singular suffix of neuter nouns (DefSingNeuter)
2. The definite plural suffix of neuter nouns (DefPlurNeuter)
3. The plural suffix of the nouns of the first declension (Decl1Plur)
4. The past participle suffix of the verbs of the first and the fourth conjugations (PastPart1&4)
5. The past participle suffix of the verbs of the second conjugation (PastPart2)
6. The preterite suffix of the verbs of the first conjugation (Pret1)
7. The verb form became (Become), which in Swedish has the two variants blev and vart, the preterite forms of two different verbs bli(va) and varda, both with the meaning ‘become’ and, as passive-forming auxiliary, ‘be’.
To be able to compare the two investigations, I look at the traditional social categories (socioeconomic group, age, gender, and education) and analyze “hard” data (cf. Nordberg, Reference Nordberg and Nordberg1994:15), which I believe leads to a rather good understanding of the sociolinguistic reality. In addition, I also use the concepts of social mobility and integration, which are other ways of looking more at the individual and his or her life situation to explain linguistic behavior. Factors indicating how well integrated into Eskilstuna the informants are have been used to construct an integration index. With an integration index, some psychological “soft” data (Nordberg, Reference Nordberg and Nordberg1994:15) have been captured, but I have also been able to quantify the concept of integration and thus to calculate correlations between integration in the local community and linguistic behavior.
Variables, variants, and total number of instances in the 1967 and the 1996 corpora

a29 speakers, b51 + 13 speakers.
Investigations with the category of men and women as an independent variable have attracted some criticism.Footnote 2 Eckert (Reference Eckert1989:246–247) pointed to the risk of letting sex represent gender without due attention to how the gender roles are constructed. Cameron (Reference Cameron1992a) argued that we must stress “the difference gender makes” instead of “gender difference.” Cameron (Reference Cameron, Gunnarsson and Liberg1992b) did not question that there are linguistic differences between men and women, but she claimed that many sociolinguistic investigations are based on gender stereotypes. I am aware of the risk of not paying enough attention to the fact that the differences are due to the social roles in society, and when using the category of men and women as an independent variable, I look not only at the correlation with the linguistic variables, but also at the interaction with other social factors.
As Chambers (Reference Chambers1995:66) said, social class has been the primary social variable in sociolinguistics, but the concept of the social network has become influential since Lesley Milroy started using it in the Belfast investigation. Networks function socially as a “norm enforcement mechanism” and as L. Milroy (Reference Milroy1987:179) put it, “the closer an individual's network ties are with his local community, the closer his language approximates to localized vernacular norms.” Chambers (Reference Chambers1995:67–68) claimed that social classes are also “norm enforcement mechanisms,” but that a person's network has a more direct influence.
In network studies, focus is on the individual. James Milroy (Reference Milroy1992:64) said, “speakers are ultimately responsible, not only for introducing and adopting linguistic changes, but also for maintaining diversity in language status” and demonstrated how nonstandard forms are maintained by social pressure.
Personal network structure is influenced by a large number of factors. L. Milroy (Reference Milroy1987:139–144) measured the relative density (number of links between individuals) and multiplexity (the content of links between individuals) of personal networks and used indicators of density and multiplexity to construct a network strength scale. In comparing the structure of the network, she found that in Ballymacarrett, the area in Belfast where the gender differentiation is sharpest and the men use more local variants than the women do, the male network patterns proved to be more close-knit than the female ones.
Pedersen (Reference Pedersen and Nordberg1994) also investigated the structure of the network and its significance for language use in her study of Vissenbjerg, a small town in Denmark; the degree of dialect use co-varies with the nature of the network. In her study, men have substantially higher network scores than the women do.
Both in Ballymacarrett and in Vissenbjerg, there is a correspondence between men's use of local variants and their close-knit networks. Also in other communities where men use more vernacular speech than women do, the explanation might be that the men have higher network scores than the women do.
In the present study, an index was constructed to measure the individual's relationship to the local community. All informants answered questions relevant to assessing their degree of social integration in Eskilstuna. The factors that make up this index are:
1. Place of birth/childhood/adolescence of spouse
2. Place of birth/childhood/adolescence of parents
3. Place of birth/childhood/adolescence of spouse's parents
4. Siblings, grown up in Eskilstuna whom you see regularly
5. Spouse's siblings, grown up in Eskilstuna whom you see regularly
6. Number of children
7. Number of native workmates
8. Number of native close friends
9. Number of local associations or organizations in which you are active
10. Willingness to move from Eskilstuna
11. Tendency to feel at home
12. Location of work.
These 12 factors have been given equal weight in the index, which ranges from 0 to 200.
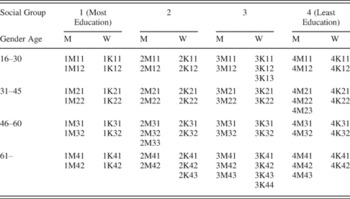
In the trend study, the figures are based on cell averages calculated on the included informants' percentage of standard forms. In the investigation of the 1960s, 30 cells were defined by gender, 3 social classes, and 5 age groups. In 1996, there were 32 cells defined by gender, 4 social groups, and 4 age groups (see Table 2). Instead of the traditional but now obsolete classification in 3 social classes, I have used the socioeconomic classification system that Statistics Sweden has developed and which has been in use since the 1980s. It is based primarily on occupation and number of years of education that are normally required for the occupation in question (Statistiska centralbyrån, 1995).Footnote 3 Four groups were formed such that group 4 includes occupations that normally require less than 2 years of postcomprehensive school education, for example, cleaner and porter, and group 1 includes occupations that require the most education, at least 6 years after comprehensive school, which normally means an academic degree. The age groups comprise blocks of 15 years, the youngest (age group 1) starting at 16. The age group 61–contains the oldest speakers including also people older than 75 who made up a group of their own in 1967. The influence of the extralinguistic and, where possible, the linguistic variablesFootnote 4 is compared with that in 1967.
The informants in the trend study 1996 categorized according to social group, age, and gender

Note: Each informant has a code, where the first figure shows social group, M is for man and K is for woman (in Swedish kvinna), the third figure shows age group, and the fourth figure is used to distinguish the informants in the same cell. For example: 3M31 = social group 3, man, 46–60 years old, informant no. 1.
RESULTS OF THE QUANTITATIVE ANALYSIS
In the following sections, each variable will be described separately, in two ways, first with a comparison between the influence of the independent social variables in 1967 and 1996, and second, with Variable rule analysis (Varbrul) of the 1996 data (see D. Sankoff, Reference Sankoff, Ammon, Dittmar and Mattheier1988:991–992), using the program IVARB (Pintzuk, Reference Pintzuk1988).Footnote 5 In the Variable rule analysis, for each factor in the different factor groups (independent variables), one arrives at a factor weight between 0 and 1, where a weight above .5 favors and below .5 disfavors the choice of, in this case, the standard variant. The independent variable with the greatest range (the highest factor weight in a group minus the lowest factor weight in the same group) is taken to have the strongest influence on the choice of variant (Poplack & Tagliamonte, Reference Poplack and Tagliamonte2001:93).
I have also made cross-tabulations to compare the influence of different factors in separate groups, for example, whether gender influences the choice of variant differently in separate age groups or to what extent stress has an influence on the choice of variant in different subgroups of speakers.Footnote 6
DefSingNeuter
The two variants of DefSingNeuter are constituted by the presence or absence of -t in the suffix, as in the Swedish word hus ‘house’, where the definite form is hus-et [ˈh ːsət] or hus-e [ˈhː sə], or, in neuter stems ending in -e, such as dike ‘ditch’, where the definite form is dike-t [ˈdiːkət] or dike-Ø [ˈdiːkə]. The t- form is the standard, but the t-less form has been the colloquial norm for centuries in Central and Northern Sweden.
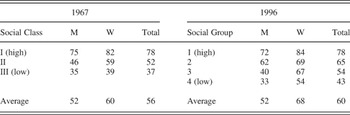
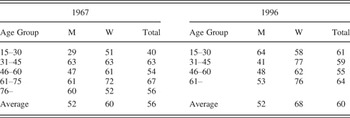
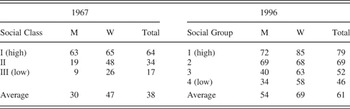
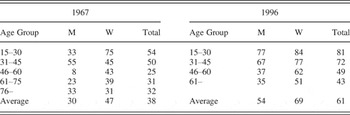
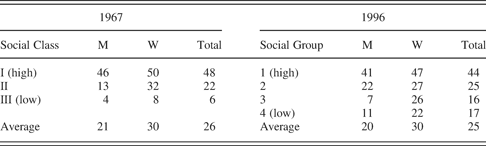
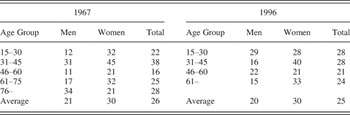
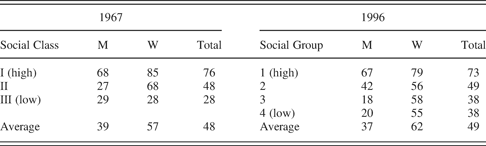
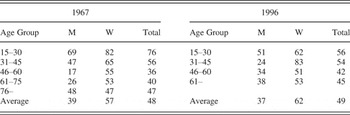
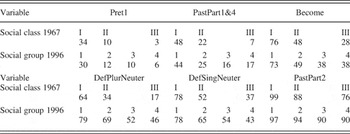
In the trend study, the use of the standard form has increased, but the difference is not substantial, 60% in 1996 as compared with 56% in 1967. Socioeconomic group is still a factor that influences the choice of variant to a great extent (see Table 3). Both in 1967 and in 1996, there is a high incidence of standard forms in the highest social group and a distinct gap between each group, ranging from 43% in the lowest to 78% in the highest group in 1996. The difference between age groups is not as marked as the difference between social groups (see Tables 3 and 4). In 1967, the youngest age group used the local variant to a much higher degree than the other groups, but in 1996, the age averages cluster around 60%. On average, women use more standard forms than men do, both in 1967 and in 1996.
The distribution of the variants according to social class and gender in 1967 and social group and gender in 1996 (DefSingNeuter cell average, percentage of -t)

The distribution of the variants according to age and gender in 1967 and 1996 (DefSingNeuter cell average, percentage of -t)

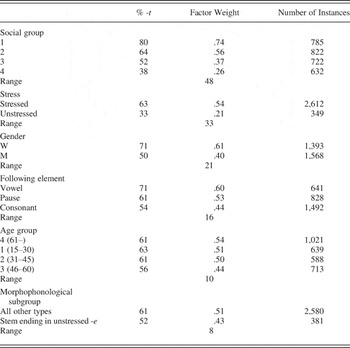
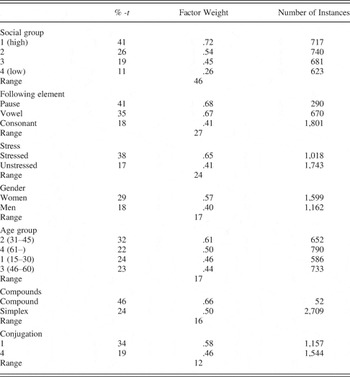
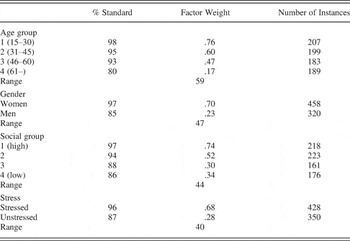
In the Variable rule analysis of the 1996 data, all extralinguistic variables were significant (see Table 5). In addition, the linguistic factors that have the strongest influence on the choice of variant are stress and the following phonological element (consonant, vowel, or pause). Unstressed position highly disfavors the choice of standard-t, a following vowel favors and a following consonant disfavors the standard form.
Multivariate analysis of the contribution of factors selected as significant to the probability of -t in DefSingNeutr

Input = .63, N = 2,961.
Note: Factor groups not selected: status of word (foreign vs. domestic word), proper nouns (as opposed to common nouns), compounds (as opposed to simplex words), case (the genitive with the suffix -s as opposed to the basic form).
In the calculation shown in Table 5, there are only two morphophonological subgroups. The nouns were originally categorized in eight subgroups, but the group that significantly disfavored the choice of standard in comparison with all other subgroups proved to be nouns ending in an unstressed -e. This subgroup includes the unstressed noun ställe in the frequent expression i stället för [i stεlə f ːr] ‘instead of’, where the t is seldom pronounced.
Maybe DefSingNeuter will never reach a point where the t-forms are entirely dominant. There are, for example, some frequent expressions containing unstressed nouns where the t is seldom pronounced, such as i stället för. We may envisage a situation where the variable has split into two morphological categories, one with t-forms almost exclusively and the other overwhelmingly t-less.
An idea regarding linguistic change has been that we tend to choose the variant that gives most information. Thus the Swedish Academy's Grammar (SAG) probably has this functional idea in mind when describing it as less common to drop t in the subgroup ending in an unstressed e (Teleman et al., Reference Teleman, Hellberg and Andersson1999, 2:101), because there is no difference between the definite and the indefinite form when t is not pronounced, for example, dike (see Table 1). However, there was no such pattern, neither in Nordberg's material from the 1960s, nor in mine from the 1990s. This shows that you have to quantify empirical data to see the distribution of variants and to understand how the choice of variants is governed.Footnote 7
DefPlurNeuter
The variants of DefPlurNeuter are the standard form, namely -en, as in hus-en [ˈh:sən] ‘the houses’ and barn-en [ˈbɑːɳən] ‘the children’, and the local forms -ena, hus-ena [ˈhːsəna], or just -a, barn-a [ˈbɑːɳa]. There is a complementary distribution between -ena and -a, the last-mentioned occurring after stems ending in n. In Eskilstuna, it is only by way of exception that -ena is found in this position.
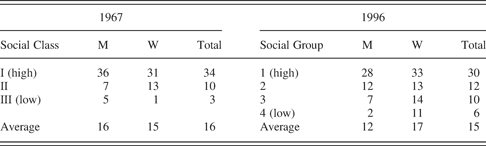
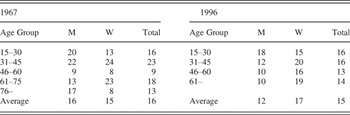
As far as DefPlurNeuter is concerned, the comparison between the entire sample of 1967 and the new sample of 1996 confirms the hypothesis that the local vernacular is giving way to standard language. There is an average of 38% standard forms in 1967 and 61% in 1996, and this generational change can be seen in all social groups, ages, and genders (see Tables 6 and 7). The social differences are still considerable, but the linguistic distance between the groups was greater in 1967 than in 1996. In 1967, the average percentages of standard forms in social classes II and III were rather low, which speaks in favor of the interpretation that, in 1967, this variable had not quite yet been established as a social marker.
The distribution of the variants according to social class and gender in 1967 and social group and gender in 1996 (DefPlurNeuter cell average, percentage of -en)

The distribution of the variants according to age and gender in 1967 and 1996 (DefPlurNeuter cell average, percentage of -en)

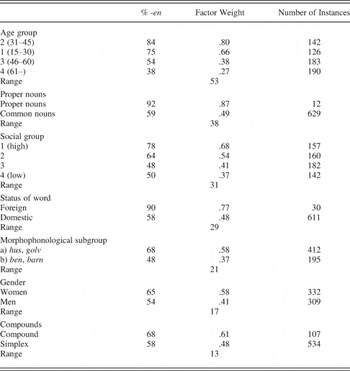
There is a difference between the generations both in 1967 and in 1996, so that the two youngest age groups use more standard forms than the older groups do. There is a distinct gap between the younger groups and the older groups. In 1996, women used standard forms more often than men did in all age groups, and the greatest difference was to be found in age groups 3 and 4, mostly owing to the low proportion of standard forms in the male groups. The Varbrul calculations (see Table 8) on the trend study show that all extralinguistic variables are significant, and age has the strongest effect.
Multivariate analysis of the contribution of factors selected as significant to the probability of -en in DefPlurNeutr

Input = .63, N = 641.
Note: Factor groups not selected: stress, following element; case was not included (the genitive with the suffix -s as opposed to the basic form; there are only 4 tokens of the genitive, all of them the standard variant, which means that there is a “knock-out” effect).
Concerning proper nouns and status of word (domestic words, such as hus, as opposed to foreign words, such as garage), there are few instances of proper nouns and foreign words; one must be suspicious of results when there are few tokens.
In the calculation shown in Table 8, there are only two morphophonemic subgroups. The nouns are categorized in five subgroups, but I have left three of the subgroups out of this description, as there were few instances of their usage. The two subgroups with many instances both have stems ending in stressed V + C/C/, and are:
a. C ≠ n, CC ≠ rn
b. C = n, CC = rn
A comparison between these two morphophonemic types shows that the group with the stem ending in -n (b) disfavors the choice of standard. This group contains the word barn ‘child’, where the standard is barnen and the local form barna. Barn is the dominating word in this group and, in 1996, also the most common word (93% [181 of 195] of all the instances). In 1996, there are still many local variants barna, 50% of the instances. In 1967, there were only 59 instances of the word barn (60% [59 of 98] of all the instances of the corresponding morphophonemic type), 53% of them were barnen, which was a high proportion of standard compared with the average of all instances of DefPlurNeutr, 33%. An explanation for the relatively high proportion of the standard in 1967 is that the men seldom talked about children at all, and the women in social group 2 had many instances of the word, mostly the standard variant.
Why are there still many instances ending in -a, when there has been a clear change from -ena to -en? One explanation might be that the local variant -ena is not easier to pronounce than -en. One of the factors that favor the local form -a is probably that barn is such a common and familiar word.
1DeclPlur
The variants of 1DeclPlur are the standard form -or, [ʊr], as in flick-or ‘girls’, and the local form -er, [ər], flick-er. A smaller number of informants have been investigated for this variable than for the others (51); the oldest age group has been left out. Only 21 of the 83 informants from 1967 had been analyzed for this variable, and I excerpted 8 in addition, which enabled me to compare 29 informants in the 3 youngest age groups from 1967 with the same age groups 1996.
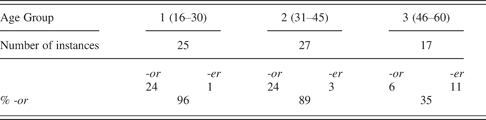
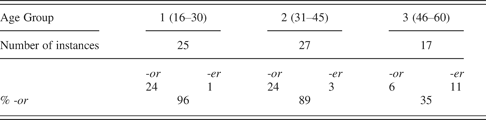
In the trend study, the cell average of standard forms was 7% in 1967 and 8% in 1996. The low number of standard forms in 1996, that is, the lack of change, was quite surprising as this is a variable that many people believe is progressively changing toward the written form. Many informants categorically use the nonstandard form both in 1967 (20 of 29) and in 1996 (32 of 51). Most of the standard instances in 1996 concern the word människor [ˈmɛnːɪɧʊr] ‘people’. When I leave out the 69 instances of that particular word, which was realized with -or 54 times, there are only 13 instances of -or left, out of more than 600. In 1967, there were 32 instances of the word människa, and 8 of them were realized as standard. In 1996, it was the 2 youngest age groups that displayed the highest frequency of the standard form människor (see Table 9). There has been a change here, but only on the lexical level, specifically, in the case of 1 lexeme.
The word människa: The distribution of-or/-er in 1996 according to age
According to Teleman et al. (Reference Teleman, Hellberg and Andersson1999, 2:64–65), -or is often pronounced -er in informal speech, but -or is becoming more and more common. Teleman et al. (Reference Teleman, Hellberg and Andersson1999:2:66) described a difference in pronunciation due to the status of the word and maintains that speakers would rather say for example (domestic) flicker ‘girls’ and gater ‘streets’ than (foreign) viller ‘villas’ and sebrer ‘zebras’. There are no such tendencies apparent in our material.
PastPart1&4
PastPart1&4 has the alternative inflections dans-at [ˈdanːsat]~dans-a [ˈdanːsa] ‘danced’, sjung-it [ˈɧɵŋːɪt]~sjung-i [ˈɧɵŋːɪ] ‘sung’. The standard is the form with the t pronounced. The regional distribution of the nonstandard form is somewhat wider than the corresponding variant of DefSingNeuter, which also lacks final -t.
There is hardly any difference between 1967 and 1996; the cell averages of standard forms are 26% and 25%, respectively. Many informants do not use any t-forms at all. In 1967, 27 informants—15 men and 2 women—did not use any t-forms, and, in 1996, 14 informants—12 men and 2 women—did not use any t-forms. In 1967, 1 woman used the t-form categorically, but in 1996, no one used the t-form categorically.
In 1967, the difference between the social groups was more salient, but there is still quite a difference between social group 1 and the other social groups in 1996 (see Table 10). The women in social groups 3 and 4, however, seem to have started changing toward the standard. The difference between men and women was about 10% both in 1967 and in 1996. In 1996, age groups 1 and 2 displayed a somewhat higher number of standard forms than age groups 3 and 4 (see Table 11). In 1967, the second youngest age group (age 31–45 years) displayed a higher proportion of t-forms than the other groups; in 1996, it is only the women in this age group who use a markedly higher proportion of standard forms than the other age groups.
The distribution of the variants according to social class and gender in 1967 and social group and gender in 1996 (PastPart1&4 cell average, percentage of -t)
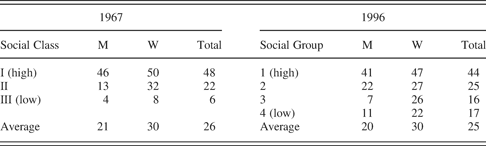
The distribution of the variants according to age and gender in 1967 and 1996 (PastPart1&4 cell average, percentage of -t)

In 1996, all extralinguistic variables were significant, and social group had the strongest effect on the choice of variant (Table 12). Linguistic factors also have a strong influence. In stressed position, the choice of standard is favored; in unstressed position, it is disfavored. A vowel or a pause following the participle favors the choice of standard; a consonant disfavors it. Verbs of the first conjugation (dansa-t) favor the choice of standard; there are fewer standard forms in verbs of the fourth conjugation (sjung-it), mainly because the frequent word vara, ‘be’, which is seldom stressed, belongs to this morphological group.
Multivariate analysis of the contribution of factors selected as significant to the probability of -t in PastPart1&4

Input = .20, N = 2,761.
Note: Factor groups not selected: status of word, s- form (the passive s as opposed to the active form).
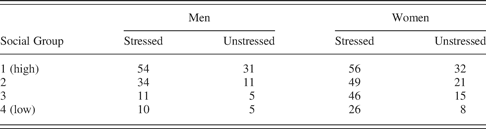
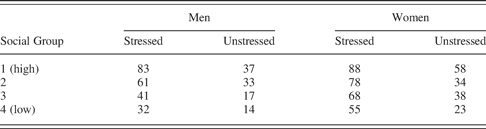
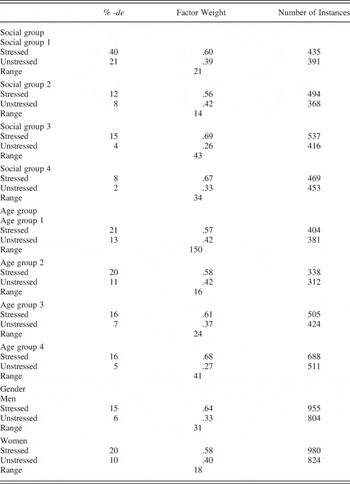
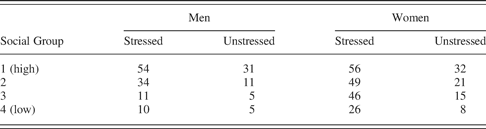
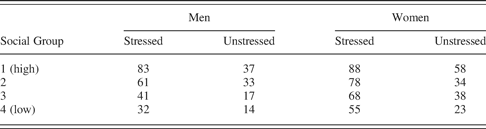
The impact of linguistic factors also shows some very interesting differences between 1967 and 1996, between the two variables DefNeuterSing and PastPart1&4, between the different social groups, and between men and women.Footnote 8 In 1967, stress increased the tendency to choose the standard form in all speaker groups in DefSingNeuter, whereas the difference between stressed and unstressed was insignificant in social class III in PastPart1&4. Nordberg's conclusion (1972:178–179) was that the standard t-form was the norm for all speaker groups in DefSingNeuter, whereas the t-less nonstandard form was still the norm in social class III in PastPart1&4. In 1996, stress increases the tendency to choose the t-variant in all social groups in both variables—see Tables 13 and 14—but concerning PastPart1&4 in social groups 3 and 4, the influence of stress is greater for women than men. This is also true of other linguistic factors. The tendency to choose standard increases more with the women than the men when an internal (linguistic) factor favors the choice of standard, which indicates that the women may be more aware than the men of the written norm.
The distribution of the variants according to stress, social group and gender in 1996 (PastPart1&4 cell average, percentage of -t)
The distribution of the variants according to stress, social group and gender in 1996 (DefSingNeuter cell average, percentage of -t)
PastPart2
The variants of PastPart2 are the standard forms ending in -t, such as bygg-t [bʏkːt] ‘built’, and the local forms ending in -i, bygg-i [ˈbʏgːɪ]. The dialectal distribution of the i-form is more restricted than that of the other nonstandard variants. It is never heard in public discourse or used by professional media staff and is commonly stigmatized. It has the status of a sociolinguistic stereotype.
The verb hava ‘have’ is an example of lexical diffusion. We know that the local form havi [ˈhɑːvɪ] ‘had’ has been common in the province of Södermanland (where Eskilstuna is situated). In 1967, there were some local forms in social class III, but not in the two youngest age groups, and in 1996, there is no local form at all, only the standard haft [hafːt].
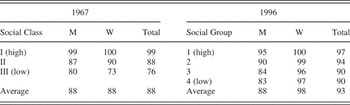
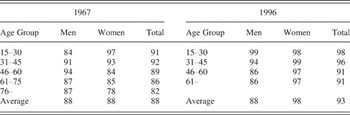
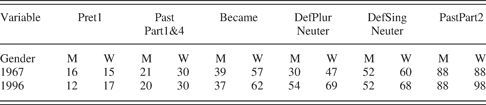
In the trend study, the use of standard forms has increased, from an average of 88% in 1967 to 93% in 1996. The women have increased their use of standard, from 88% to 98%, whereas the men use the same proportion of standard on both occasions, 88%. Thus, the average in 1967 was the same for men and women, but the women in social class III and in the three oldest age groups used fewer standard forms than the men (see Tables 15 and 16).
The distribution of the variants according to social class and gender in 1967 and social group and gender in 1996 (PastPart2 cell average, percentage of -t)

The distribution of the variants according to age and gender in 1967 and 1996 (PastPart2 cell average, percentage of -t)

Both in 1967 and in 1996, the two youngest age groups use less local forms than the older ones (see Table 16), and in 1996, there were only two informants in the youngest age group who used any local forms at all (not shown in Table 16).
In 1967, the total number of local forms was 119 (17.6%), and in 1996, it was 62 (5.2%).
The extralinguistic variables all have a significant influence on the choice of variant in 1996, age having the strongest effect (see Table 17).Footnote 9 Stress is the only linguistic variable with a significant impact on the choice of variant, with words in a stressed position more often pronounced according to the standard norm.
Multivariate analysis of the contribution of factors selected as significant to the probability of standard in PastPart2

Input = .98, N = 778.
Note: Factor groups not selected: following element, compounds, s- form (the passive s as opposed to the active form). Status of word is not a variable in PastPart2, as there were no foreign words.
Pret1
The standard form of Pret1 is -de, identical with the written form, dansa-de [ˈdanːsadə] ‘danced’, whereas the ending is absent in the local form, dansa-Ø [ˈdanːsa]. The dropping of -de is widespread in Swedish dialects.
Except for 1DeclPlur, Pret1 is the variable with the lowest amount of standard forms in the trend study, only 16% in 1967 and 15% in 1996. We can see the same pattern as in PastPart1&4. Pret1 has not changed toward the standard either, and there is still a marked linguistic distance between social group 1 and the other groups (see Table 18). In 1967, the difference between women and men, 15% as compared with 16%, is unsubstantial, but in 1996, the women used 17% standard and the men only 12%. The women in social group 4 seem to have started the change toward the standard, whereas the men in social groups 3 and 4 still seem to follow a local norm. On average, the two youngest age groups use standard forms more often than the older groups, both in 1967 and 1996 (see Table 19).
The distribution of the variants according to social class and gender in 1967 and social group and gender in 1996 (Pret1 cell average, percentage of -de)
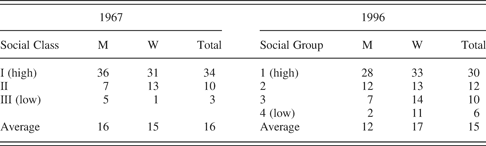
The distribution of the variants according to age and gender in 1967 and 1996 (Pret1 cell average, percentage of -de)

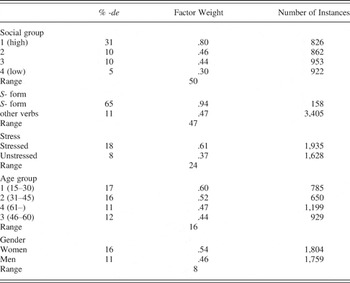
The Varbrul calculations show a significant effect for social group, gender, and age (see Table 20). With respect to the linguistic factors, both stress and s-form (in passive and deponent verbs) favor the choice of standard. There is a possible functional explanation as to why s-form favors the pronunciation of -de; you get the same form in the present tense as in the past, when -de is not pronounced, for example, han väntas [ˈvɛnːtas], ‘he is expected’ or ‘he was expected’, which in the standard is han väntades [ˈvɛnːtadəs].
Multivariate analysis of the contribution of factors selected as significant to the probability of -de in Pret1

Input = .10, N = 3,563.
Note: Factor groups not selected: following element, compounds, status of word.
The average of standard in stressed instances is 18%, compared with 8% in unstressed instances. In 1967, there was a difference between stressed and unstressed instances, too: 15% as compared with 10%, and it was greatest in social class I, with 39% standard in stressed and 28% in unstressed instances. The cross-tabulations in 1996 show that stress is significant in all groups (not shown in Table 20). All groups produce more standard forms when the words are in a stressed position, which probably implies that the written form has spread as a norm, which I will discuss below. However, there are differences between speaker groups in the strength of the stress factor group relative to the other independent variables in each analysis. Table 21 shows the results for stress in independent Varbrul analyses for different speaker groups. The magnitude of effect of stress is relatively greater in social groups 3 and 4 than in social groups 1 and 2. It is also greater in age groups 3 and 4 than in age groups 1 and 2, and it is greater for men than for women. Therefore, the magnitude of effect of stress is greater in the groups that use most local forms. This probably shows that all these groups are aware of the standard norm. There were no significance tests run in Varbrul in 1967, but as the percentage differences between stressed and unstressed were small in social groups II and III in 1967, these groups were probably not as aware of the standard norm as social groups 3 and 4 in 1996.
Pret1: The varying influence of stress in the different social groups, age groups, and gender groups in 1996

Become
The verb form became has the standard variant blev [bleːv] and the local variant vart [vaʈː], the preterit of two completely different words. The average usage of the standard form in the trend study has hardly changed at all; it was 48% in 1967 and 49% in 1996. On both occasions, more than half the informants do not vary their use of variant; they make consistent use of either blev or vart. In 1996, 20 informants used only blev with 21 only using vart. Social category influences the choice of variant to a great extent in 1996 as well as in 1967, and on both occasions, there is a high score of standard forms in social group 1 and the greatest linguistic distance between that group and the others (see Table 22). Men have slightly decreased their use of standard, from 39% to 37%, but the women display a clear increase, from 57% to 62%, largely due to the contribution from women in social groups 3 and 4. In 1996, women used more standard forms than men did in all social groups. In 1967, the women used more standard forms than the men did in social classes I and II. However, in social class III, it was reversed, and the older women in social class III hardly used any standard forms at all (not shown in Table 22). Differences between the age groups were clear both in 1967 and 1996; the two youngest age groups used a much higher proportion of blev than the older groups did (see Table 23).
The distribution of the variants according to social class and gender in 1967 and social group and gender in 1996 (Become cell average, percentage of blev)
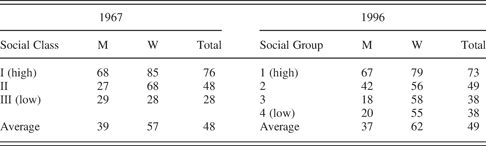
The distribution of the variants according to age and gender in 1967 and 1996 (Become cell average, percentage of blev)

Become is a salient variable, as we will discuss, which might be a reason why the difference between men's and women's choice of variants is so great (26 percentage points in 1996). Its salience might contribute to men choosing the local variant and women avoiding it. The variant vart may have covert prestige (cf. Trudgill, Reference Trudgill1972) with the function of showing toughness, marking their belonging to the local (male) community.
The choice of variant is influenced by the complement of the verb. Adjectives are the most common predicative complement, followed by nouns. See the following examples:
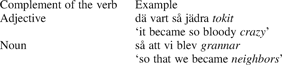
The complement in 34.3% of the instances (309) is an adjective, and in 24.4% of the instances (220), a noun. The variant blev is chosen in 50% of the instances with an adjective as complement, whereas the same variant is chosen in 41% of the instances when the complement is a noun.
DISCUSSION OF THE RESULTS
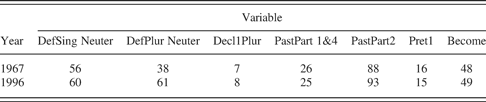
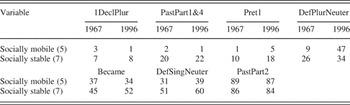
The vastly held opinion in Sweden that the seven variables in question are in the process of more or less rapid change toward the standard forms of the written language is not supported by my data. The rate of change at the level of the community is low, apart from DefPlurNeuter (see Table 24).
The distribution of the variants in 1967 and 1996 (cell average, percentage of standard forms)
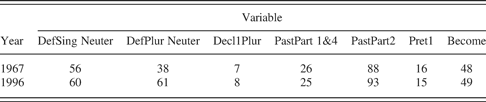
Different factors may be assumed to have influenced the rate of change of these variables. One such factor is the variable's position in the process of change. Change is usually slow at the beginning, speeds up in the middle of the process, and slows down toward the end, as illustrated by the well-known S-curve (see for example Chen, Reference Chen1972; Wardhaugh, Reference Wardhaugh2002:210). DefPlurNeuter appears to be in the middle of the process. 1DeclPlur, Pret1, and possibly also PastPart1&4 appear to be in the initial phase; whereas PastPart2 and possibly DefNeutrSing may be close to or even in the final phase of their change toward standard language. Note, though, that the proportion of blev is practically the same in 1967 and 1996. As this variable had almost 50% standard usage in 1967, it would be expected to be in the middle and allegedly swiftest phase of the process.
Our informants are Eskilstuna natives and not geographically mobile, which is something that has probably led to their tendency to use local speech. In 1967, Eskilstuna was a flourishing industrial town; in 1996, Eskilstuna suffered from stagnating, even decreasing, population figures and a receding economy with high unemployment and a high demand for social benefits compared with communities of equal size. The social, demographic, and economic changes in Eskilstuna during the period in question can be argued to be contributors to relative linguistic stability.
Probably the rate of change toward standard forms is slower than has been assumed because the norm in Swedish media has become less formal than in the 1960s. In the 1990s, the use of dialect and informal language on television increased. In spite of this, standard speech is still viewed as the norm; people complain that spoken language has deteriorated.
Although use of the standard forms has not increased much on average, there have been changes in the relationship between social groups, between men and women, and between age groups. Social and age differences have decreased, whereas gender differences have increased.
Social category
Social category is a factor that influenced the choice of variant to a great extent in 1996 as well as in 1967. Table 25 gives an overview of the distribution of the variants according to social group in 1996 compared with social class in 1967. From now on, the variables are presented from the variable with the lowest share of standard in 1996 to the variable with the highest share of standard in 1996. 1DeclPlur is omitted because there are few standard forms at all.
Distribution of the variants according to social class in 1967 and social group in 1996 (cell average, % standard)

On both occasions, there is a high incidence of standard forms in the highest social group and a distinct interval between the groups (except for the interval between social groups 3 and 4 in 1996, which in some variables is small or nonexistent). This difference is significant, but it was more pronounced in 1967 than in 1996. In all the variables, the decreased difference between social groups is the result of social groups 3 and 4 having increased, and social group 1 decreased their use of standard forms (except for DefPlurNeuter, where all social groups show a considerable increase of standard forms). In 1967, linguistic distance was greatest between social class I and II (with the exception of PastPart2, where the gap between social class II and III was about the same as that between I and II). The 1967 pattern with a more pronounced gap between the highest social group and the others seems to be typical of a change from above in its early phase (see Nordberg, Reference Nordberg1985:26). In 1996, we could still see this pattern in the variables that have not changed toward the standard since 1967.
It is evident that differences in speech patterns between social groups have diminished during the 30 years, which is perhaps not what one would expect in view of claims from sociologists that social inequality has increased in Sweden during the 1990s (e.g., Ahrne, Roman, & Franzén, Reference Ahrne, Roman and Franzén2000). However, the linguistic reaction to social change is unlikely to be that fast, at least not on the morphological level. Before the 1990s though, there was more than a century of increasing equality; perhaps the diminishing differences that can be seen between 1967 and 1996 are a late result of that process.
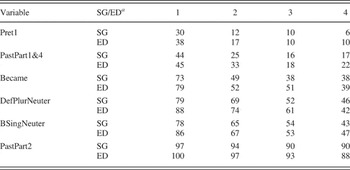
In addition to the classification according to social group, I classified the 1996 informants according to their actual education.Footnote 10 With the classification based on the informants' education, the linguistic difference is accentuated in almost all the variables, more so in DefPlurNeuter than the other variables, which is what you can expect from a variable in its most dynamic phase of change (see Table 26).
Comparison between the distribution of the variants in the trend study 1996 according to social group and to actual education (cell average, % standard)

aSG = social group, ED = actual education.
I have also taken into consideration social mobility by comparing socially upwardly mobile speakers with socially stable speakers. The expectation would be, naturally enough, for upwardly mobile speakers to increase their use of standard forms more than others (cf. Labov, Reference Labov1966b). I have calculated an average of standard forms for each informant over the six variablesFootnote 11 in question to compare this “standard index” with different factors. The upwardly mobile informants in the trend study actually have a higher average of standard forms over the six variables than the stable informants, 52% standard versus 43%. However, these figures are skewed by the fact that the majority of the upwardly mobile are found in social groups 1 and 2 and, vice versa, the stable (and downwardly mobile) in social groups 3 and 4.Footnote 12
Gender
On average women used more standard forms than men did both in 1967 and in 1996 (see Table 27), but in some subgroups the reverse was true in 1967. On the whole, older women in social classes II and III and the majority of the women in social class III maintained traditional spoken forms to a greater extent than the men in the same groups. Nordberg's explanation (1985:32) of this was that the older women, especially in social class III, have not been influenced by the change of, or the questioning of, the traditional female domestic role and had fewer contacts outside the home. In 1996, however, women in these groups also used more standard speech than the men did.
Distribution of the variants according to gender in 1967 and 1996 (cell average, percentage of standard forms)
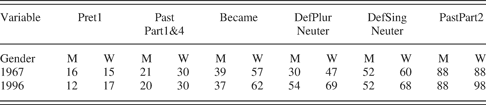
In 1996, the difference between men and women was most significant in age group 2 (31–45 years old). In this age group, the difference between men and women is about 30 percentage points; men have a standard index of 38% and the women 66%. In 1967, both men and women in this age group had a high percentage of standard forms, possibly because people at that age are more influenced by the prestige norms of the community (cf. Nordberg, Reference Nordberg1985:28–29).
Why does gender influence the choice of variant more in the 1990s than 30 years earlier? This was an unexpected result. In the 1960s, a possible explanation could be that women had a more insecure social position than men did, which might contribute to their greater use of standard forms (cf. Nordberg, Reference Nordberg1985:32). Equality between men and women has doubtlessly advanced over the last generation, at least concerning influence in public life so, following this line of reasoning, a greater influence should have been observed in the 1960s.
It is a well-known pattern seen in many sociolinguistic studies that women use fewer nonstandard variants than men of the same social group and age and in the same contexts. According to Jennifer Coates (Reference Coates1993:86), “it is still little understood” why women use more prestige forms.
One explanation might be that women typically have different occupations than men, and I have tested this hypothesis on my data. Analysis according to the marché linguistique (Bourdieu & Boltanski, Reference Bourdieu and Boltanski1975), usually translated as the linguistic market (but Chambers [1995:178] suggested “marketplace dialect” as a more appropriate translation), has shown a tendency to use more standard when you have occupations where language is used integrally (Chambers, Reference Chambers1995:180). Examples of early studies that showed the influence of market pressures on speech are Sankoff and Laberge (Reference Sankoff, Laberge and Sankoff1978) and Sankoff, Cedergren, Kemp, Thibault, and Vincent (Reference Sankoff, Cedergren, Kemp, Thibault, Vincent, Fasold and Schiffrin1989).
The informants have been categorized according to the role of language in their daily work. Three categories were distinguished:
+ = produces language, for example, teacher, journalist, secretary
− = does not produce language, for example, bricklayer, cleaner, different kinds of factory work
Mix = a mixture of producing and not producing language, for example, shop assistant, assistant nurse, foreman.
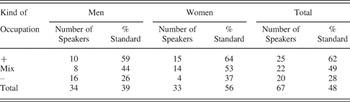
The correlation between kind of occupation and degree of standard is obvious (see Table 28).
Sixty-seven informants acategorized according to occupation (speaker average of standard forms over the six variables)

a Five informants were too young to be categorized according to occupation.
Those who have an occupation in which they regularly produce language use more standard forms than those who less regularly produce language, and they in turn use more standard forms than those who do not produce language at all. The pattern is the same in all subgroups, for example, men in social group 3 or women in age group 4 (not shown in Table 29). It is also the case that many more men than women have occupations categorized as –. Thus, one of the explanations why the women in Eskilstuna use more standard forms than the men do is that the women are in professions that involve active use of language. This cannot, however, be the only explanation. In all three categories, men use fewer standard forms than women do. Even if one takes into consideration men's and women's different occupations, the dominating impression is that there are different norms for men and women.
I have tried to discern patterns of correlation between the integration index and the choice of variant. I have divided the different subgroups, for example, the men in social group 1 or the women in age group 2, into two groups according to their integration index, one half with the informants who have the highest integration index in the subgroup in question and the other half with the lowest index, and compared the two groups. There is an overall pattern in all the variables: the men with the highest integration index in social groups 1, 2, and 3, respectively, display a higher average of local forms than the other men do, but there is no such pattern for the women. I have also compared the informants' average of standard forms with the integration index. In social group 1, the four men with the highest integration index have an average of 56% standard forms versus 68% for the other four (that is 44% local forms versus 32%), and the same pattern is found also in social groups 2 and 3. In social group 2, the corresponding figures are 43% (local forms: 57%) as compared with 57% (local forms: 43%) and in social group 3, 26% (local forms: 74%) compared with 35% (local forms: 65%). In social group 4, the difference is only small, an average of 16% standard forms (84% local forms) for the five men with the highest integration index, and 18% (82% local forms) for the five men with the lowest integration index. This means that the more integrated the men in these groups are, the more local forms they use.
It is not the case, as has been shown in other investigations (e.g., L. Milroy, Reference Milroy1987; Pedersen, Reference Pedersen and Nordberg1994), that on the whole men are more integrated in the local community than women are. Consequently, in Eskilstuna, one cannot explain the fact that men use more local speech than women do by referring to their greater integration in the local community. Men who are more integrated in the local community than other men belonging to the same social group, however, have a tendency to use more local forms, whereas this is not the case with women. Men in Eskilstuna demonstrate their local identity linguistically to a higher degree than women do. In this way, men, even those in higher social groups, can show their identification with the local group and its values. Both men and women with a high integration index most likely feel that the community offers a good life, but it is only for the men that the local variety seems to have a prestige of its own.
Gender, social integration, and mobility in the panel study
Concerning gender, social integration, and mobility, the panel study gives much complementary information. In the panel study of 13 informants, I can look at the same individuals and see their choice of variants in 1967 and 1996 and compare the speakers who have been upwardly mobile socially since 1967 with the socially stable speakers. I have correlated the average of standard forms in each variable with social mobility. As shown in Table 29, DefPlurNeuter is the only variable where the upwardly mobile speakers show a more pronounced increase of standard forms than the socially stable speakers do. In Table 29, the order of the variables is from the lowest average of standard to the highest average of standard in the 1996 panel study.
Comparison between socially mobile and socially stable informants in the panel study (speaker average, % standard forms)

One reason why upwardly mobile persons in the panel study tend to retain their local variants might be that they have moved upward without having much education and have now reached positions that normally require postcomprehensive schooling. Another possible explanation is that they are well integrated in Eskilstuna. It is probably because of their integration in the local community and their local contacts that many men in Eskilstuna have been able to advance socially. Socially mobile individuals actually have a higher integration index than informants who can be classified as socially stable. A good example of men retaining their local speech is a couple of men who have advanced to social group 1, and in spite of this, they have not changed their speech toward standard at all. They even use more local variants than they did 29 years before.
It is also true of the trend study that individuals who can be classified as socially upwardly mobile on average have a higher integration index than the informants who can be classified as socially stable. It was difficult to find native informants belonging to social group 1, and of those I found, the majority had worked their way up without the normally required education for this group (an academic exam). Many men who have advanced socially are well integrated in Eskilstuna. It has supported them both in making a career and keeping their local way of speaking.
Some concluding remarks on gender
It is true that society has become more equal in many ways since the 1960s, but on the other hand, gender stereotypes have become more accentuated in entertainment, commercial advertising, and the media (see Nordberg & Sundgren, Reference Nordberg and Sundgren1999). Women are often presented and judged by the media according to who they appear to be more than by what they actually do. According to Chambers (Reference Chambers1995:136–137), gender roles overlap almost entirely in modern industrial societies, and he proposed that there are biological differences that give women an advantage in verbal ability. I disagree; even in a modern society that might seem equal, there are social constructions of gender that lead to different attitudes to men and women who behave the same under the same conditions. A woman who uses many nonstandard variants is probably judged more negatively than a man who does the same.
Rather than asking why the women use standard speech more often than the men, it is perhaps more relevant to ask why the men still use so many local forms, especially as the expectation was that the variables would have moved rapidly toward the standard. As already mentioned, Become is a salient variable, and it is a good example of men favoring the local form when women prefer the standard; in 1996, 63% of the time men chose to use the local form vart, whereas women chose the standard blev 62% of the time. Gender as an independent variable has the strongest effect on the choice of variant on the variables where the local variant deviates most from the standard, namely Become and PastPart2, which is in accordance with women's tendency to avoid local forms and men's tendency to mark their local belonging by choosing them. Men do not show their social status through language to the same degree as women, but they show their solidarity with the local community.
Two groups of variables
The variables have been divided into two groups according to their salience, that is, their degree of linguistic and sociolinguistic markedness.Footnote 13 The frequently occurring variables in the first group—DefSingNeuter, PastPart1&4, and Pret1—are characterized by -t/de-deletion, and, judging from several criteria, less salient than those in the second group—PastPart2, DefPlurNeuter, Become, and 1DeclPlur. Factors that have been considered in determining an item's degree of salience are metalinguistic awareness and the degree to which the variable is an object of overt comment and public discussion, the degree of linguistic dissimilarity of the standard and the local variants, and their conspicuousness in running speech. The role of salience in language change is equivocal, however—salience may be conducive both to maintenance of a feature and to its disappearance (cf. Hinskens, Reference Hinskens1996:17–18; Trudgill, Reference Trudgill1986:11).
The regional extension of the nonstandard variants also has an impact on the rate of change: the larger the area of use, the more likely that people will go on using the local variant (cf. Thelander, Reference Thelander1979). The most geographically restricted variable is PastPart2. Furthermore, there is an observable pattern in the distribution of the three variables containing -t/de-deletion. The deletion is most widespread in Pret1, then in PastPart1&4, and finally in DefSingNeuter. This order corresponds well with the geographic distribution of the variants from less to more geographically restricted, and with the rate of change from less to more rapid.
The variation according to social category, age, and gender is significant in almost every variable. Nevertheless, the age variation is clearly more important measured by Varbrul range in the more salient group of variables. With respect to linguistic factors such as stress and the following phonological element, these carry more weight relative to social factors among the less salient group of variables than among the more salient one. One could argue that linguistic factors influencing the variation are more permanent, more unconscious, and more mechanical than the extralinguistic factors and thus slow down rather than speed up the change.
Lexical diffusion
There has been a long-standing discussion as to whether a sound change is regular, affecting all words with the phonetic environment equally, that is all words at the same time, or spreads through lexical diffusion, affecting one word after the other, as described in Jaberg's often-cited assertion (Reference Jaberg1908), that “each word has its own history.” Several Chinese investigations (e.g., Chen & Wang, Reference Chen and Wang1975) gave support to the theory of lexical diffusion. Labov (Reference Labov1994:541–543) concluded that lexical diffusion is not the fundamental mechanism. The typical sound change is regular to start with when the speaker is not aware of it (change from below), while lexical diffusion is most characteristic of the late stages of a change, when it has reached social awareness (change from above).
As regards the variables I have analyzed, the change seems to proceed more swiftly in certain morphological or lexical subgroups. There is some evidence for lexical diffusion, which is what can be expected more from morphological changes from above than from sound changes, which are more mechanical, at least in the initial phases of change (cf. Labov, Reference Labov1994:541–543). Barn is a word where almost as many local forms were used in 1996 as in 1967, in spite of the fact that the variable DefPlurNeuter as a whole had moved swiftly toward the standard. As regards 1DeclPlur, only one word, människor, showed more standard instances in 1996 than in 1967, a change from 25% standard in 1967 to 78% in 1996, whereas there was no change toward the standard at all when människor was excluded—5% standard in 1967 and 2% standard in 1996. A third example of lexical diffusion is that the local form havi (PastPart2) could still be heard in Eskilstuna in 1967, but a generation later, everybody used the standard haft.
An overview of some factors that have been used to explain linguistic variation and change
Some internal factors that have been used to explain linguistic variation and change are that we choose variants that require less effort to pronounce, that we strive to avoid semantic merging and that we aim to keep or increase the regularity of the linguistic system. Table 30 contains a summary of the answers to the following questions. For what variables does the change toward standard mean that less effort is needed to pronounce the variants? For which variables is semantic merging avoided? For which variables is the regularity of the linguistic system increased? Some variants are difficult to categorize according to these criteria, and an answer within parentheses means that it is debatable.
What does a change toward standard variants mean concerning pronunciation, semantic merging, and regularity?

aThe word papper is both singular and plural of ‘(a piece of) paper’, whereas pappor is ‘fathers’. Thus, when the plural of the word pappa, ‘father’, is pronounced with the local ending -er, it is pronounced indistinguishably from the Swedish word for ‘(a piece of) paper’.
With respect to ease of pronunciation, perhaps the change in DefSingNeuter, PastPart1&4, Pret1, and 1DeclPlur is slowed down also because a speaker must use more energy to pronounce standard forms than for corresponding local variants. Loss of a final element is common in spoken language; final -t/de-deletion is phonetically motivated (see Lass, Reference Lass1984:187, 199). Regarding 1DeclPlur, the local ending [ər] is also easier to articulate than the standard [ʊr]; in Swedish, [ə] is often used as a variant of /e/ in unstressed syllables (Engstrand, Reference Engstrand2004:67).
When trying to explain linguistic variation and change, functional arguments have often been used. As regards my material, the only instance where a functional explanation works concerns Pret1, where the s-form favors the pronunciation of -de; by choosing the standard form, a speaker avoids using the same form in the past as in the present tense. Labov (Reference Labov1994) found that functional arguments for sound change have been overestimated, and he concluded (p. 568):
In the stream of speech, one variant or the other is chosen without regard to the maximization of information. On the contrary, the major effects that determine such choices are mechanical: phonetic conditioning and simple repetition of preceding structure.
The other variables that should have changed toward the standard according to functional predictions have in fact remained stable (DefSingNeuter, yrke; PastPart1&4, and possibly Decl1Plur; Become).
Regarding structural regularity in the linguistic system, a change toward the standard involves an increase of the regularity for some variables, and a decrease for some. Nordberg (Reference Nordberg1972:212–213) pointed out that the development concerning DefPlurNeuter could shed light on the strength of the social extralinguistic factors compared with the strength of the linguistic grammatical structural factors, and his prediction was that the standard variant -en might never be carried through to all social and age groups. In spite of the fact that the en-form deviates from the other Swedish nouns in the definite plural, all of which end in V + (r)na, the change toward this variant has been swift. Thus, the development for DefPlurNeuter between 1967 and 1996 seems to indicate that social forces have more influence when it comes to choice of variant than linguistic forces.
CONCLUSIONS
I have demonstrated how seven morphological and morphophonological variables have changed or remained stable over a period of 30 years. The rate of linguistic change at the level of the community is low. Linguistic change has probably always been slow, but it is strange that the change toward the standard forms has not been more rapid, considering how dynamic our culture is in other areas. I have discussed various explanations for the unexpectedly low rate of change.
How representative is Eskilstuna of other Swedish towns? The economic and social situation in the mid-1990s was more difficult than in other communities of comparable size. On the other hand, the Eskilstuna of the 1990s was more similar to other Swedish communities with regard to socioeconomic structure, and improved communications also contribute to making Eskilstuna more integrated into the wider society than it was in the 1960s.
In the Nordic countries, two other investigations also demonstrate a slow process of change. Sandøy (Reference Sandøy, Ivars and Slotte2000) calculated that the merger of /∫/ and /ç/ in Norwegian will take more than 200 years before it is completed, and Paunonen (Reference Paunonen and Thelander1996:384) concluded that the change in Helsinki colloquial Finnish from synthetic to analytic possessive constructions of the first person singular “has not progressed considerably within a generation of speakers as a whole.” Labov (Reference Labov2001), however, demonstrated how swiftly the change of the front vowel system spread throughout the United States.
I also want to add that attitudes to local speech have changed in Sweden; probably some of the variables analyzed will never reach 100% standard use. Since the 1980s, spoken language in the media has become increasingly informal. In more and more programs, different varieties can be heard, including local speech and dialect.
Apparent-time studies give much information on the linguistic variation and change in a community, and many, but not all, of the inferences Nordberg could make from the analyses of the extra- and linguistically conditioned variation in the 1960s have been proven correct. There are also unexpected results, however, that demonstrate a need for quantitative investigations with long intervals to determine whether changes continue as the apparent-time data suggest.
In my study, social mobility and integration in the local community are factors that have added information to the knowledge gained from the correlations of linguistic behavior with the traditional extralinguistic variables. However, I agree with Labov (Reference Labov2001:327) who in his discussion of social network studies maintained that “social class, age, gender, and ethnicity will continue to explain the greatest part of the variance.” We need a representative sample of the wider community to be able to interpret the sociolinguistic behavior of the individual or the small group.
It is a combination of different factors that determines how language changes. Extralinguistic factors have a great impact on the variation in all the variables I have examined, but linguistic factors also contribute to how slowly or swiftly changes proceed.
Do linguistic and extralinguistic factors work independently of each other, or are linguistic factors dependent on extralinguistic factors? Stress is an example of a linguistic factor that has a significant impact only in groups where the standard (t-form in DefSingNeuter and PastPart1&4) is the norm. When a word is stressed, it probably makes the speaker more aware of how he or she pronounces the word. Stress on an individual word tends to increase the likelihood of standard usage in all groups that want to use the standard prestige variant. Thus, the impact of stress is dependent on social factors.
In many variables, though, linguistic factors might work independently of extralinguistic factors and have the same impact on the variation over a long period. The changes are socially motivated. The choice of variants has a social and/or stylistic function and, when there are changes in the social groups in a speech community, this may also lead to changes in the linguistic system. Many conflicting forces govern linguistic change, but the conclusion to be drawn from these data is that an individual's often unconscious choice of variant functions to create, indicate, maintain, or change his or her social identity, which means that social forces are decisive of how language changes (or not).