1. Introduction
1.1. Non-reversible Metropolis kernel
Markov chain Monte Carlo methods have become essential tools in Bayesian computation. Bayesian statistics has been strongly influenced by the evolution of these methods. This influence is well expressed in [Reference Green, Łatuszyński, Pereyra and Robert22, Reference Robert and Casella48]. However, the applicability of traditional Markov chain Monte Carlo methods is limited for some statistical problems involving large data sets. This has motivated researchers to work on new kinds of Monte Carlo methods, such as piecewise deterministic Monte Carlo methods [Reference Bierkens, Fearnhead and Roberts10, Reference Bouchard-Côté, Vollmer and Doucet11], divide-and-conquer methods [Reference Neiswanger, Wang and Xing42, Reference Scott56, Reference Wang and Dunson64], approximate subsampling methods [Reference Ma, Chen and Fox37, Reference Welling and Teh65], and non-reversible Markov chain Monte Carlo methods.
In this paper, we focus on non-reversible Markov chain Monte Carlo methods. Reversibility refers to the detailed balance condition which makes the Markov kernel invariant with respect to the probability measure of interest. Although reversible Markov kernels form a nice class [Reference Kipnis and Varadhan30, Reference Kontoyiannis and Meyn31, Reference Roberts and Rosenthal50, Reference Roberts and Tweedie53], the condition is not necessary for the invariance. Breaking reversibility sometimes improves the convergence properties of Markov chains [Reference Andrieu and Livingstone2, Reference Diaconis, Holmes and Neal14, Reference Diaconis and Saloff-Coste15].
However, without the detailed balance condition, constructing a Markov chain Monte Carlo method is not an easy task. There are many efforts working in this direction, but there are still large gaps between the theory and practice. The guided-walk method for probability measures on one-dimensional Euclidean space, proposed by [Reference Gustafson23], sheds light on this direction. Its multivariate extension has also been studied, in [Reference Ma, Fox, Chen and Wu38], but this is still based on a one-dimensional Markov kernel. In this paper we consider a general multivariate extension of [Reference Gustafson23], termed the guided Metropolis kernel. To do this, we first briefly describe the method of [Reference Gustafson23].
In the algorithm proposed in [Reference Gustafson23], a direction variable is attached to each state
 $x\in\mathbb{R}$
, which is either the positive
 $(\!+\!)$
direction or the negative
 $(\!-\!)$
direction. If the positive direction is attached, the new proposed state is
 \begin{equation}x+|w|,\end{equation}
where x is the current value and w is the random noise. If the negative direction is attached, the new proposed state is
 \begin{equation*}x-|w|. \end{equation*}
The proposed state is accepted as the new state with the so-called acceptance probability. If the proposed state is accepted, the new state is assigned the same direction as the previous state. Otherwise, the opposite direction is assigned to the new state, and the new state is same as the previous state.
If we want to generalise this procedure to a more general state space, say E, we may need to interpret the summation operator
 $+$
in (1) differently, since, for example,
 $\mathbb{R}_+$
is not closed with the operation. So we have to find a state space that has a suitable summation operator, in other words, a group structure. For this reason, throughout this paper we consider an abstract setting, as this is the most natural way to describe our setting and algorithms.
More precisely, the main idea of our method is to introduce a projection which maps a state space E to a totally ordered group. Through this ordering we will decompose any Markov kernel into a sum of positive (
 $+$
) and negative (
 $-$
) directional sub-Markov kernels. By using rejection sampling, two sub-Markov kernels are normalised to be positive and negative Markov kernels. Then we can construct a non-reversible Markov kernel on
 $E\times\{-,+\}$
by systematic-scan Metropolis-within-Gibbs sampler. Similar ideas can be found in [Reference Gagnon and Maire20] for the case of a discrete state space.
Usually, total masses of sub-Markov kernels are quite different, which results in inefficiency of rejection sampling. To avoid this issue, we focus on the case where the total masses are the same. However, it is non-trivial to find such a Markov kernel. In [Reference Gustafson23], the Lebesgue measure is the basis for constructing the Markov kernel so that sub-Markov kernels have equal total masses. To generalise [Reference Gustafson23], we use the Haar measure on a locally compact topological group as a generalisation of the Lebesgue measure on
 $\mathbb{R}$
. We interpret the negative (−) sign as the inverse operation of a topological group, and we will use the Haar measure so that the inverse operation does not change the measure.
By using Haar measure, we introduce a novel Markov kernel termed the Haar mixture kernel, which has the above property. This is achieved by introducing a topological structure into the totally ordered group that defines a direction in E. Our proposed method, the
 $\Delta$
-guided Metropolis–Haar kernel, is constructed by using the Haar mixture kernel as a proposal kernel. By using this, we introduce many non-reversible
 $\Delta$
-guided Metropolis–Haar kernels which are of practical interest.
1.2. Literature review
Here we briefly review the existing literature studying non-reversible Markov kernels that modify reversible Metropolis kernels. First of all, compositions of reversible Markov kernels are not reversible in general. For example, the systematic-scan Metropolis-within-Gibbs sampler is usually non-reversible.
The so-called lifting method is considered in, for example, [Reference Diaconis, Holmes and Neal14, Reference Gagnon and Maire20, Reference Turitsyn, Chertkov and Vucelja62, Reference Vucelja63]. In this method, a Markov kernel is lifted to an augmented state space by being split into two sub-Markov kernels. An auxiliary variable chooses which kernel should be followed. The guided-walk kernel [Reference Gustafson23] and the method we are proposing belong to this category. Another approach is to prepare two Markov kernels in advance and construct a systematic-scan Metropolis-within-Gibbs sampler as in [Reference Ma, Fox, Chen and Wu38].
The Hamiltonian Monte Carlo kernel has an auxiliary variable by construction. Therefore, a systematic-scan Metropolis-within-Gibbs sampler can naturally be defined, as in [Reference Horowitz26]. Also, [Reference Tripuraneni, Rowland, Ghahramani and Turner61] constructed a different non-reversible kernel which twists the original Hamiltonian Monte Carlo kernel. See also [Reference Ludkin and Sherlock36, Reference Sherlock and Thiery58].
An important exception that does not introduce an auxiliary variable is [Reference Bierkens9], which introduces an anti-symmetric part into the acceptance probability so that the kernel becomes non-reversible while preserving
 $\Pi$
-invariance, where a Markov kernel P is called
 $\Pi$
-invariant if
 $\int_{x\in E}\Pi(\mathrm{d} x)P(x,A)=\Pi(A)$
. See also [Reference Neal41], which avoids requiring an additional auxiliary variable by focusing on the uniform distribution that is implicitly used for the acceptance–rejection procedure in the Metropolis algorithm.
In this paper, non-reversible Markov kernels are designed using the Haar measure. The use of the Haar measure in the Monte Carlo context is not new; [Reference Liu and Wu35] used the Haar measure to improve the convergence speed of the Gibbs sampler, which was further developed by [Reference Hobert and Marchev25, Reference Liu and Sabatti34, Reference Shariff, György and Szepesvári57]. Also, the Haar measure is a popular choice of prior distribution in the Bayesian context [Reference Berger3, Reference Ghosh, Delampady and Samanta21, Reference Robert49]. Markov chain Monte Carlo methods with models using the Haar measure as prior distribution are naturally associated with the Haar measure.
1.3. Structure of the paper
The main objective of this paper is to present a framework for the construction of a class of non-reversible kernels, which are described in Section 4. Sections 2 and 3 are devoted to introducing some useful ideas for the construction of the non-reversible kernels.
Section 2.1 contains an introduction to some reversible kernels, such as the convolution-type construction of reversible kernels and Metropolis kernels. In Section 2.2, we introduce the Haar mixture kernel and the Metropolis–Haar kernel. The Metropolis–Haar kernel is useful in its own right, although it does not have the non-reversible property. Moreover, it is actually a key Markov kernel for non-reversible kernels. However, the connection to non-reversible kernels is explained in Section 3 rather than Section 2.
In Section 3 we introduce three properties: the unbiasedness, random-walk, and sufficiency properties. These properties are introduced from Section 3.1 to Section 3.3 sequentially. As described in Section 1.1, our construction of the non-reversible kernel is based on a Markov kernel that generates a state in the positive and negative directions with equal probability. This property, referred to as unbiasedness in Section 3.1, is the sufficient condition for constructing non-reversible kernels. In Section 3.2, we introduce a more specific form of the unbiasedness property, the random-walk property. In Section 3.3, we introduce the sufficiency property to describe a specific form of the random-walk property using the Haar mixture kernel introduced in Section 2.2. Section 3.4 describes how to generalise a one-dimensional unbiased kernel to a multivariate kernel.
Section 4 is the section on non-reversible kernels. In Section 4.1 we introduce a class of non-reversible kernels, the
 $\Delta$
-guided Metropolis kernel. We focus on the
 $\Delta$
-guided Metropolis–Haar kernel, which is a
 $\Delta$
-guided Metropolis kernel using a Haar mixture kernel. In Section 4.2, we show step-by-step instructions for constructing
 $\Delta$
-guided Metropolis–Haar kernels. Some examples can be found in Section 4.3.
In Section 5.1, some simulations for the
 $\Delta$
-guided Metropolis–Haar kernel based on the autoregressive kernel are studied. Also, numerical analyses for
 $\Delta$
-guided Metropolis–Haar kernels on
 $\mathbb{R}_+^d$
are studied in Section 5.2. Some conclusions and discussion can be found in Section 6.
1.4. Some group-related concepts
Our newly proposed methods are based on the Haar measure associated with locally compact topological groups. We give a brief introduction to topological spaces, group structures, and the Haar measure as well as the order structure in this section.
A set G is a totally ordered set if it has a binary relation
 $\le$
which satisfies three properties:
 $a\le b$
and
$b\le a$
implies
$a=b$
;
if
$a\le b$
and
$b\le c$
, then
$a\le c$
;-
$a\le b$
or
$b\le a$
for all
$a, b\in G$
.


We call
 $\le$
an order relation. The totally ordered set G can be equipped with the order topology induced by
 $\{g\in G\;:\;g\le a\}$
and
 $\{g\in G\;:\;a\le g\}$
for
 $a\in G$
. A Borel
 $\sigma$
-algebra is generated from the order topology.
The group G with a binary relation
 $\times$
will be denoted by
 $(G,\times)$
, and
 $a\times b$
will also be denoted by ab for simplicity. A group
 $(G,\times)$
is an ordered group if there is an order relation
 $\le$
such that
 \begin{equation}a\le b \Longrightarrow ca\le cb\ \mathrm{ and }\ ac\le bc\end{equation}
for
 $a,b,c\in G$
.
A topology is a collection of subsets of G that contains
 $\emptyset$
and G and is closed under finite intersections and arbitrary unions. An element of the collection is called an open set, and G is called a topological space. A topological space is equipped with the
 $\sigma$
-algebra generated by all compact sets, which is called a Borel algebra. An element of the Borel algebra is called a Borel set. A Borel measure is a measure
 $\mu$
such that
 $\mu(K)<\infty$
for any compact set K. A topological space is a Hausdorff space if for every pair of distinct elements x, y there are disjoint open sets U, V such that
 $x\in U$
and
 $y\in V$
. Also, a topological space is locally compact if for any element x there exist an open set U and a compact set K such that
 $x\in U\subset K$
.
A group
 $(G,\times)$
with a topology on G is called a topological group if its group actions
 $(g,h)\mapsto gh$
and
 $g\mapsto g^{-1}$
are continuous in the topology of G. If a group G is locally compact and Hausdorff, it is called a locally compact topological group. A left (resp. right) Haar measure is a Borel measure
 $\nu$
that is not identically 0, and such that
 $\nu(g H)=\nu(H)$
(resp.
 $\nu(Hg)=\nu(H)$
) for any Borel set H and
 $g\in G$
. For example, the Lebesgue measure is the left and right Haar measure on
 $(\mathbb{R},+)$
, and
 $\nu(\mathrm{d} g)=\mathrm{d} g/g$
is the left and right Haar measure on
 $(\mathbb{R}_+,\times)$
. For any locally compact topological group, there are left and right Haar measures. The group is called unimodular if the left Haar measure and the right Haar measure coincide up to a multiplicative constant. See [Reference Halmos24] for the details.
The set E is a left G-set if there exists a left group action
 $(g,x)\mapsto gx$
from
 $G\times E$
to E such that
 $(e,x)=x$
and
 $(g,(h,x))=(gh,x)$
, where e is the identity and
 $g, h\in G$
,
 $x\in E$
. We write gx for (g, x). In this paper, any map
 $\Delta\;:\;E\rightarrow G$
is called a statistic when G is a totally ordered set. A statistic is called a G-statistic if
 $\Delta gx=g\Delta x$
for
 $g\in G$
and
 $x\in E$
and if G is an ordered group.
2. Haar mixture kernel
2.1. Reversibility and Metropolis kernel
Before analysing the non-reversible Markov kernel, we first recall the definition of reversibility. Reversibility is important throughout the paper since our construction of a non-reversible Markov kernel is based on classes of reversible Markov kernels. A Markov kernel Q on a measurable space
 $(E,\mathcal{E})$
is
 $\mu$
-reversible for a
 $\sigma$
-finite measure
 $\mu$
if
 \begin{equation}\int_A\mu(\mathrm{d} x)Q(x,B)=\int_B\mu(\mathrm{d} x)Q(x,A)\end{equation}
for any
 $A, B\in\mathcal{E}$
. If Q is
 $\mu$
-reversible, then Q is
 $\mu$
-invariant. There is a strong connection between ergodicity and
 $\mu$
-reversibility. See [Reference Kipnis and Varadhan30, Reference Kontoyiannis and Meyn31, Reference Roberts and Rosenthal50, Reference Roberts and Tweedie53].
As we mentioned above, our non-reversible Markov kernel is based on a class of reversible kernels. Suppose that
 $\mu$
is a probability measure on
 $(E,\mathcal{E})$
where E is closed by a summation operator. A simple approach to constructing a reversible kernel is to first describe
 $\mu$
as an image measure of a convolution of probability measures
 $\mu_Y, \mu_Z$
under a measurable map f, i.e.,
 $\mu=(\mu_Y*\mu_Z)\circ f^{-1}$
. Here, an image measure of a measure
 $\mu$
under a map
 $f\;:\;E\rightarrow E$
is defined by
 \begin{align*}\mu\circ f^{-1}(A)=\mu(\{x\in E\;:\;f(x)\in A\}), \end{align*}
and a convolution of
 $\mu_1$
and
 $\mu_2$
is defined by
 \begin{align*}(\mu_1*\mu_2)(A)=\int_E\mu_1(A-x)\mu_2(\mathrm{d} x)\end{align*}
where
 $A-x=\{y\in E\;:\;x+y\in A\}$
. Then define independent random variables
 $Y_1, Y_2\sim\mu_Y$
and
 $Z\sim \mu_Z$
. Finally, construct Q as the conditional distribution of
 $X_2=f(Y_2+Z)$
given
 $X_1=f(Y_1+Z)$
. Then the probabilities in (3) are
 $\mathbb{P}(X_1\in A, X_2\in B)$
and
 $\mathbb{P}(X_1\in B, X_2\in A)$
, which are the same by construction. We refer to this as the convolution-type construction. A probability distribution can be written by convolution if it is infinitely divisible [Reference Sato55]. Therefore, many popular probability distributions, such as the normal distribution, the Student distribution and the gamma distribution, can be written by convolution. Three specific examples are given below to illustrate the convolutional design. The illustration of the Haar mixture kernel and the
 $\Delta$
-guided Metropolis kernel, described later, will also be based on these three kernels.
Let
 $\mathbb{R}_+=(0,\infty)$
. Let
 $I_d$
be the
 $d\times d$
identity matrix.
Example 1. (Autoregressive kernel.) We first describe the well-known autoregressive kernel resulting from the above convolution-type construction. Let
 $\rho\in (0,1]$
, let M be a
 $d\times d$
positive definite symmetric matrix, and let
 $x_0\in\mathbb{R}^d$
.
Further, let
 $\mathcal{N}_d(x, M)$
be the normal distribution with mean
 $x\in\mathbb{R}^d$
and covariance matrix M. By the reproductive property of the normal distribution,
 $\mu=\mathcal{N}_d(x_0, M)$
is a convolution of probability measures
 $\mu_Y=\mathcal{N}_d(0,\rho M)$
and
 $\mu_Z=\mathcal{N}_d(0,(1-\rho) M)$
with
 $f(x)=x_0+x$
in the notation above. Then the random variables
 $X_1$
and
 $X_2$
in the above notation follow
 $\mu$
with covariance
 \begin{align*}\operatorname{Cov}(X_1,X_2)=\operatorname{Var}(Z)=(1-\rho)M. \end{align*}
By the change-of-variables formula, the conditional distribution
 $Q(x,\cdot)=\mathbb{P}(X_2\in\cdot\ |X_1=x)$
is the autoregressive kernel, which is defined as
 \begin{align*}Q(x,\cdot)=\mathcal{N}_d(x_0+(1-\rho)^{1/2}\;(x-x_0), \rho M). \end{align*}
By the nature of convolution, it is
 $\mu=\mathcal{N}_d(x_0, M)$
-reversible.
Example 2. (Beta--gamma kernel.) Let
 $\mathcal{G}(\nu,\alpha)$
be the gamma distribution with shape parameter
 $\nu$
and rate parameter
 $\alpha$
. Let
 $\mu=\mathcal{G}(k,1)$
,
 $\mu_Y=\mathcal{G}(k(1-\rho), 1)$
,
 $\mu_Z=\mathcal{G}(k\rho,1)$
, and
 $f(x)=x$
, where
 $k\in\mathbb{R}_+$
and
 $\rho\in (0,1)$
. The conditional distribution of
 $b\;:\!=\;Z/X_1$
given
 $X_1$
, in the notation above, is
 $\mathcal{B}e(k\rho,k(1-\rho))$
, where
 $\mathcal{B}e(\alpha,\beta)$
is the beta distribution with shape parameters
 $\alpha$
and
 $\beta$
. Therefore, the conditional distribution
 $Q(x,\mathrm{d} y)=\mathbb{P}(X_2\in\mathrm{d} y|X_1=x)$
on
 $E=\mathbb{R}_+$
, called the beta–gamma (autoregressive) kernel in this paper, is given by
 \begin{align*}y = b x+ c,\ b\sim\mathcal{B}e(k\rho,k(1-\rho)),\ c\sim\mathcal{G}(k(1-\rho),1),\end{align*}
where b, c are independent, and c corresponds to
 $Y_2$
in the above notation. The kernel is
 $\mu=\mathcal{G}(k,1)$
-reversible by construction. See [Reference Lewis, McKenzie and Hugus33].
Example 3. (Chi-squared kernel.) We construct a
 $\mu=\mathcal{G}(L/2,1/2)$
-reversible kernel for
 $L\in\mathbb{N}$
. Let
 $\mu_Y=\mathcal{N}_L(0,\rho I_L)$
,
 $\mu_Z=\mathcal{N}_L(0,(1-\rho) I_L)$
, and
 $f(x_1,\ldots, x_L)=\sum_{l=1}^Lx_l^2$
. By the reproductive property, if
 $Y_1, Y_2\sim\mu_Y$
and
 $Z\sim\mu_Z$
, then
 $X_i'\;:\!=\;Y_i+Z\sim\mathcal{N}_L(0, I_L)$
. Therefore,
 $X_i=f(X_i')\sim\mu$
since
 $\mu$
is the chi-squared distribution with L degrees of freedom. The conditional distribution
 $Q(x,\mathrm{d}y)=\mathbb{P}(X_2\in\mathrm{d}y|X_1=x)$
is
 $\mu$
-reversible by construction. We show that the conditional distribution is given by
 \begin{equation}y = \left[\left\{(1-\rho)\;x\right\}^{1/2}+\rho^{1/2}\;w_1\right]^2+\sum_{l=2}^L\rho\;w_l^2,\end{equation}
where
 $w_1,\ldots, w_L$
are independent and follow the standard normal distribution. To see this, first note that the law of
 $\rho^{-1/2}X_2'$
given
 $X_1'=x'$
is
 $\mathcal{N}_L(\rho^{-1/2}(1-\rho)^{1/2}x',I_L)$
. Then the law of
 $\rho^{-1}X_2=f(\rho^{-1/2}X_2')$
given
 $X_1'=x'$
is the non-central chi-squared distribution with L degrees of freedom and the non-central parameter
 $f(\rho^{-1/2}(1-\rho)^{1/2}x')=\rho^{-1}(1-\rho)x$
. The expression (4) follows from the properties of the non-central chi-squared distribution.
The Metropolis algorithm is a clever way to construct a reversible Markov kernel with respect to a given probability measure
 $\Pi$
. The following definition is somewhat broader than the usual one. It even includes the independent Metropolis–Hastings kernel, which is usually classified as a Metropolis–Hastings kernel and not a Metropolis kernel. An important feature of this kernel compared to the more general Metropolis–Hastings kernel is that we do not need to know the explicit density function of the proposed Markov kernel
 $Q(x,\cdot)$
. The idea behind this naming is that if the acceptance probability can be written explicitly in
 $\mu$
and
 $\Pi$
, it is called a Metropolis kernel, and if it also depends on Q, it is called a Metropolis–Hastings kernel.
Definition 1. (Metropolis kernel.) Let
 $\mu$
be a measure, and let
 $\Pi$
be a probability measure with probability density function
 $\pi(x)$
with respect to
 $\mu$
. Let Q be a
 $\mu$
-reversible Markov kernel. A Markov kernel P is called a Metropolis kernel of
 $(Q,\Pi)$
if
 \begin{equation}\begin{split}P(x,\mathrm{d} y)&=Q(x,\mathrm{d} y)\alpha(x,y)+\delta_x(\mathrm{d} y)\left\{1-\int_EQ(x,\mathrm{d} y)\alpha(x,y)\right\}\end{split}\nonumber\end{equation}
for
 \begin{equation} \alpha(x,y)=\min\left\{1, \frac{\pi(y)}{\pi(x)}\right\}. \end{equation}
The function
 $\alpha$
is called the acceptance probability, and the Markov kernel Q is called the proposal kernel.
A Metropolis kernel P is
 $\Pi$
-reversible. It is easy to create a Metropolis version of the proposal kernels presented in Examples 1–3.
2.2. Haar mixture kernel
We introduce Markov kernels using the Haar measure. The Haar measure enables us to construct a random walk on a locally compact topological group, which is a crucial step towards obtaining non-reversible Markov kernels in this paper. The connection between the Markov kernels and the random walk will be made clear in Section 3, and the connection with non-reversible Markov kernels will be clear in Section 4.
The idea of constructing Haar mixture kernels is to introduce an auxiliary variable g corresponding to the scaling parameter or the shift parameter of the state space. We set a prior distribution on g. In each Markov chain Monte Carlo iteration, before the transition kernel generates a new proposal for the state space, we generate the parameter g based on its prior distribution and the conditional distribution given the state space. The Haar mixture kernel uses the Haar measure as the prior distribution of g. As remarked above, the reason for using the Haar measure will be made clear in later sections.
Let
 $(G,\times)$
be a locally compact topological group equipped with the Borel
 $\sigma$
-algebra. Let E be a left G-set. We assume that E is equipped with a
 $\sigma$
-algebra
 $\mathcal{E}$
and the left group action is jointly measurable. Let Q be a
 $\mu$
-reversible Markov kernel on
 $(E,\mathcal{E})$
, where
 $\mu$
is a
 $\sigma$
-finite measure. Let
 \begin{align*}Q_g(x,A)=Q(gx, gA)\qquad (x\in E,\ A\in\mathcal{E},\ g\in G),\end{align*}
where
 $gA=\{gx\;:\;x\in A\}\in\mathcal{E}$
. Then
 $Q_g$
is
 $\mu_g$
-reversible, where
 \begin{align*}\mu_g(A)=\mu(gA). \end{align*}
Let
 $\nu$
be the right Haar measure on G. It satisfies
 $\nu(Hg)=\nu(H)$
, where
 $Hg=\{hg\;:\;h\in H\} \subset G$
. Set
 \begin{equation}\mu_*(A)=\int_{g\in G}\mu_g(A)\nu(\mathrm{d} g)\ (A\in\mathcal{E}). \end{equation}
Assume that
 $\mu_*$
is a
 $\sigma$
-finite measure. Then
 $\mu_*$
is a left-invariant measure. Indeed, by the definitions of
 $\mu_*$
and
 $\mu_b$
, we have
 \begin{align*} \mu_*(aA)=\int_{b\in G}\mu_b(aA)\nu(\mathrm{d} b)=\int_{b\in G}\mu(baA)\nu(\mathrm{d} b),\end{align*}
and by right-invariance of
 $\nu$
, we have
 \begin{align*}\mu_*(aA)&=\int_{b\in G}\mu(bA)\nu(\mathrm{d} b)\\[5pt] &=\int_{b\in G}\mu_b(A)\nu(\mathrm{d} b)\\[5pt] &=\mu_*(A). \end{align*}
Suppose that
 $\mu$
is absolutely continuous with respect to
 $\mu_*$
. Then
 $(g,x)\mapsto \mathrm{d}\mu_g/\mathrm{d}\mu_*(x)$
is jointly measurable. This is because
 $\mathrm{d}\mu_g/\mathrm{d}\mu_*(x)=\mathrm{d}\mu/\mathrm{d}\mu_*(gx)$
by the left-invariance of
 $\mu_*$
, and
 $(g,x)\mapsto gx$
is assumed to be jointly measurable. Let
 \begin{equation}K(x,\mathrm{d} g)=\frac{\mathrm{d}\mu_{g}}{\mathrm{d}\mu_*}(x)\nu(\mathrm{d} g).\end{equation}
Remark 1. If we consider
 $\mu_g(\mathrm{d} x)\nu(\mathrm{d} g)$
as a joint distribution of (x, g), then
 $\mu_*$
is the marginal distribution of x. The conditional distribution of x given g is
 $K(x,\mathrm{d} g)$
from this joint distribution. By the Radon–Nikodým theorem,
 $K(x,G)=1$
 $\mu_*$
-almost surely.
Define
 \begin{equation}Q_*(x, A)=\int_{g\in G}K(x,\mathrm{d} g)Q_g(x, A). \end{equation}
Definition 2. (Haar mixture kernel.) The Markov kernel
 $Q_*$
defined by (8) is called the Haar mixture kernel of Q.
Example 4. (Autoregressive mixture kernel.) Consider the autoregressive kernel in Example 1. Let
 $E=\mathbb{R}^d$
,
 $G=(\mathbb{R}_+,\times)$
, and
 $\mu=\mathcal{N}(x_0,M)$
, and set
 $(g,x)\mapsto x_0+g^{1/2}(x-x_0)$
. Then the Haar measure is
 $\nu(\mathrm{d} g)\propto g^{-1}\mathrm{d} g$
. A simple calculation yields
 $\mu_g=\mathcal{N}_d(x_0, g^{-1}M)$
and
 $Q_g(x,\cdot)=\mathcal{N}_d(x_0+(1-\rho)^{1/2}\;(x-x_0), g^{-1}\rho M)$
. Also,
 $\mu_*(\mathrm{d} x)\propto (\Delta x)^{-d/2}\mathrm{d} x$
and
 $K(x,\mathrm{d} g)=\mathcal{G}(d/2, \Delta x/2)$
, where
 $\Delta x =(x-x_0)^{\top}M^{-1}(x-x_0)$
. We have a closed-form (up to a constant) expression for
 $Q_*(x,\cdot)$
as follows:
 \begin{align*} Q_*(x,\mathrm{d}y)\propto \left[1+\frac{\Delta(y-(1-\rho)^{1/2}(x-x_0))}{\rho\Delta x}\right]^{-d}\mathrm{d} x. \end{align*}
Example 5. (Beta--gamma mixture kernel.) The beta–gamma kernel in Example 2 is reversible with respect to
 $\mu=\mathcal{G}(k,1)$
. After we introduce the operation
 $(g,x)\mapsto gx$
with
 $G=(\mathbb{R}_+,\times)$
,
 $E=\mathbb{R}_+$
becomes a left G-set. We have
 $\mu_g=\mathcal{G}(k,g)$
, and the Markov kernel
 $Q_g$
is the same as Q with
 $c\sim\mathcal{G}(k(1-\rho),1)$
replaced by
 $c\sim\mathcal{G}(k(1-\rho),g)$
. The Haar measure on G is
 $\nu(\mathrm{d} g)\propto g^{-1}\mathrm{d} g$
, and hence
 $\mu_*(\mathrm{d} x)\propto x^{-1}\mathrm{d} x$
and
 $K(x,\mathrm{d} g)=\mathcal{G}(k, x)$
.
Example 6. (Chi-squared mixture kernel.) For the chi-squared kernel in Example 3, let
 $E=\mathbb{R}_+$
,
 $G=(\mathbb{R}_+,\times)$
, and
 $\mu=\mathcal{G}(L/2, 1/2)$
. Set
 $(g,x)\mapsto gx$
. We have
 $\mu_g=\mathcal{G}(L/2, g/2)$
, and the Markov kernel
 $Q_g$
is the same as Q with the standard normal distribution replaced by
 $\mathcal{N}(0,g^{-1})$
. The Haar measure is
 $\nu(\mathrm{d} g)\propto g^{-1}\mathrm{d} g$
. In this case,
 $K(x,\mathrm{d} g)=\mathcal{G}(L/2, x/2)$
, and
 $\mu_*(\mathrm{d} x)=x^{-1}\mathrm{d} x$
.
Proposition 1.
The Haar mixture kernel
 $Q_*$
is
 $\mu_*$
-reversible.
Proof. Let
 $A, B\in\mathcal{E}$
. By the definitions of
 $Q_*$
and K, we have
 \begin{align*} \int_{A}\mu_*(\mathrm{d} x)Q_*(x, B)&= \int_{g\in G}\int_{x\in A}\mu_*(\mathrm{d} x)K(x,\mathrm{d} g)Q_g(x, B)\\[5pt] &= \int_{g\in G}\int_{x\in A}\mu_g(\mathrm{d} x)Q_g(x, B)\nu(\mathrm{d} g), \end{align*}
and by
 $\mu_g$
-reversibility of
 $Q_g$
, we have
 \begin{align*} \int_{A}\mu_*(\mathrm{d} x)Q_*(x, B)&=\int_{g\in G}\int_{x\in B}\mu_g(\mathrm{d} x)Q_g(x, A)\nu(\mathrm{d} g)\\[5pt] &=\int_{B}\mu_*(\mathrm{d} x)Q_*(x, A). \end{align*}
From this, we can define the following Metropolis kernel.
Definition 3. (Metropolis--Haar kernel.) A Metropolis kernel
 $P_*$
of
 $(Q_*,\Pi)$
is called a Metropolis–Haar kernel if
 $Q_*$
is a Haar mixture kernel.
The Metropolis–Haar kernel is implemented through the following algorithm, where
 $\pi(x)=(\mathrm{d}\Pi/\mathrm{d}\mu_*)(x)$
. In the algorithm,
 $\mathcal{U}[0,1]$
is the uniform distribution on [0, 1].
Algorithm 1: Metropolis–Haar kernel

The Metropolis–Haar kernel is reversible, but important in its own right. The underlying reference measure
 $\mu_*$
is heavier than
 $\mu_g$
, which is expected to lead to a robust algorithm. Examples of Metropolis–Haar kernels will be described in Section 4.3.
3. Unbiasedness, the random-walk property, and sufficiency
3.1. Unbiasedness
In this section, we introduce the unbiasedness property for efficient construction of the non-reversible kernel. Any measurable map
 $\Delta\;:\;E\rightarrow G$
, where
 $G=(G,\le\!)$
is a totally ordered set, is called a statistic in this paper. In Section 4, a statistic
 $\Delta$
will guide a Markov kernel
 $Q(x,\mathrm{d} y)$
according to the auxiliary directional variable
 $i\in\{-,+\}$
as in [Reference Gustafson23]. When the positive direction
 $i=+$
is selected, y is sampled according to
 $Q(x,\mathrm{d} y)$
unless
 $\Delta x\le\Delta y$
by rejection sampling. If the negative direction
 $i=-$
is selected, y is sampled unless
 $\Delta y\le \Delta x$
. It is typical that one of the rejection sampling directions has high rejection probability (see Example 7). To avoid this inefficiency, we consider a class of Markov kernels Q such that the probabilities of the events
 $\Delta x\le\Delta y$
and
 $\Delta y\le \Delta x$
measured by
 $Q(x,\cdot)$
are the same. We say Q is unbiased if this property is satisfied. If unbiasedness is violated, the rejection sampling may be inefficient, because it takes a long time to exit the while loop of the rejection sampling. Therefore, the unbiasedness property is necessary for efficient construction of the non-reversible kernel in our approach.
Definition 4. (
 $\Delta$
-unbiasedness.) Let
 $\Delta\;:\;E\rightarrow G$
be a statistic. We say a Markov kernel Q on E is
 $\Delta$
-unbiased if
 \begin{align*}Q(x,\{y\in E\;:\;\Delta x\le\Delta y\})=Q(x,\{y\in E\;:\;\Delta y\le\Delta x\})\end{align*}
for any
 $x\in E$
. Also, we say that two statistics
 $\Delta$
and
 $\Delta'$
from E to possibly different totally ordered sets are equivalent if
 \begin{equation}\begin{split}Q(x,\{y\in E\;:\;\Delta x\le \Delta y\}\ominus\{y\in E\;:\;\Delta' x\le \Delta' y\})&=0,\\[5pt] Q(x,\{y\in E\;:\;\Delta y\le \Delta x\}\ominus\{y\in E\;:\;\Delta' y\le \Delta' x\})&=0\end{split}\nonumber\end{equation}
for
 $x\in E$
, where
 $A\ominus B=(A\cap B^c)\cup (A^c\cap B)$
.
If
 $\Delta$
and
 $\Delta'$
are equivalent, then
 $\Delta$
-unbiasedness implies
 $\Delta'$
-unbiasedness.
Example 7. (Random-walk kernel.) Let
 $v^{\top}$
be the transpose of
 $v\in\mathbb{R}^d$
, and let
 $\Gamma$
be a probability measure on
 $\mathbb{R}^d$
which is symmetric about the origin; that is,
 $\Gamma(A)=\Gamma(\!-A)$
for
 $-A=\{x\in E\;:\; -\!x\in A\}$
. Let
 $Q(x,A)=\Gamma(A-x)$
. Then Q is
 $\Delta$
-unbiased for
 $\Delta x=v^{\top}x$
for some
 $v\in\mathbb{R}^d$
, since
 \begin{equation*}\begin{split}Q(x,\{y\;:\;\Delta x\le \Delta y\})& =\Gamma(\{z\;:\;0\le v^{\top}z\})\\[5pt] & =\Gamma(\{z\;:\;v^{\top}z\le 0\}). \end{split}\end{equation*}
On the other hand, Q is not
 $\Delta'$
-unbiased for
 $\Delta' x=x_1^2+\cdots +x_d^2$
, where
 $x=(x_1,\ldots, x_d)$
, if
 $\Gamma$
is not the Dirac measure centred on
 $(0,\ldots,0)$
. In particular, if
 $\Gamma(\{(0,\ldots, 0)\})=0$
, then
 $Q(x, \{\Delta' y\le \Delta' x\})=0$
for
 $x=(0,\ldots, 0)$
.
3.2. Random-walk property
Constructing a
 $\Delta$
-unbiased Markov kernel is a crucial step for our approach. However, determining how to construct a
 $\Delta$
-unbiased Markov kernel is non-trivial. The random-walk property is the key for this construction.
Let G be a topological group.
Definition 5. (
 $(\Delta,\Gamma)$
-random-walk.) A Markov kernel
 $Q(x,\mathrm{d} y)$
has the
 $(\Delta,\Gamma)$
-random-walk property if there is a function
 $\Delta\;:\;E\rightarrow G$
with a probability measure
 $\Gamma$
on a topological group G such that
 $\Gamma(H)=\Gamma(H^{-1})$
for any Borel set H of G and
 \begin{equation} Q(x, \{y\in E\;:\;\Delta y\in H\})=\Gamma((\Delta x)^{-1}H). \end{equation}
Here,
 $H^{-1}=\{g\in G\;:\;g^{-1}\in H\}$
.
A typical example of a Markov kernel with the
 $(\Delta,\Gamma)$
-random-walk property is given in Example 7. We assume that
 $(G,\le\!)$
is an ordered group.
Proposition 2.
If Q has the
 $(\Delta,\Gamma)$
-random-walk property, then Q is
 $\Delta$
-unbiased.
Proof. Let
 $H=[\Delta x,+\infty)=\{g\in H\;:\;\Delta x\le g\}$
. Then for the unit element e,
 \begin{align*}Q(x,\{y\in E\;:\;\Delta x\le\Delta y\})&=Q(x,\{y\in E\;:\;\Delta y\in H\})\\[5pt] &=\Gamma((\Delta x)^{-1}H)=\Gamma([e,+\infty)).\end{align*}
Similarly,
 $Q(x,\{y\in E\;:\;\Delta y\le\Delta x\})=\Gamma((\!-\!\infty, e])$
. Since
 $[e,+\infty)^{-1}=(\!-\!\infty,e]$
, and since
 $\Gamma(H)=\Gamma(H^{-1})$
, Q is
 $\Delta$
-unbiased.
Remark 2. The
 $\Delta$
-unbiasedness is the key to the construction of a non-reversible kernel in this work, since it allows one to have sub-Markov kernels with equal masses. However, as described in Example 7,
 $\Delta$
-unbiasedness is not obvious, except for the obvious case in Example 7. The
 $(\Delta,\Gamma)$
-random-walk property is a simple sufficient condition for
 $\Delta$
-unbiasedness. The idea behind the
 $(\Delta,\Gamma)$
-random walk is that it involves a fair move, in the sense that it increases and decreases the order in
 $(G,\le\!)$
with equal probability, leading to
 $\Delta$
-unbiasedness.
3.3. Sufficiency
So far in this section, we have introduced
 $\Delta$
-unbiasedness, which is the important property for the
 $\Delta$
-guided Metropolis kernel in Section 3.1. In Section 3.2, we showed that the
 $(\Delta,\Gamma)$
-random-walk property is sufficient for
 $\Delta$
-unbiasedness. In this section we will show that for the Haar mixture kernel, the sufficiency property introduced below is sufficient for the
 $(\Delta,\Gamma)$
-random-walk property, and thus for the
 $\Delta$
-unbiasedness property.
We would like to mention the intuition behind the sufficiency property. In general, the conditional law of
 $\Delta y$
given x is not completely determined by
 $\Delta x$
. If it is completely determined by
 $\Delta x$
, we call
 $\Delta$
sufficient. If
 $\Delta$
is sufficient, the equation (9) is satisfied, although
 $\Gamma$
is not symmetric in general. When Q is the Haar mixture kernel with some additional technical conditions, we will show that
 $\Gamma$
is symmetric thanks to the Haar measure property.
Let
 $(G,\times)$
be a unimodular locally compact topological group. Also, let
 $(G,\le\!)$
be an ordered group, and let E be a left G-set. In this paper, a statistic
 $\Delta\;:\;E\rightarrow G$
is called a G-statistic if
 $\Delta gx=g\Delta x$
for
 $g\in G$
and
 $x\in E$
. For a
 $\sigma$
-finite measure
 $\Pi$
on E and a G-statistic
 $\Delta\;:\;E\rightarrow G$
, let
 $\widehat{\Pi}=\Pi\circ\Delta^{-1}$
, that is, the image measure of
 $\Pi$
under
 $\Delta$
. Let
 $\widehat{\mu}_*$
be the image measure of
 $\mu_*$
under
 $\Delta$
. Then it is a left Haar measure, since
 \begin{align*}\widehat{\mu}_*(gH)&=\mu_*(\{y\in E\;:\;\Delta y\in gH\})\\[5pt] &=\mu_*(\{y\in E\;:\;\Delta( g^{-1}y)\in H\})\end{align*}
by the property
 $\Delta (g^{-1}y)=g^{-1}\Delta y$
, and
 \begin{align*}\widehat{\mu}_*(gH)&=\mu_*(\{y\in E\;:\;\Delta y\in H\})=\widehat{\mu}_*(H)\end{align*}
by the left-invariance of
 $\mu_*$
. Since G is unimodular, the left Haar measure
 $\widehat{\mu}_*$
and the right Haar measure
 $\nu$
coincide up to a multiplicative constant. From this fact, we can assume
 \begin{align*}\widehat{\mu}_*=\nu\end{align*}
without loss of generality. By construction,
 $\mu$
and
 $\mu_*$
are measures on E, and
 $\hat{\mu}$
,
 $\hat{\mu}_*$
, and
 $\nu$
are measures on G. Let Q be a
 $\mu$
-reversible kernel.
Definition 6. (Sufficiency.) Let
 $\mu$
be a
 $\sigma$
-finite measure. We call a G-statistic
 $\Delta$
sufficient for
 $(\nu, \mu, Q)$
if there is a Markov kernel
 $\widehat{Q}$
and a measurable function
 $h_1$
on G such that
 \begin{align*}Q(x, \{y\in E\;:\;\Delta y\in H\})=\widehat{Q}(\Delta x, H)\end{align*}
and
 \begin{align*}\frac{\mathrm{d} \mu}{\mathrm{d}\mu_*}(x)=h_1(\Delta x)\end{align*}
 $\mu_*$
-almost surely.
Suppose that
 $\Delta$
is sufficient for
 $(\nu, \mu, Q)$
, and let
 $X_n$
be a Markov chain with transition kernel Q. Then the law of
 $\Delta X_n$
given
 $X_{n-1}=x$
depends on x only through
 $\Delta x$
. Moreover,
 $K(x,\mathrm{d} g)$
depends on x only through
 $\Delta x$
. More precisely, by the left-invariance of
 $\mu_*$
, we have
 \begin{equation} \frac{\mathrm{d}\mu_g}{\mathrm{d}\mu_*}(x)=h_1(g\Delta x)\end{equation}
since
 \begin{align*} \mu_g(A)&=\mu(gA)=\int_{gA} h_1(\Delta x)\mu_*(\mathrm{d} x)=\int_{A} h_1(g\Delta x)\mu_*(\mathrm{d} x). \end{align*}
Let
 $\widehat{\mu}$
be the image measure of
 $\mu$
under
 $\Delta$
. Then
 $\widehat{Q}$
is
 $\widehat{\mu}$
-reversible and
 \begin{equation} \frac{\mathrm{d}\widehat{\mu}}{\mathrm{d}\nu}(a)=\frac{\mathrm{d}\widehat{\mu}}{\mathrm{d}\widehat{\mu}_*}(a)=h_1(a). \end{equation}
Example 8. (Sufficiency of the autoregressive mixture kernel.) Consider the autoregressive kernel Q and the measure
 $\mu$
in Example 1 and the statistic
 $\Delta$
defined in Example 4. We show that
 $\Delta $
is sufficient for
 $(\nu,\mu,Q)$
. The Markov kernel
 $Q(x,\mathrm{d} y)$
corresponds to the update
 \begin{align*}y \leftarrow x_0+(1-\rho)^{1/2}(x-x_0)+\rho^{1/2}\;M^{1/2}\;w\end{align*}
where
 $w\sim\mathcal{N}_d(0, I_d)$
. For
 $\xi=(1-\rho)^{1/2}\rho^{-1/2}M^{-1/2}(x-x_0)$
,
 \begin{align*}\Delta y=\rho\left\|\xi+w\right\|^2,\end{align*}
where
 $\|\cdot\|$
is the Euclidean norm. Therefore,
 $\rho^{-1}\Delta y$
conditioned on x follows the non-central chi-squared distribution with d degrees of freedom and non-central parameter
 $\|\xi\|^2=(1-\rho)\rho^{-1}\Delta x$
. Hence, the law of
 $\Delta y$
depends on x only through
 $\Delta x$
, and thus there exists a Markov kernel
 $\widehat{Q}$
as in Definition 6. Also, a simple calculation yields
 $h_1(g)\propto g^{d/2}\exp(\!-\!g/2)$
. Therefore,
 $\Delta$
is sufficient.
Example 9. (Sufficiency of the beta--gamma and chi-squared kernels.) If
 $G=E$
and
 $\Delta x=x$
is a G-statistic, then it is sufficient if
 $\mu$
is absolutely continuous with respect to
 $\mu_*$
. In particular, for the beta–gamma kernel in Example 2 and chi-squared kernel 3,
 $\Delta x=x$
is sufficient for
 $(\nu,\mu,Q)$
.
For a measure
 $\nu$
, we write
 $\nu^{\otimes k}$
for the kth product of
 $\nu$
, defined by
 \begin{align*}\nu^{\otimes k}(\mathrm{d} x_1\cdots\mathrm{d} x_k)=\nu(\mathrm{d} x_1)\cdots\nu(\mathrm{d} x_k),\end{align*}
for
 $k\in\mathbb{N}$
.
Proposition 3.
Suppose a G-statistic
 $\Delta$
is sufficient for a
 $\mu$
-reversible kernel Q. Also, suppose a probability measure
 $\widehat{\mu}(\mathrm{d} a)\widehat{Q}(a,\mathrm{d} b)$
on
 $G\times G$
is absolutely continuous with respect to
 $\nu^{\otimes 2}$
. Then
 $Q_*$
has the
 $(\Delta,\Gamma)$
-random-walk property for a probability measure
 $\Gamma$
. In particular, it is
 $\Delta$
-unbiased.
Proof. Let h(a, b) be the Radon–Nikodým derivative:
 \begin{equation}h(a,b)\nu(\mathrm{d} a)\nu(\mathrm{d} b)=\widehat{\mu}(\mathrm{d} a)\widehat{Q}(a,\mathrm{d} b). \nonumber\end{equation}
By the
 $\widehat{\mu}$
-reversibility of
 $\widehat{Q}$
,
 $h(a,b)=h(b,a)$
almost surely. From the sufficiency property, we can rewrite
 $h_1$
and
 $\widehat{Q}$
in terms of h(a, b) and
 $\nu$
:
 \begin{equation}\begin{cases}&h_1(a)=\int_{b\in G}h(a,b)\nu(\mathrm{d} b),\\[5pt] &h_1(a)\widehat{Q}(a,\mathrm{d} b)=h(a,b)\nu(\mathrm{d} b),\end{cases}\end{equation}
 $\nu$
-almost surely. By the definition of
 $Q_*$
, K, and
 $\widehat{Q}$
, we have
 \begin{align*}Q_*(x,\{y\;:\;\Delta y\in H\})=& \int_{a\in G}K(x,\mathrm{d} a)Q(ax, \{y\;:\;\Delta y\in aH\})\\[5pt] =& \int_{a\in G}\frac{\mathrm{d}\mu_a}{\mathrm{d}\mu_*}(x)\nu(\mathrm{d} a)\widehat{Q}(a \Delta x, aH), \end{align*}
and also, by (10) and (12), we have
 \begin{align*}Q_*(x,\{y\;:\;\Delta y\in H\})=& \int_{a\in G}h_1(a\Delta x)\widehat{Q}(a \Delta x, aH)\nu(\mathrm{d} a)\\[5pt] =& \int_{a\in G}\int_{b\in H}h(a\Delta x, ab)\nu(\mathrm{d} a)\nu(\mathrm{d} b)\\[5pt] =& \int_{a\in G}\int_{b\in H}h(a, a(\Delta x)^{-1}b)\nu(\mathrm{d} a)\nu(\mathrm{d} b),\end{align*}
where the last equality follows from the right-invariance of
 $\nu$
. Let
 \begin{align*} \widehat{h}(b)= \int_{a\in G}h(a,ab)\nu(\mathrm{d} a). \end{align*}
From
 $h(a,b)=h(b,a)$
,
 \begin{align*}\widehat{h}(b^{-1})&= \int_{a\in G}h(a,ab^{-1})\nu(\mathrm{d} a)\\[5pt] &= \int_{a\in G}h(ab,a)\nu(\mathrm{d} a)=\widehat{h}(b). \end{align*}
By using
 $\widehat{h}$
, we can write
 \begin{align*}Q_*(x,\{y\;:\;\Delta y\in H\})&= \int_{b\in H}\widehat{h}((\Delta x)^{-1}b)\nu(\mathrm{d} b)\\[5pt] & = \int_{b\in (\Delta x)^{-1}H}\widehat{h}(b)\nu(\mathrm{d} b). \end{align*}
The above is guaranteed to have the
 $(\Delta,\Gamma)$
-random-walk property, where we introduce
 $\Gamma(H)=\int_{a\in H}\widehat{h}(a)\nu(\mathrm{d} a)$
, because
 \begin{align*}Q(x,\{y\;:\;\Delta y\in H\})=\Gamma((\Delta x)^{-1}H)\end{align*}
and
 \begin{align*}\Gamma(H^{-1})&=\int_{a^{-1}\in H}\widehat{h}(a)\nu(\mathrm{d} a)=\int_{a\in H}\widehat{h}(a)\nu(\mathrm{d} a)=\Gamma(H). \end{align*}
Hence, it is
 $\Delta$
-unbiased by Proposition 2.
3.4. Multivariate versions of one-dimensional kernels
Essentially, we have introduced three Markov kernels: the autoregressive kernel, the chi-squared kernel, and the beta–gamma kernel. The state space of the first kernel is a general Euclidean space, and that of the last two kernels is a subspace of the one-dimensional Euclidean space. In this subsection, we consider the multivariate versions of the latter two kernels.
We present different strategies for the two kernels. For the chi-squared kernel, there is a sophisticated structure that allows for a multivariate version of the state space. For the beta–gamma kernel, there does not seem to be a special structure, and so we apply a general approach which does not require any structure. First we show how to construct a multivariate extension for the chi-squared kernel.
Example 10. (Multivariate chi-squared mixture kernel.) For the chi-squared kernel (Examples 3 and 6), we use the operation
 $(g,x)\mapsto (gx_1,\ldots, gx_d)$
with
 $G=\mathbb{R}_+$
and
 $E=\mathbb{R}_+^d$
. Let Q be the Markov kernel defined in Example 3. Let
 \begin{align*}\mathcal{Q}(x,\mathrm{d} y)=Q(x_1,\mathrm{d} y_1)\cdots Q(x_d,\mathrm{d} y_d)\end{align*}
and
 $\mu(\mathrm{d} x)=\mathcal{G}(L/2,1/2)^{\otimes d}$
. Let
 $\Delta x=x_1+\cdots +x_d$
. In this case,
 $\nu(\mathrm{d} g)\propto g^{-1}\mathrm{d} g$
and
 $\mu_g(\mathrm{d} x)=\mathcal{G}(L/2,g/2)^{\otimes d}$
, and
 $\mathcal{Q}_g$
on
 $\mathbb{R}^d_+$
is the product of
 $Q_g$
on
 $\mathbb{R}_+$
defined in Example 6; that is,
 \begin{align*}\mathcal{Q}_g(x,\mathrm{d} y)=Q_g(x_1,\mathrm{d} y_1)\cdots Q_g(x_d,\mathrm{d} y_d). \end{align*}
Then
 \begin{align*}\mu_*(\mathrm{d} x)\propto (x_1\cdots x_d)^{L/2-1}(\Delta x)^{-dL/2}\mathrm{d} x_1\cdots\mathrm{d} x_d\end{align*}
and
 $K(x,\mathrm{d} g)=\mathcal{G}(Ld/2, \Delta x/2)$
. From this expression,
 $h_1(g)\propto g^{dL/2}\exp(\!-\!g/2)$
. Moreover, by the property of the non-central chi-squared distribution, the law of
 $\rho^{-1}\Delta y$
where
 $y\sim \mathcal{Q}(x,\mathrm{d} y)$
is the non-central chi-squared distribution with dL degrees of freedom and with the non-central parameter
 $(1-\rho)\rho^{-1}\Delta x$
. Therefore there exists a Markov kernel
 $\widehat{\mathcal{Q}}(g,\cdot)$
which is the scaled non-central chi-squared distribution for each g. It is not difficult to check that
 $\widehat{Q}$
has a density function with respect to
 $\nu$
. The statistic
 $\Delta$
is sufficient, and the multivariate version of chi-squared mixture kernel
 $\mathcal{Q}_*$
is
 $\Delta$
-unbiased from this fact.
Example 11. (Multivariate beta--gamma mixture kernel.) For the beta–gamma kernel (Examples 2 and 5), we use the operation
 $(g,x)\mapsto (g_1x_1,\ldots, g_dx_d)$
, with
 $G=(\mathbb{R}_+^d,\times)$
and
 $E=\mathbb{R}_+^d$
, where
 $g=(g_1,\ldots, g_d)$
and
 $x=(x_1,\ldots, x_d)$
. We define the binary operation of G by
 $(x,y)\mapsto (x_1y_1,\cdots, x_dy_d)$
and the identity element by
 $e=(1,\ldots, 1)$
. In this case, the Markov kernel
 $\mathcal{Q}_g$
on
 $\mathbb{R}^d$
is the product of
 $Q_g$
on
 $\mathbb{R}$
defined in Example 5; that is,
 \begin{align*}\mathcal{Q}_g(x,\mathrm{d} y)=Q_{g_1}(x_1,\mathrm{d} y_1)\cdots Q_{g_d}(x_d,\mathrm{d} y_d). \end{align*}
Also, we have
 $K(x,\mathrm{d} g)=\mathcal{G}(k, x_1)\cdots\mathcal{G}(k, x_d)$
and
 $\mu_*(\mathrm{d} x)=(x_1\cdots x_d)^{-1}\mathrm{d} x_1\cdots \mathrm{d} x_d $
. The G-statistic
 $\Delta x=x$
is sufficient, and hence the multivariate version of the beta–gamma mixture kernel
 $\mathcal{Q}_*$
is
 $\Delta$
-unbiased by Proposition 3.
For
 $G=\mathbb{R}_+^d$
in Example 11, several types of order relations are possible. Any ordering will do as long as (2) is satisfied. The popular lexicographic order depends on how we index the coordinates. To avoid this unfavourable property, we consider the modified lexicographic order defined below.
Example 12. (Modified lexicographic order.) Let
 $G=(\mathbb{R}_+^d,\times)$
. For
 $x=(x_1,\ldots, x_d)\in G$
, let
 \begin{align*}s(x)_i=x_i\times\cdots\times x_d\end{align*}
be a partial product of the vector x from the ith element to the dth element. A version of lexicographic order
 $\le $
can be defined as follows. Counting from
 $i=1,\ldots, d$
,
if
$s(x)_i=s(y)_i$
for all i orif the first index i such that
$s(x)_i\neq s(y)_i$
satisfies
$s(x)_i<s(y)_i$
,


then we write
 $x\le y$
. It is not difficult to check that this ordering satisfies (2).
Since (2) is satisfied, the multivariate beta–gamma mixture kernel is
 $\Delta$
-unbiased with this order for G, where
 $\Delta$
is the modified lexicographic order. Note that the modified lexicographic order
 $\Delta$
still has the same problem as the (unmodified) lexicographic order; that is, it depends how we index the coordinates. However, the problem occurs with probability 0. This is because the first step of the sort (i.e.
 $s(x)_1<s(y)_1$
or
 $s(y)_1<s(x)_1$
) does not depend on the order of the indices, and the first step determines the order with probability 1. Indeed, by construction,
 \begin{align*} Q(\{y\in E\;:\;\Delta x\le \Delta y\})&= Q(\{y\in E\;:\;s(x)_1\le s(y)_1\})\end{align*}
since
 $s(x)_1=s(y)_1$
occurs with probability 0. More precisely,
 \begin{align*}\Delta(x_1,\ldots, x_d)=(x_1,\ldots, x_d)\end{align*}
with the modified lexicographic ordering and
 \begin{align*}\Delta'(x_1,\ldots,x_d)=x_1\times\cdots\times x_d\end{align*}
in
 $\mathbb{R}_+$
with the usual ordering are equivalent in the sense of Definition 4, because
 $\Delta'(x)=s(x)_1$
. In particular, the multivariate beta–gamma mixture kernel is
 $\Delta'$
-unbiased since the kernel is
 $\Delta$
-unbiased. Note that
 $\Delta'$
is not a G-statistic, since it does not satisfy
 $\Delta'gx=g\Delta'x$
.
4. Guided Metropolis kernel
4.1.
$\Delta$
-guided Metropolis kernel

Definition 7. (
 $\Delta$
-guided Metropolis kernel.) For
 $\Delta$
-unbiased Markov kernel Q, a probability measure
 $\Pi$
, and a measurable function
 $\alpha\;:\;E\times E\rightarrow [0,1]$
defined in (5), we say a Markov kernel
 $P_G$
on
 $E\times \{-,+\}$
is the
 $\Delta$
-guided Metropolis kernel of
 $(Q,\Pi)$
if
 \begin{align*}P_G(x,+,\mathrm{d} y,+)&=Q_+(x,\mathrm{d} y)\alpha(x,y)\\[5pt] P_G(x,+,\mathrm{d} y,-)&=\delta_x(\mathrm{d} y)\left\{1-\int_EQ_+(x,\mathrm{d} y)\alpha(x,y)\right\}\\[5pt] P_G(x,-,\mathrm{d} y,-)&=Q_-(x,\mathrm{d} y)\alpha(x,y)\\[5pt] P_G(x,-,\mathrm{d} y,+)&=\delta_x(\mathrm{d} y)\left\{1-\int_EQ_-(x,\mathrm{d} y)\alpha(x,y)\right\},\end{align*}
where
 \begin{align*}Q_+(x,\mathrm{d} y)&=2Q(x,\mathrm{d} y)1_{\{\Delta x <\Delta y\}}+Q(x,\mathrm{d} y)1_{\{\Delta x=\Delta y\}},\\[5pt] Q_-(x,\mathrm{d} y)&=2Q(x,\mathrm{d} y)1_{\{\Delta y<\Delta x\}}+Q(x,\mathrm{d} y)1_{\{\Delta x=\Delta y\}}. \end{align*}
The Markov kernel
 $P_G$
satisfies the so-called
 $\Pi_G$
-skew-reversible property
 \begin{equation}\begin{split}\Pi_G(\mathrm{d} x,+)P_G(x,+,\mathrm{d} y,+)&=\Pi_G(\mathrm{d} y,-)P_G(y,-,\mathrm{d} x,-),\\[5pt] \Pi_G(\mathrm{d} x,+)P_G(x,+,\mathrm{d} y,-)&=\Pi_G(\mathrm{d} y,-)P_G(y,-,\mathrm{d} x,+),\end{split}\nonumber\end{equation}
where
 \begin{align*}\Pi_G=\Pi\otimes(\delta_{-}+\delta_{+})/2. \end{align*}
Here, for probability measures
 $\nu$
and
 $\mu$
,
 $(\nu\otimes\mu)(\mathrm{d} x\mathrm{d} y)=\nu(\mathrm{d} x)\mu(\mathrm{d} y)$
. With this property, it is straightforward to check that
 $P_G$
is
 $\Pi_G$
-invariant.
Example 13. (Guided-walk kernel.) The
 $\Delta$
-guided Metropolis kernel corresponding to the random-walk kernel Q on
 $\mathbb{R}$
is called the guided walk in [Reference Gustafson23]. For a multivariate target distribution,
 $\Delta x=v^{\top}x$
for some
 $v\in\mathbb{R}^d$
is considered in [Reference Gustafson23, Reference Ma, Fox, Chen and Wu38].
As described in Proposition 3, a Haar mixture kernel
 $Q_*$
is
 $\Delta$
-unbiased if
 $\Delta$
is sufficient and some other technical conditions are satisfied. Therefore, we can construct a
 $\Delta$
-guided Metropolis kernel
 $(Q_*,\Pi)$
using the Haar mixture kernel
 $Q_*$
.
Definition 8. (
 $\Delta$
-guided Metropolis–Haar kernel.) If a Haar mixture kernel
 $Q_*$
is
 $\Delta$
-unbiased, the
 $\Delta$
-guided Metropolis kernel of
 $(Q_*,\Pi)$
is called the
 $\Delta$
-guided Metropolis–Haar kernel.
The
 $\Delta$
-guided Metropolis–Haar kernel is given as Algorithm 2, where we let
 $\pi(x)=\mathrm{d}\Pi/\mathrm{d}\mu_*(x)$
. This Metropolis–Haar kernel is further discussed in detail in Sections 4.2 and 4.3.
Algorithm 2:
 $\Delta$
-guided Metropolis–Haar kernel

Let P be the Metropolis kernel of
 $(Q,\Pi)$
. We now see that
 $P_G$
is always expected to be better than P in the sense of the asymptotic variance corresponding to the central limit theorem. The inner product
 $\langle f,g\rangle=\int f(x)g(x)\Pi(\mathrm{d} x)$
and the norm
 $\|f\|=(\langle f,f\rangle)^{1/2}$
can be defined on the space of
 $\Pi$
-square integrable functions. Let
 $(X_0, X_1,\ldots\!)$
be a Markov chain with Markov kernel P and
 $X_0\sim \Pi$
. Then we define the asymptotic variance
 \begin{align*}\operatorname{Var}(f,P)=\lim_{N\rightarrow\infty}\operatorname{Var}\left(N^{-1/2}\sum_{n=1}^Nf(X_n)\right)\end{align*}
if the right-hand side exists. The existence of the right-hand side limit is a kernel-specific problem and is not addressed here. Let
 $\lambda \in [0,1)$
. As in [Reference Andrieu1], to avoid a kernel-specific argument, we consider a pseudo-asymptotic variance
 \begin{align*}\operatorname{Var}_\lambda(f,P)=\|f_0\|^2+2\sum_{n=1}^\infty\lambda^n\langle f_0,P^n f_0\rangle,\end{align*}
where
 $f_0=f-\Pi(f)$
, which always exists. Under some conditions,
 $\lim_{\lambda\uparrow 1-}\operatorname{Var}_\lambda(f,P)=\operatorname{Var}(f,P)$
. We can also define
 $\operatorname{Var}_\lambda(f,P_G)$
for a
 $\Pi$
-square integrable function f on E by considering
 $f((x,i))=f(x)$
.
Proposition 4. ([Reference Andrieu and Livingstone2, Theorem 3.17].) Suppose that f is
 $\Pi$
-square integrable. Then for
 $\lambda\in [0,1)$
,
 $\operatorname{Var}_\lambda(f,P_G)\le \operatorname{Var}_\lambda(f,P)$
.
By taking
 $\lambda\uparrow 1$
, we can expect that the non-reversible kernel
 $P_G$
is better than P in the sense of having smaller asymptotic variance.
4.2. Step-by-step instructions for creating a
$\Delta$
-guided Metropolis–Haar kernel

Below is a set of necessary conditions to build a Haar mixture kernel
 $Q_*$
and a Metropolis–Haar kernel
 $(Q_*,\Pi)$
:
-
1.
$G=(G,\times)$
is a locally compact topological group equipped with the Borel
$\sigma$
-algebra and the right Haar measure
$\nu$
. -
2. The state space E is a left G-set.
-
3. The measure
$\mu$
is a
$\sigma$
-finite measure and Q is a
$\mu$
-reversible Markov kernel on
$(E,\mathcal{E})$
. -
4. There exists a Markov kernel
$K(x,\mathrm{d} g)$
as in (7).


Then we can construct a Haar–mixture kernel
 $Q_*$
as in (8). Below is an additional set of necessary conditions to build a
 $\Delta$
-guided Metropolis–Haar kernel:
-
1.
$G=(G,\le\!)$
is an ordered group, and
$G=(G,\times)$
is a unimodular locally compact topological group. -
2.
$\Delta$
is a G-statistic. -
3.
$\Delta$
is sufficient for Q.


Based on the above necessary conditions, we think it is not difficult to construct the Haar mixture kernel
 $Q_*$
as in Algorithm 2. In practice, we also need to think about the efficiency of sampling from
 $K(x,\mathrm{d} g)$
and the cost of evaluating
 $\Delta x$
, and we will present the details with some concrete examples in the next section.
4.3. Examples of
$\Delta$
-guided Metropolis–Haar kernels

Here we present some of the
 $\Delta$
-guided Metropolis–Haar kernels.
Example 14. (Guided Metropolis autoregressive mixture kernel.) The Metropolis kernel of
 $(Q,\Pi)$
with the proposal kernel Q defined in Example 1 is called the preconditioned Crank–Nicolson kernel. This kernel was studied in [Reference Beskos, Roberts, Stuart and Voss8, Reference Cotter, Roberts, Stuart and White13, Reference Neal39]. The Metropolis–Haar kernel with the Haar mixture kernel
 $Q_*$
in Example 4 is called the mixed preconditioned Crank–Nicolson kernel. This kernel was developed in [Reference Kamatani28, Reference Kamatani29]. The
 $\Delta$
-guided Metropolis–Haar kernel of
 $(Q_*,\Pi)$
with
 $E=\mathbb{R}^d$
and
 $G=\mathbb{R}_+$
, called the
 $\Delta$
-guided mixed preconditioned Crank–Nicolson kernel, can be constructed as in Definition 7. In this case, for a constant
 $x_0\in\mathbb{R}^d$
and a symmetric positive definite matrix M,
 $\Delta x=(x-x_0)^{\top}M^{-1}(x-x_0)$
,
 $K(x,\mathrm{d} g)=\mathcal{G}(d/2, \Delta x/2)$
,
 $Q_g(x, \mathrm{d} y)=\mathcal{N}_d(x_0+(1-\rho)^{1/2}(x-x_0),g^{-1}\rho M)$
, and
 $\mu_*(\mathrm{d} x)\propto (\Delta x)^{-d/2}\mathrm{d} x$
. We can construct the
 $\Delta$
-guided Metropolis–Haar kernel as in Algorithm 2.
Example 15. (Guided Metropolis multivariate beta--gamma mixture kernel.) The Metropolis kernel of
 $(Q,\Pi)$
and the Metropolis–Haar kernel of
 $(Q_*,\Pi)$
in Example 11 can be defined naturally, and the former kernel was studied in [Reference Hosseini27]. The
 $\Delta'$
-guided Metropolis–Haar kernel with
 $\Delta'(x)=x_1\times\cdots \times x_d$
is constructed using K,
 $Q_g$
, and
 $\mu_*$
as in Example 11. In this case,
 $E=G=\mathbb{R}^d_+$
.
Example 16. (Guided Metropolis multivariate chi-squared mixture kernel.) The Metropolis kernel of
 $(Q,\Pi)$
and that of
 $(Q_*,\Pi)$
in Example 10 can be defined naturally. The
 $\Delta$
-guided kernel with
 $\Delta x=x_1+\cdots +x_d$
is constructed using K,
 $Q_g$
, and
 $\mu_*$
as in Example 10. In this case,
 $E=\mathbb{R}^d_+$
and
 $G=\mathbb{R}_+$
.
5. Simulation
5.1.
$\Delta$
-guided Metropolis–Haar kernel on
$\mathbb{R}^d$


In this simulation, we consider the autoregressive-based kernel considered in Example 14. More precisely, we study the preconditioned Crank–Nicolson kernel, the mixed-preconditioned Crank–Nicolson kernel, and the
 $\Delta$
-guided mixed preconditioned Crank–Nicolson kernel. The random-walk Metropolis kernel is also compared for reference. All these methods are gradient-free methods, in the sense that the proposal kernel does not use the derivative of
 $\log\pi(x)$
. Although this may sound daunting, sometimes a simple structure leads to robustness and efficiency, as shown through simulation experiments. Moreover, parameter tuning for these Markov kernels based on a reversible proposal kernel is relatively straightforward. We can learn the parameters of the reference measure
 $\mu$
or
 $\mu_*$
using the standard technique, by treating the Markov chain Monte Carlo outputs as if they came from identical and independent observations of
 $\mu$
or
 $\mu_*$
, even though
 $\mu_*$
is generally an improper distribution. Other parameters, such as step size, can be tuned by monitoring the acceptance probability. Since parameter tuning is not our main focus, we do not elaborate on this point in this paper.
We also compare these methods with gradient-based, informed algorithms. The Metropolis-adjusted Langevin algorithm [Reference Roberts and Tweedie52, Reference Rossky, Doll and Friedman54] and the Hamiltonian Monte Carlo algorithm [Reference Duane, Kennedy, Pendleton and Roweth17, Reference Neal40] are popular gradient-based algorithms. Furthermore, we consider methods that use both gradient-based and autoregressive-kernel-based ideas. This class includes, for example, the infinite-dimensional Metropolis-adjusted Langevin algorithm [Reference Beskos, Roberts, Stuart and Voss8, Reference Cotter, Roberts, Stuart and White13], a marginal sampler proposed in [Reference Titsias and Papaspiliopoulos60] which we will refer to as marginal gradient-based sampling, and the infinite-dimensional Hamiltonian Monte Carlo [Reference Beskos4, Reference Neal40, Reference Ottobre, Pillai, Pinski and Stuart43].
We performed all experiments using a desktop computer with 6 Intel i7-5930K (3.50GHz) CPU cores. All algorithms other than the Hamiltonian Monte Carlo algorithm were coded in R, Version 3.6.3 [47], using the RcppArmadillo package, Version 0.9.850.1.0 [Reference Eddelbuettel and Sanderson18]. The results for the Hamiltonian Monte Carlo algorithm were obtained using RStan, Version 2.19.3 [59]. For a fair comparison, we used a single core and chain for RStan. The code for all experiments is available in the online repository at https://github.com/Xiaolin-Song/Non-reversible-guided-Metropolis-kernel.
5.1.1. Discrete observation of stochastic diffusion process.
First we consider a problem in which it is difficult to apply gradient-based Markov chain Monte Carlo methodologies because of the high cost of derivative calculation. Let
 $\alpha\in\mathbb{R}^k$
. Suppose that
 $(X_t)_{t\in [0,T]}$
is a solution process of a stochastic differential equation
 \begin{align*}\mathrm{d} X_t=a(X_t,\alpha)\mathrm{d} t+b(X_t)\mathrm{d} W_t;\; X_0=x_0,\end{align*}
where
 $(W_t)_{t\in [0,T]}$
is the d-dimensional standard Wiener process, and
 $a\;:\;\mathbb{R}^d\times\mathbb{R}^k\rightarrow \mathbb{R}^d$
and
 $b\;:\;\mathbb{R}^d\rightarrow \mathbb{R}^{d\times d}$
are the drift and diffusion coefficient, respectively. We only observe
 $X_0, X_h, X_{2h},\ldots, X_{Nh}$
, where
 $N\in\mathbb{N}$
and
 $h=T/N$
.
We consider a Bayesian inference based on the local Gaussian approximated likelihood, since an explicit form of the probability density function is not available in general. The local Gaussian approximation approach, including the simple least-squares estimate approach, has been studied in, for example, [Reference Florens-zmirou19, Reference Prakasa Rao45, Reference Prakasa Rao46, Reference Yoshida66]. See also [Reference Beskos, Papaspiliopoulos and Roberts5, Reference Beskos, Papaspiliopoulos, Roberts and Fearnhead6] for a non-local Gaussian approach based on unbiased estimation of the likelihood.
We consider a Bayesian inference for
 $\alpha\in \mathbb{R}^{50}$
using the local Gaussian approximated likelihood. We set the diffusion coefficient to be
 $b\equiv 1$
and the drift coefficient to be
 \begin{align*}a(x,\alpha)=\frac{1}{2}\nabla\log\pi(x-\alpha),\end{align*}
with
 $\pi(x)\propto 1/(1+x^{\top}\Sigma^{-1}x/20)^{35}$
, where
 $\pi(x)$
is the probability density function with respect to the Lebesgue measure. See [Reference Kotz and Nadarajah32]. Here
 $\Sigma$
is generated from a Wishart distribution with 50 degrees of freedom and the identity matrix as the scale matrix. The terminal time is
 $T=10$
and the number of observations is
 $N=10^3$
. The prior distribution is a normal distribution
 $\mathcal{N}_{50}(0,10\;I_{50})$
.
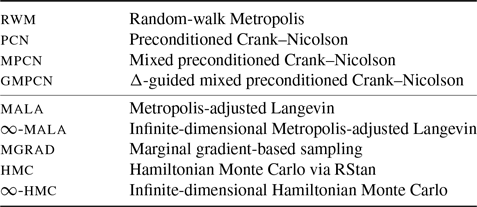
The Markov kernels used in this simulation are listed in Table 1. The first four kernels in the table are gradient-free kernels. The last five kernels are gradient-based, informed kernels. All kernels other than the first, fifth, and eighth algorithms in Table 1 use the prior distribution as the reference distribution. ‘Reference measure’ here means that either the proposal kernel itself is reversible with respect to the measure, or the proposal kernel approximates another Markov kernel that is reversible with respect to the measure.
Markov kernels in Section 5.1. The first four algorithms are gradient-free algorithms. The last five algorithms are gradient-based, informed algorithms.

We apply the Markov chain Monte Carlo algorithms via a two-step procedure. In the first step, we run the random-walk Metropolis algorithm as a burn-in stage. For Gaussian reference kernels,
 $x_0$
is estimated by the empirical mean in the burn-in stage. After the burn-in, we run each algorithm. The results are presented in Table 1 and Figure 2. In this example, the covariance matrix is not preconditioned; we use the prior’s covariance matrix instead.


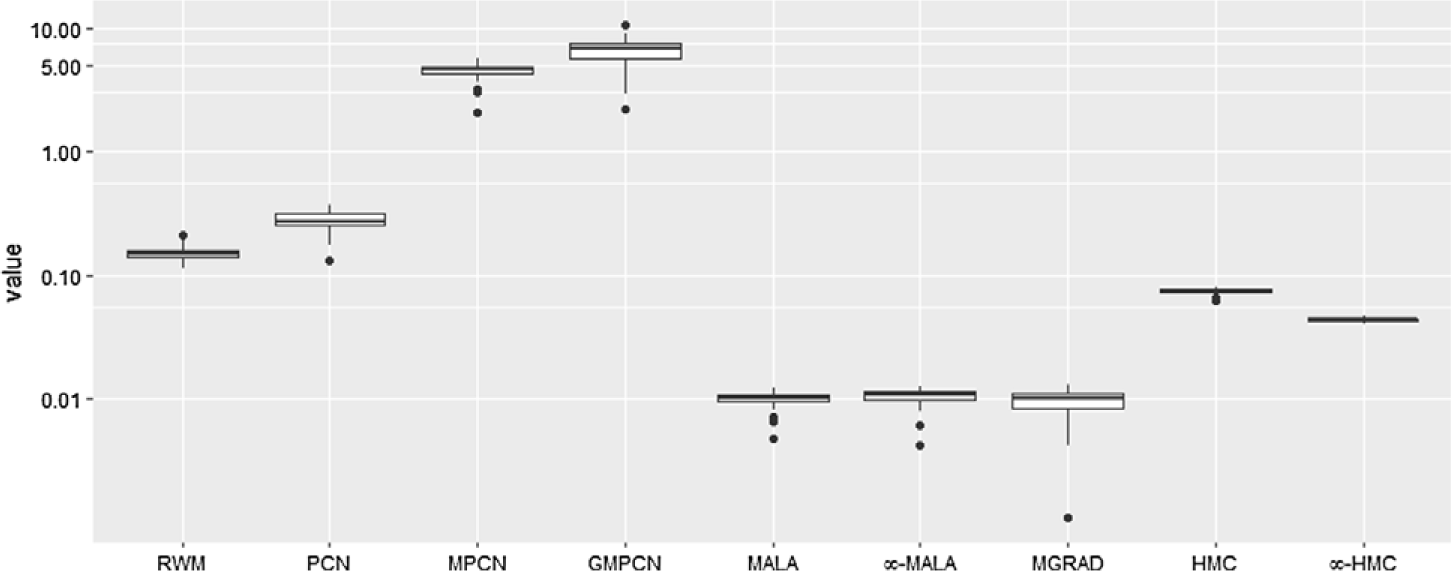
The acceptance rates for the first two algorithms in Table 1 were set at 25%. For the third and fourth algorithms, acceptance rates were set to 30% to 50%. As suggested by [Reference Roberts and Rosenthal51, Reference Titsias and Papaspiliopoulos60], for the fifth, sixth, and seventh algorithms, the acceptance probabilities were set to approximately 60%. The eighth algorithm was tuned in two steps. First, we set the number of leapfrog steps to 1 and tuned the leapfrog step size so that the acceptance rate would be between 60% and 80% according to [Reference Beskos, Pillai, Roberts, Sanz-Serna and Stuart7]. Then we increased the number of leapfrog steps until the time-normalised effective sample size decreased. The tuning parameters of the Hamiltonian Monte Carlo algorithm were controlled using the RStan package. As a quantitative measure of efficiency, we used the effective sample size of log-likelihood per second. It was estimated using the R package coda [Reference Plummer, Best, Cowles and Vines44].
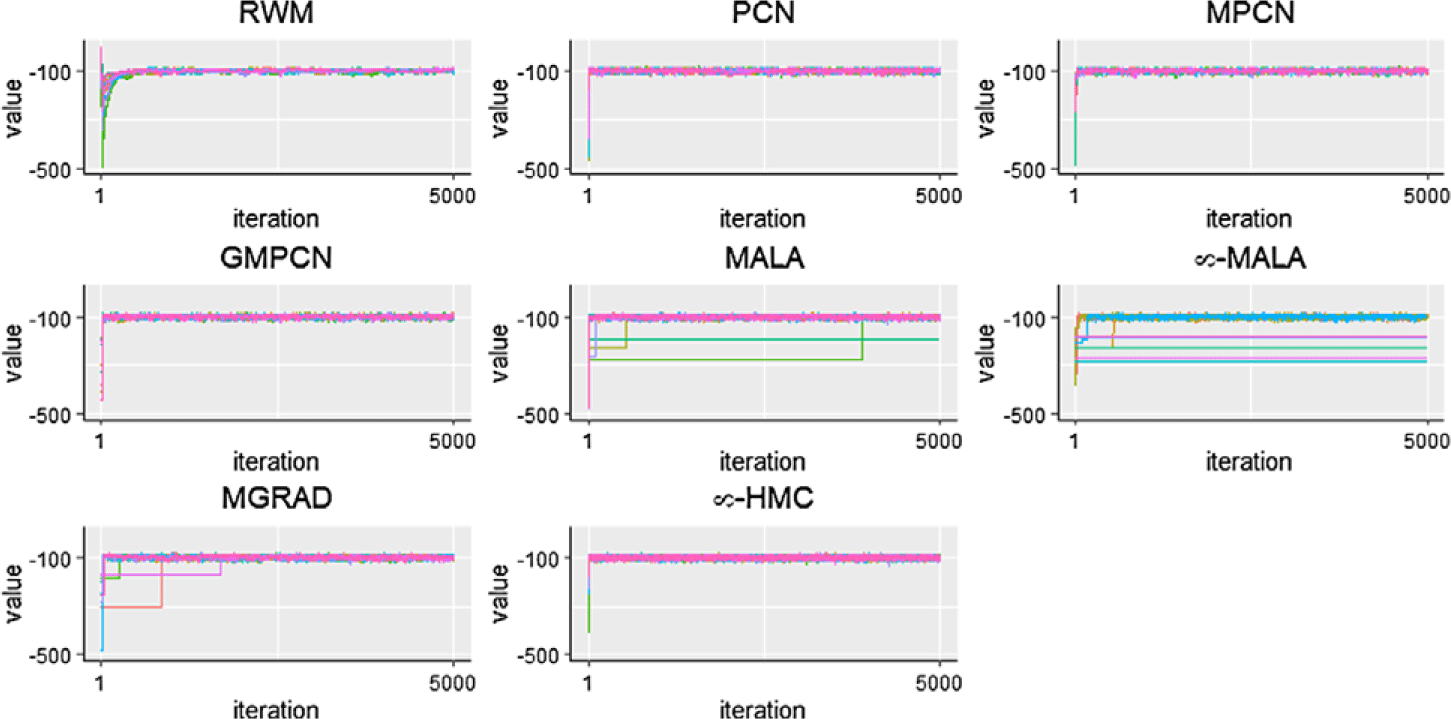
The effective log-likelihood sample sizes per second are shown in Figure 1. The box plot is constructed from 50 independent simulations for each algorithm. The fifth, sixth, and seventh algorithms, which are Langevin-diffusion-based algorithms, show the worst performance. Since we have to evaluate the derivatives several times per step of the Markov chain, the Hamiltonian Monte Carlo and the infinite-dimensional Hamiltonian Monte Carlo are still worse than the random-walk Metropolis kernel. The random-walk Metropolis kernel and the preconditioned Crank–Nicolson kernel are better than gradient-based kernels, but the mixed preconditioned Crank–Nicolson kernel is much better. The
 $\Delta$
-guided version is even better than the non-
 $\Delta$
-guided version thanks to the non-reversible property. A trace plot is also shown in Figure 4; it illustrates that the Hamiltonian Monte Carlo method has good performance per iteration, but the cost is high compared to other algorithms.
5.1.2. Logistic regression.
Next we apply the algorithms to a logistic regression model with the Sonar data set from the University of California, Irvine, repository [Reference Dua and Graff16]. The data set contains 208 observations and 60 explanatory variables. The prior distribution is
 $\mathcal{N}(0,10^2)$
for each set of parameters. We used a relatively large variance of the normal distribution, because we did not have enough prior information at this stage.
Estimation of the preconditioning matrix is necessary for this problem because of the existence of a strong correlation between the variables. We performed
 $2.0\times 10^5$
iterations to estimate
 $\mu_0$
and estimated the preconditioning matrix
 $\Sigma_0$
using empirical means. Then we ran
 $10^5$
iterations for each algorithm, discarding the first
 $2\times 10^4$
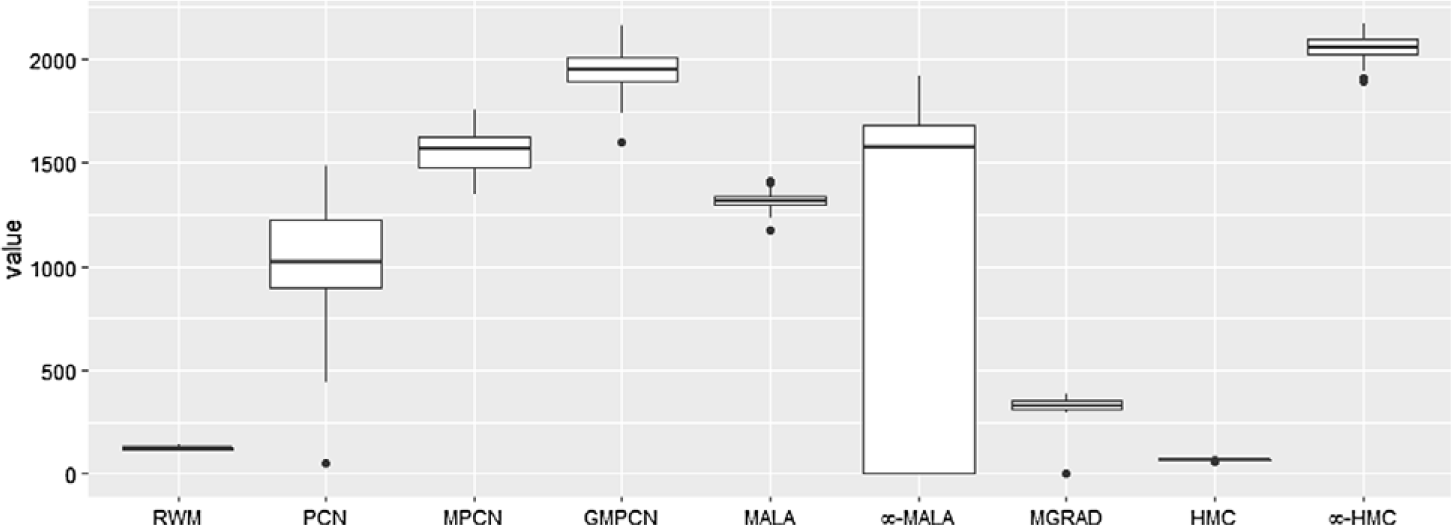
iterations as burn-in. Furthermore, we ran each experiment 50 times using different seeds. We evaluated the effective sample size of log-likelihood per second; the results of all the algorithms are presented in box plots (Figure 3). The algorithms based on the Lebesgue measure (the first, fifth, and eighth algorithms in Table 1) are worse than other algorithms based on the Gaussian reference measure. The performances of the gradient-based algorithms are divergent, which might reflect the sensitivity of the gradient-based algorithms, which is well described in [Reference Chopin and Ridgway12]. In particular, the infinite-dimensional Hamiltonian Monte Carlo algorithm shows better performance in this case, although it shows poor performance in the previous simulation. The
 $\Delta$
-guided mixed preconditioned Crank–Nicolson kernel was slightly worse than infinite-dimensional Hamiltonian Monte Carlo algorithm and better than all the other algorithms. The Metropolis–Haar and
 $\Delta$
-guided Metropolis–Haar kernels show good and robust results for the two simulation experiments.

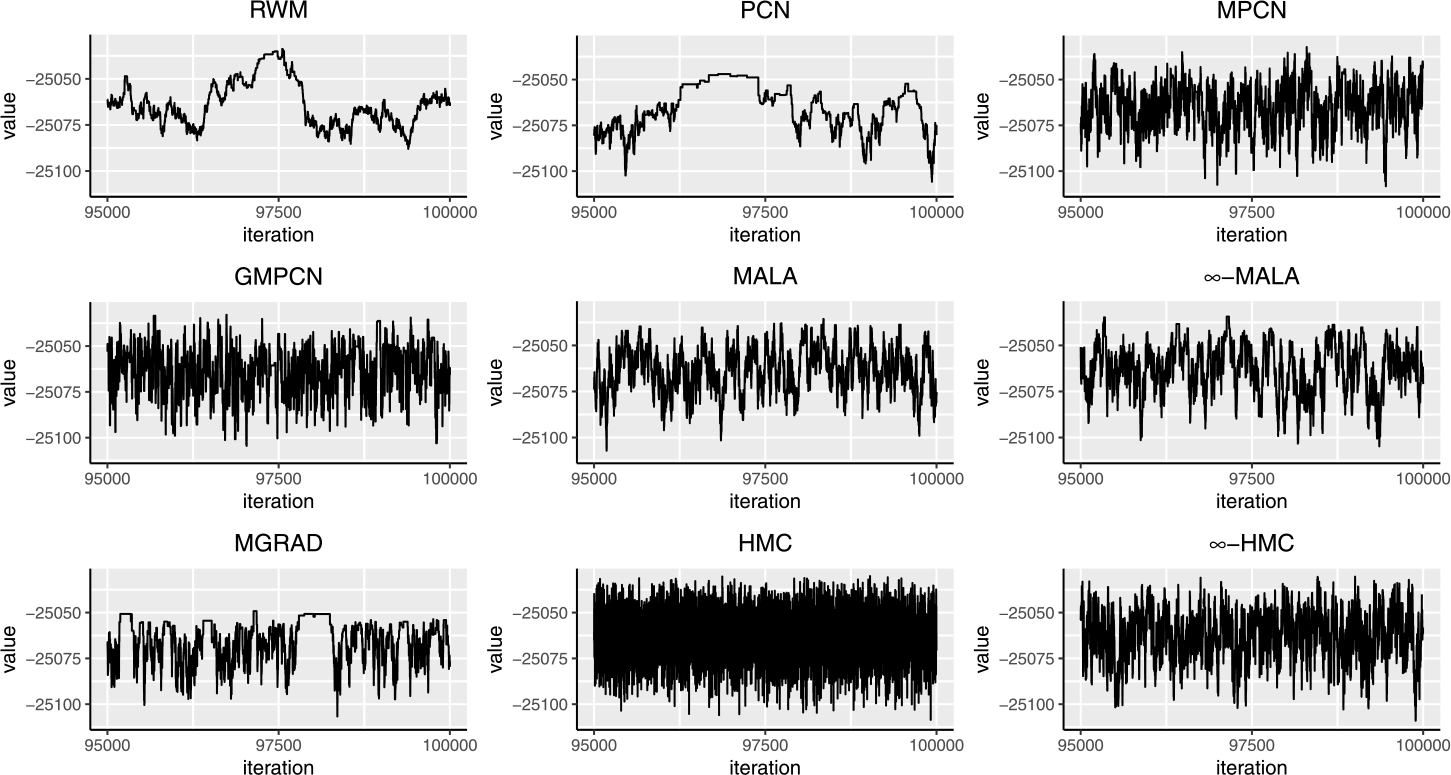
Sampling paths of the logistic regression example illustrated in Section 5.1.2. The Hamiltonian Monte Carlo algorithm is excluded from this simulation because the initial values of the algorithm are automatically selected in the RStan package.

We also investigate the sensitivity of the gradient-based algorithms for the same model as displayed in Figure 4. In this example, 10 initial values are randomly generated from a multivariate normal distribution for each algorithm. The number of iterations of each algorithm is
 $5 \times 10^3$
. The paths of the gradient-based algorithms depend strongly on the initial values, except in the case of the infinite-dimensional Hamiltonian Monte Carlo algorithm.
5.1.3.
Sensitivity of the choice of
$x_0$
.

To illustrate the importance of
 $x_0$
, we additionally run a numerical experiment on a 50-dimensional multivariate central t-distribution with degrees of freedom
 $\nu=3$
and identity covariance matrix [Reference Kotz and Nadarajah32]. The first element of
 $x_0$
is
 $\xi\ge 0$
, and all the other elements are set to be zero. When
 $\xi$
is large, the direction is less important for increasing or decreasing the likelihood. We run the algorithms on the target distribution for
 $10^5$
iterations. The experiment shows that the benefit of non-reversibility diminishes as the importance of the direction shrinks (Table 2).
Effective sample sizes of log-likelihood per second target on a 50-dimensional Student distribution as in Section 5.1.3.


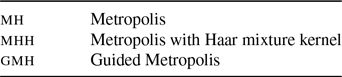
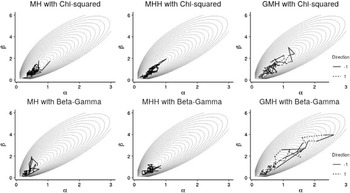
Trace plots of the Metropolis kernels in Section 5.2. The guided kernels (in the rightmost panels) are more variable than their non-guided counterparts. The solid lines correspond to the negative direction and the dashed lines to the positive direction.

5.2.
$\Delta$
-guided Metropolis–Haar kernels on
$\mathbb{R}_+^d$


Next, we consider the beta–gamma-based kernels considered in Example 15 and the chi-squared-based kernels considered in Example 16 with
 $L=1$
. Thus, we consider a total of six Markov kernels. These are the Metropolis kernel, the Metropolis–Haar kernel, and the
 $\Delta$
-guided Metropolis–Haar kernel for each of the beta–gamma-based and chi-squared-based kernels.
Our goal is not to compare the beta–gamma-based kernels with the chi-squared-based kernels, but to compare the guided kernels with the non-guided kernels. In this simulation, we illustrate the difference in behaviour between the guided Metropolis kernel and other kernels by plotting trajectories in two dimensions.
We consider a Poisson hierarchical model of the form
 \begin{align*}x_{m,n}|\theta_m \sim \mathrm{Poisson}(\theta_m),\quad n=1,\ldots, N, \end{align*}
 \begin{align*}\theta_m \sim \mathcal{G}(\alpha,\beta),\quad m=1,\ldots, M, \end{align*}
 \begin{align*}\alpha \sim \mathcal{G}(1/20,1/20), \quad \beta \sim \mathcal{G}(1/20,1/20),\end{align*}
where
 $x=\{x_{m,n}\;:\;m=1,\dots,M,\ n=1,\dots N\}$
is the observation. In our simulations we set
 $M=25$
and
 $N=5$
. The number of unknown parameters is
 $M+2=27$
in this case. The parameter
 $\theta=(\theta_1,\ldots,\theta_M)$
has a closed-form conditional distribution
 \begin{align*}\theta_m|\alpha,\beta,x \sim \mathcal{G}\left(\sum_{n=1}^N x_{m,n}+\alpha,N+\beta\right) \quad m=1,\ldots,M.\end{align*}
Therefore we can use the Gibbs sampler for generating the parameter
 $\theta$
. On the other hand, since the conditional distribution of
 $\alpha, \beta$
is complicated, we apply the Monte Carlo algorithms mentioned above.
We created two-dimensional trajectory plots to illustrate the difference in behaviour between the Metropolis–Haar kernel and the
 $\Delta$
-guided version of it. The tuning parameters are chosen so that the average acceptance probabilities are 30–40% in
 $5 \times 10^4$
iterations. Figure 5 shows the trace plots of the last 300 iterations for the kernels. One can clearly see the larger variation for the guided kernels. Thanks to the incident variables, the guided kernel maintains its direction when the proposed value is accepted. The property of maintaining direction greatly contributes to the increase in variability.
6. Discussion
The theory and application of non-reversible Markov kernels have been under active development recently, but there still exists a gap between the two. In order to close this gap, we have described how to construct a non-reversible Metropolis kernel on a general state space. We believe that the method we propose can make non-reversible kernels more attractive.
As a by-product, we have constructed the Metropolis–Haar kernel. The Haar mixture kernel imposes a new state globally by using a random walk on a group, whereas other recent Markov chain Monte Carlo methods use local topological information derived from target densities. We believe that this sheds new light on the proposed gradient-free, global topological approach. A combination of the global and local (gradient-based) approaches is an area for further research.
In this paper, we have not discussed geometric ergodicity, although ergodicity is clear under appropriate regularity conditions. A popular approach for proving geometric ergodicity is based on the establishment of a Foster–Lyapunov-type drift condition, which requires kernel-specific arguments. On the other hand, our motivation is to build a general framework for the non-reversible Metropolis kernels. Therefore, we have not focused on geometric ergodicity. A more in-depth study should be carried out in that direction. See [Reference Kamatani28] for geometric ergodicity of the mixed preconditioned Crank–Nicolson kernel.
Finally, we would like to remark that the
 $\Delta$
-guided Metropolis–Haar kernel is not limited to
 $\mathbb{R}^d$
or
 $\mathbb{R}_+^d$
. It is possible to construct the kernel on the space of
 $p\times q$
matrices and the space of symmetric
 $q\times q$
positive definite matrices, where p, q are any positive integers. The extension of
 $\Delta$
-guided Metropolis–Haar kernels to other state spaces is left to future work.
Acknowledgements
The authors would like to thank the executive editor, editor, and reviewers for their helpful and constructive comments.
Funding information
K. Kamatani is supported by JSPS KAKENHI Grant No. 20H04149 and JST CREST Grant No. JPMJCR14D7. X. Song is supported by the Ichikawa International Scholarship Foundation.
Competing interests
There were no competing interests to declare which arose during the preparation or publication process of this article.