Introduction
Striped venus clam (SVE), Chamelea gallina (Linnaeus, 1758), is a commercially important species of the Veneridae family (Froglia, Reference Froglia and Caddy1989). Chamelea gallina is distributed in the Black Sea, Aegean coasts and in the north of the Sea of Marmara around the Turkish coasts (Deval, Reference Deval1991; Deval & Oray, Reference Deval and Oray1992). It is also commercially exploited in other areas such as the Mediterranean and the eastern Atlantic (Baeta et al., Reference Baeta, Solís, Ballesteros and Defeo2021). Chamelea gallina is found in large populations, especially in the Black Sea and around the Sea of Marmara, with sandy substratum and at depths of 1–20 m (Bilecik, Reference Bilecik1986; Deval, Reference Deval1995). Catches of SVE in Italy and Turkey account for a large proportion of the total catch, with Turkey ranking first (69.45%) in the world at 52,717 tons of production in 2019 (FAO, 2022). In Italy, the rapid increase in C. gallina production by hydraulic dredges reached a maximum level of about 105,000 tons in 1984 (Froglia, Reference Froglia and Caddy1989) but unplanned overfishing for many years led to a strong decline in landings. Following this destruction, fleet regulation was introduced and quotas were applied. In Italy in 1974, a fleet of 383 boats operated in the SVE fishery, whereas in 1993, the fleet had increased to 778 boats. Ultimately, the European Union (EU) introduced a fleet restriction in 2002 fixed at 585 boats (Scarcella & Cabanelas, Reference Scarcella and Cabanelas2016).
The decrease in Italian production has led the C. gallina processing sector to alternative sources, most importantly to the Turkish coast, resulting in various investments in Turkey by Italian companies. A boat equipped with ‘turbo blower hydraulic dredge’ equipment, brought from Italy, was first used to catch C. gallina for the first time in August 1986 at Tekirdağ on the Turkish coast. As a result, intensive C. gallina fishing began using ‘mechanical dredges’ in addition to 4–5 turbo blower hydraulic dredge boats brought in by Italian collaborators. Chamelea gallina has been exported as live, frozen, and later as a canned product following the establishment of processing plants (Bilecik, Reference Bilecik1986; Deval, Reference Deval1995; Dalgıç et al., Reference Dalgıç, Okumuş and Karayücel2006). This practice was carried out in the Sea of Marmara until the end of the 1990s. From that date, fishers in the Sea of Marmara were banned until the start of the Black Sea fishing season. Although the Black Sea fleet was open to catching in all regions in the first period, the system was switched to a turn-off (fallow) management system for two years, starting from 2004.
Notifications are prepared by the authorities and in this way, place, time, shell height, etc. prohibitions apply. The minimum conservation reference size is determined according to the shell height (≥17 mm), (DGFA, 2020). Sparre & Venema (Reference Sparre and Venema1992) stated that necessary precautions should be taken by defining the conditions of existing stocks in the area so that the natural living resources can be continuously utilized at the highest production level through renewable management methods. However, benthic organisms play a vital role in the continuity of marine ecosystems. Benthic organisms are integral to the remineralization of nutrients supporting pelagic primary production and in the storage of organic matter (Thrush et al., Reference Thrush, Gray, Hewitt and Ugland2006). At the same time, benthic organisms constitute most of the nutrients in the marine ecosystem and play an active role in the energy cycle (Bagher et al., Reference Bagher, Negar, Preetha and Simin2007). Thus, it is important to understand the natural history of C. gallina, one of the dominant species in the benthic ecosystem of the Black Sea, as well as being commercially important. This study was carried out to investigate the population dynamics of SVE for the first time off the Turkish coast.
Materials and methods
Sampling design and survey area
The data for the analysis were collected from hydraulic dredge experimental surveys, using the swept area method (Sparre & Venema, Reference Sparre and Venema1992). Station selection followed a stratified-random sampling design, where the number of stations allocated to a depth stratum is proportional to its area. Investigation of biomass surveys was conducted annually, in summer (July) in 2011 and again in 2012. In addition, seasonal sampling was done to determine the growth parameters.
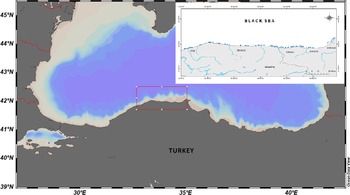
The study covered the areas between Sinop and Cide in the western Black Sea. The survey area was divided into five sub-areas, based on the region's structure. The sub-regions are Sinop-Sarıkum, Sinop-Ayancık, Sinop-Türkeli, Kastamonu-İnebolu and Kastamonu-Cide. The coastal length between these areas is ~90 nautical miles. The study area extended from the coastline to 20 m depth. The research area was divided into four strata, according to depth: Stratum 1 (0–5 m), Stratum 2 (5–10 m), Stratum 3 (10–15 m) and Stratum 4 (15–20 m) (Figure 1).
Map showing the study areas and sampling stations in the Western Black Sea.

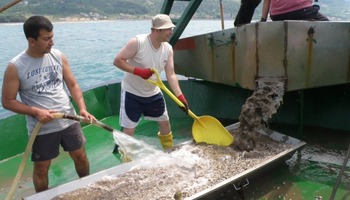
A turbo blower hydraulic dredge was used for the sampling. The mouth opening of the hydraulic dredge was 350 cm and the length was 300 cm. Samples collected from the turbo blower hydraulic dredge were placed directly into the collection box without sieving (Figure 2). Once the dredge was lowered into the sea and reached the bottom, the boat moved at a speed of ~2.0 knots (nautical miles per hour) and another engine started to inject water (up to 3 bar pressure) into the dredge with the help of a hose. Each operation took 2 min.
Sampling procedure during the SVE survey.

Following hydraulic dredge sampling at sea, 10 kg sub-samples were obtained. The catch composition was categorized as C. gallina, bycatch and discard species for each tow, and all the samples were identified and weighed (0.1 g). Lengths of the SVE samples and height frequency were measured. The height frequency distribution was constructed according to sub-samples of 600 g and over, depending on the condition of the population. In a sample with excess recruitment, 300 g subsamples were taken (Froglia, Reference Froglia and Caddy1989). Shell height frequency was measured for 33,570 individuals (Figure 2). Length, height, width and weight parameters were obtained for all depth layers (Strata 1–4) representing each sub-area (Cide, İnebolu, Türkeli, Ayancık and Sarıkum). The length, height and width of the SVE specimens were measured with digital callipers (0.01 mm). Total wet weight was measured using a digital balance with a precision of 0.1 g. Seasonal sampling was done to calculate the growth parameters. Samples were collected by dredge at seasonal intervals between February, May, July, December 2011 and 2012 years. Tows were performed parallel to the shoreline for 10 min at depths of 0–20 m. Sampling was carried out İnebolu, Türkeli, Ayancık and Sarıkum regions to represent the sub-areas.
Estimation of C. gallina biomass
SVE catch per unit area (km2) was calculated by taking standard draft shots. Total stock size for the entire study area, catch per unit area and biomass were calculated. The formula proposed by Sparre & Venema (Reference Sparre and Venema1992) was used to determine the area covered by the hydraulic dredge in 1 h towards the calculation of the size of the swept area. The formulas for average biomass and total biomass per unit area are given below.

where C w is the weight of C. gallina in one sampling, a = area scanned in one haul (km2), C a is the catch per unit area (kg km−2) in one haul, b = biomass per unit area (kg km−2) and X 1 is the coefficient of catch. The hydraulic dredge coefficient of fishing has been accepted as ‘1’. The biomass formula could be written more clearly as follows:

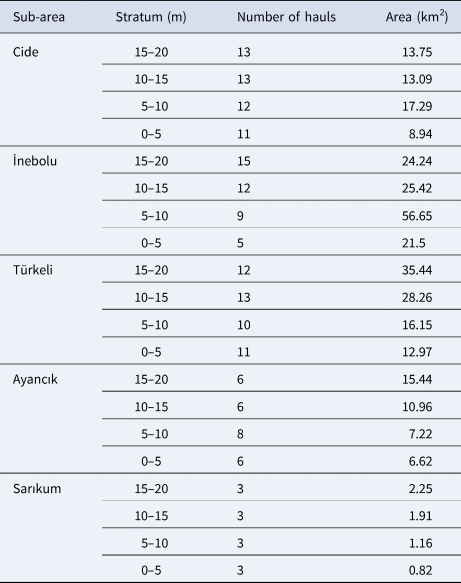
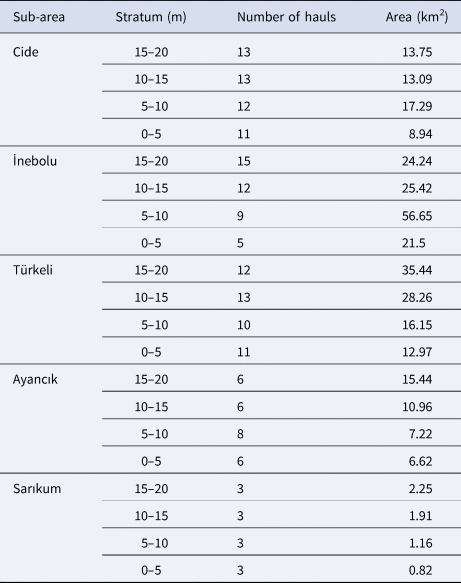
The stock size was estimated according to the distributed areas of C. gallina (Table 1).

where a = swept area, X 2 is a fraction expressing the width of the area swept by the net divided by the length of the head rope, D = distance covered, and hr is the length of the head-rope. The towing distance was estimated in units of km2 (1 nautical mile = 1.852 km), by:

Striped venus clam (Chamelea gallina) bed areas (km2) and number of hauls by subarea
Lat1 is the latitude at the start of haul (degrees) and Lat2 is the latitude at end of haul (degrees). Similarly, Lon1 is the longitude at the start of haul (degrees) and Lon2 is the longitude at end of haul (degrees).
The stock size was estimated according to the area distribution of C. gallina (Table 1). In this study, data were collected annually from the same 174 stations selected to represent the continental shelf of the western region of Turkey (Table 1). C. gallina distribution biomass was created using ESRI ArcGIS Desktop 10.1 software. Data were analysed in R (R Core Team, 2020).
Growth
Length-weight relationships of C. gallina were examined using the equation below (Le Cren, Reference Le Cren1951).

where a and b are regression constants, a = intercept, b = slope, W = total body weight (g) and SL = shell length (mm). To determine the growth pattern, a and b values were found by subjecting the length and weight to regression analysis. With the resulting ‘b’ value, it was found that the growth was isometric (H 0, b = 3) or allometric with the formula ts = (b−3)/S b (Sokal & Rohlf, Reference Sokal and Rohlf1987) where ts denotes the Student's t-test value, b represents slope and S b signifies the standard error of ‘b’ value. For the calculation of shell length-height and height-width relationships, the formula of Arneri et al. (Reference Arneri, Giannetti and Antolini1998) was used:

where H = height (mm), W = width (mm) and SL = shell length (mm). A three-way analysis of variance was performed using the STATISTICA software package (version 10) to detect differences between years, sub-areas and depths. A P value of <0.05 was accepted to indicate significance for all statistical analyses (Zar, Reference Zar1984).
The growth parameters of von Bertalanffy were estimated according to Beverton & Holt (Reference Beverton and Holt1959):

where L t is the length at time t, L ∞ is the theoretical asymptotic length, K is the growth coefficient and t 0 is the theoretical age at length zero. The values of L ∞ and K were calculated using ELEFAN in the TropFishR version 1.6.3 (SDG 14.4.1., 2022). The value of t 0 was calculated using the empirical equation of Pauly (Reference Pauly1983) as follows:

The growth performance index was compared using different growth values reported in the literature according to the Pauly & Munro (Reference Pauly and Munro1984) formula:

Natural mortality (M) was calculated by Pauly's (Reference Pauly1980) empirical equation:

where M = natural mortality, L ∞ and k are parameters of the von Bertalanffy equation, T is the mean annual temperature (°C) which is assumed to reflect the local temperature and set T = 16°C (Pauly, Reference Pauly1980). Commercial fisheries of C. gallina were not carried out in the research areas during the survey years. For this reason, the fishery mortality (F) was evaluated as zero. Since F = 0 in the Z = M + F equation, it is taken as Z = M.
Results
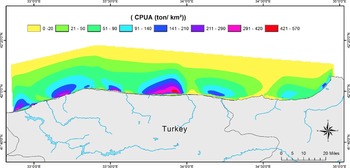
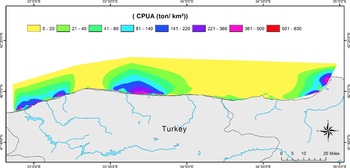
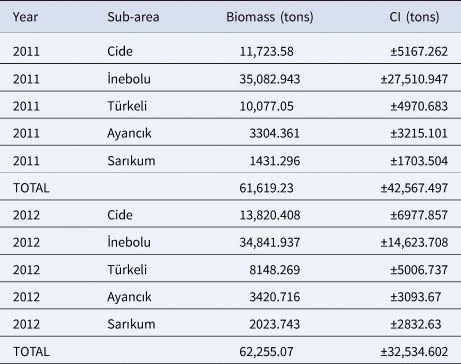
In 2011, total SVE stock biomass in the sub-area of Cide was estimated as 11,723.58 ± 5167.26 tons and this figure increased to 13,820.41 ± 6977.86 tons in 2012. While total stocks in the İnebolu sub-area were 35,082.94 ± 27,510.95 tons in 2011, this figure decreased to 34,841.94 ± 14,623.71 tons in 2012 (Figures 3 & 4). The Türkeli sub-area is subject to year-round fishing for SVE. This sub-area stock was estimated at 10,077.05 ± 4970.68 tons in 2011 and 8148.27 ± 5006.74 tons in 2012 (Figures 3 and 4). In 2012, a flood event occurred in the Türkeli sub-area which coincided with the study conducted in July 2012. At this time it was observed that there was a die-off amongst C. gallina due to lack of oxygen, especially at depths from 0–10 m. The Ayancık sub-area is also subject to year-round fishing for SVE. The stock was estimated as 3304.36 ± 3215.10 tons in 2011 and 3420.72 ± 3093.67 tons in 2012 (Figures 3 and 4). Finally, the Sarıkum sub-area is again subject to year-round fishing for SVE. Here, the stock was estimated as 3304.361 ± 3215.101 tons in 2011 and 3420.716 ± 3093.67 tons in 2012 (Figures 3 and 4).
Distribution of biomass of striped venus clam (Chamelea gallina) CPUA (tons km−2) in 2011.

Distribution of biomass of striped venus clam (Chamelea gallina) CPUA (tons km−2) in 2012.

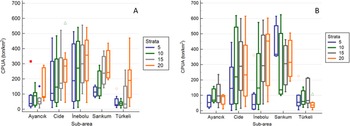
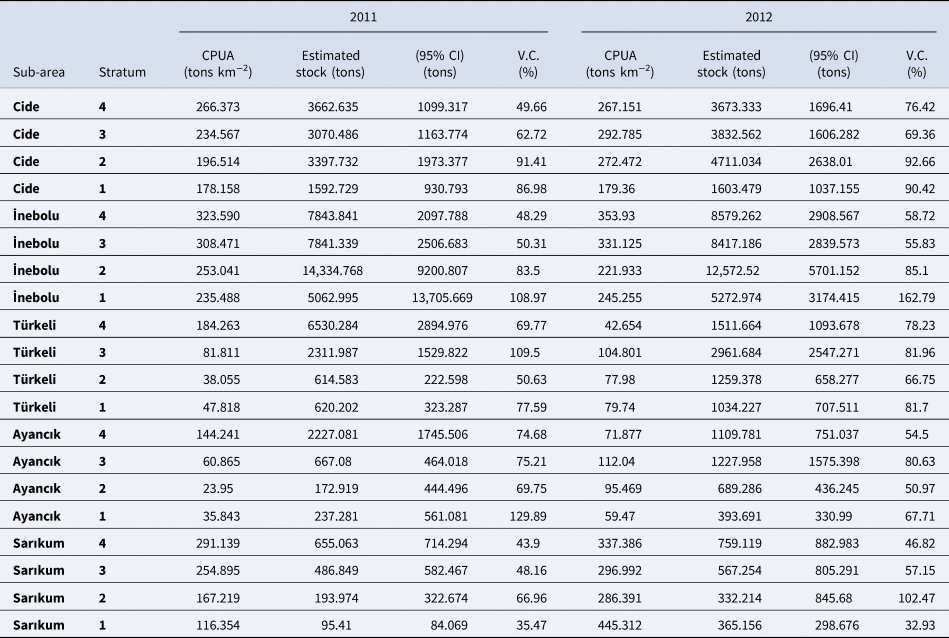
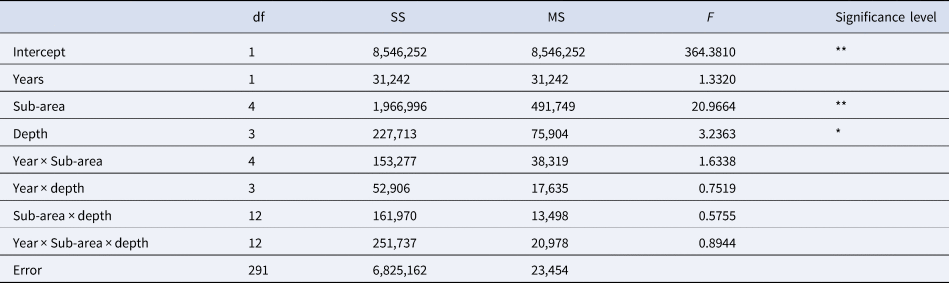
Biomass according to sub-regions is summarized in Figure 5 and Tables 2 and 3. The total stock estimations for the study area were 61,619.23 tons in 2011 and 62,255.07 tons in 2012. A decrease in stock biomass was observed in the İnebolu and Türkeli sub-areas. The biomass of C. gallina according to sub-area and depth in the sampling area had a significant difference (P < 0.05). However, overall there was no difference in total stock estimates for the five sub-areas between 2011 and 2012 (P > 0.05) (Table 4).
Average CPUA (tons km−2) distribution by region in 2011 (A) and 2012 (B) of striped venus clam (Chamelea gallina).

Estimated biomass of striped venus clam (Chamelea gallina) according to sub-areas

Estimated biomass of striped venus clam (Chamelea gallina) in sub-regions within the study area

Results of three-way ANOVA testing for biomass (tons km−2) of striped venus clam (Chamelea gallina) with years, sub-area and depth as fixed factors. df, degrees of freedom; SS, sum of squares; MS, mean square; F, F value; significance levels *P < 0.05, **P < 0.01.

Size–frequency distribution, length–weight relationships, growth and mortality
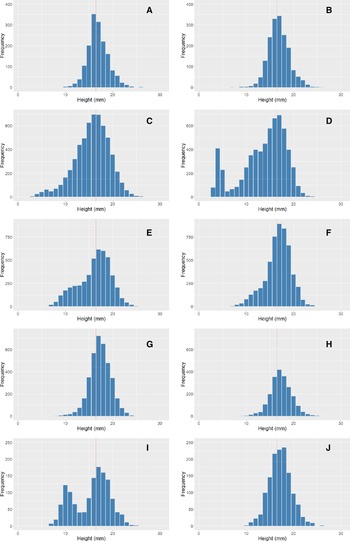
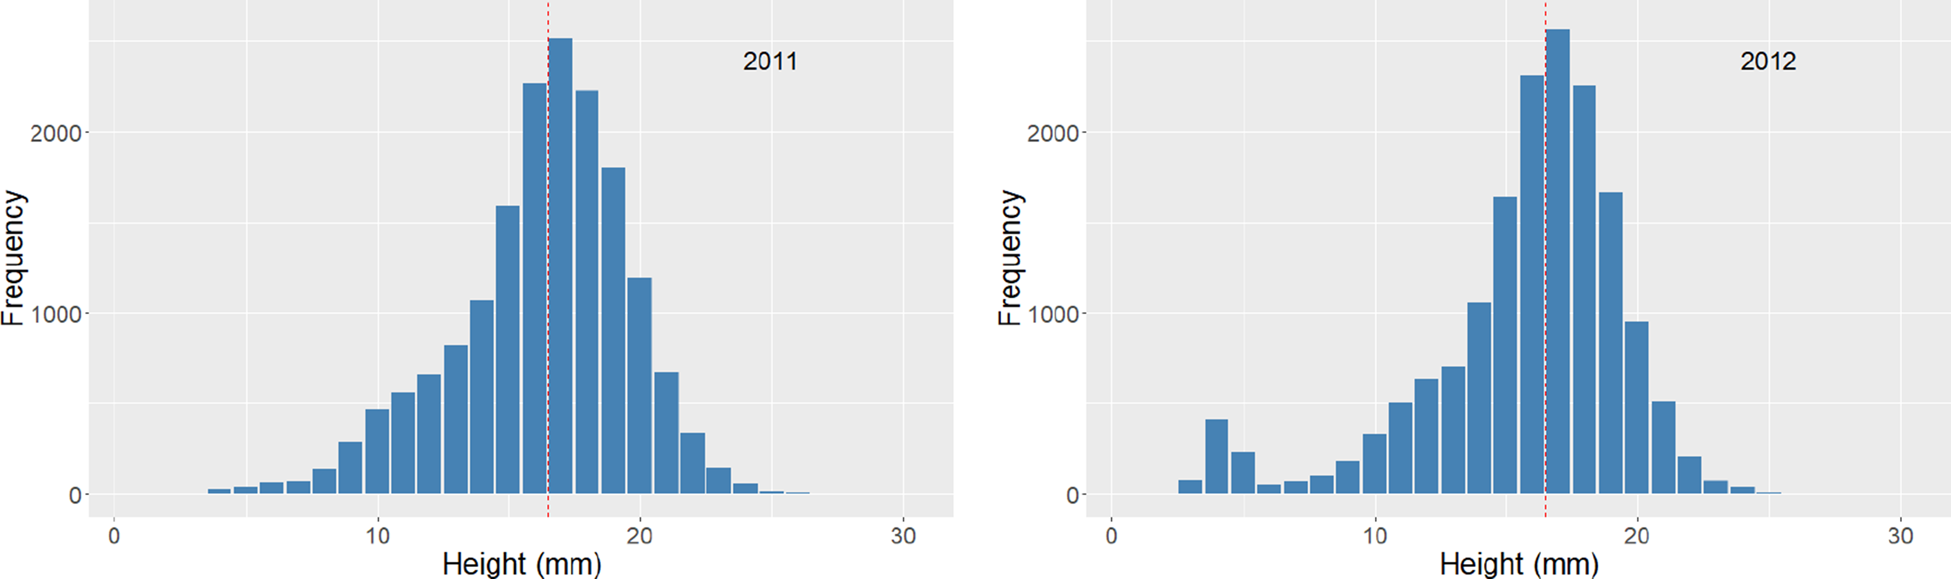
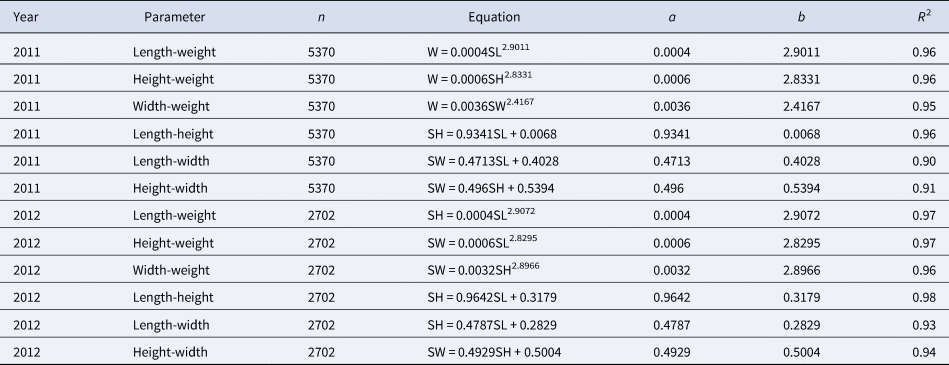
The proportion of individuals under commercial shell height (<17 mm) in the population was relatively high in the Cide subarea. The ratio of individuals under commercial size was 43.1% in 2011, which increased to 56.1% in 2012 year. In the other sub-regions juvenile rates were found to be below 35% (Figure 6). An overall evaluation of height distribution was 16.77 and 16.26 mm by year (Figure 7). The length-weight, height-weight and width-weight relationships of C. gallina sampled in the research area in 2011 and 2012 were examined (Table 5).
Shell height (mm) frequency distribution (number of individuals) of striped venus clam (Chamelea gallina) at five different habitats: Habitats a and b – Ayancık 2011 and 2012, Habitats c and d – Cide 2011 and 2012, Habitats e and f – İnebolu 2011 and 2012, Habitats g and h – Türkeli 2011 and 2012, Habitats i and j – Sarıkum 2011 and 2012.

Shell height-frequency distribution of striped venus clam (Chamelea gallina) (2011–2012).

Relationships of length, height, width and weight parameters of striped venus clam (Chamelea gallina)

W, weight; SL, Shell length; SH, Shell height; SW, Shell width.
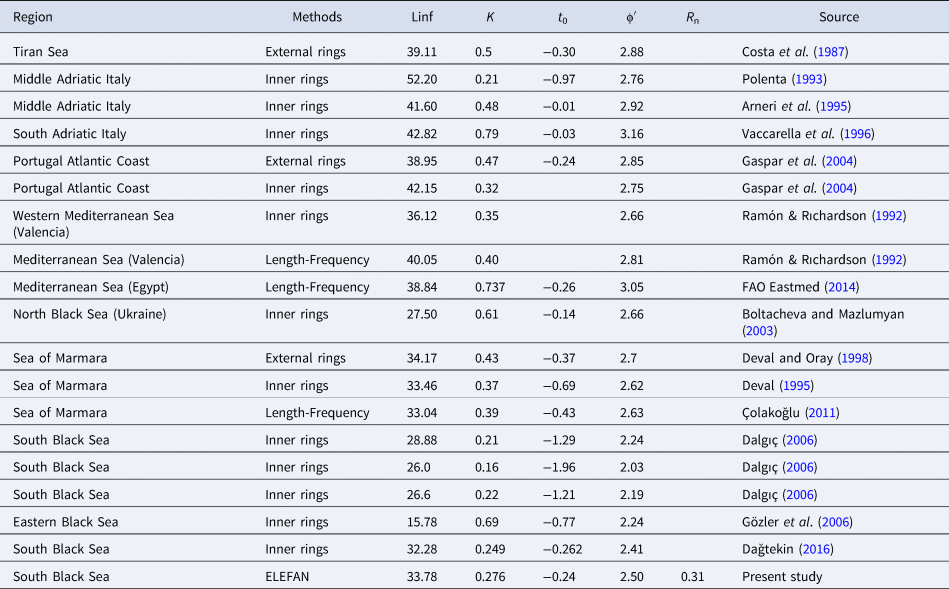
L ∞ of VBG parameters was 33.78 mm, K:0.31 (year−1), and t 0 was −0.24 (year) respectively. The von Bertalanffy growth (VBG) curves fitted by ELEFAN with genetic algorithm were given in Figure 8. The estimated natural mortality rate (M) and total mortality (Z) was 0.57 year−1.
Uploaded raw (A) and restructured (B) length-frequency data of striped venus clam (Chamelea gallina) with overlaid von Bertalanffy growth (VBG) curves fitted by ELEFAN with genetic algorithm.

The abundance of by-catch species
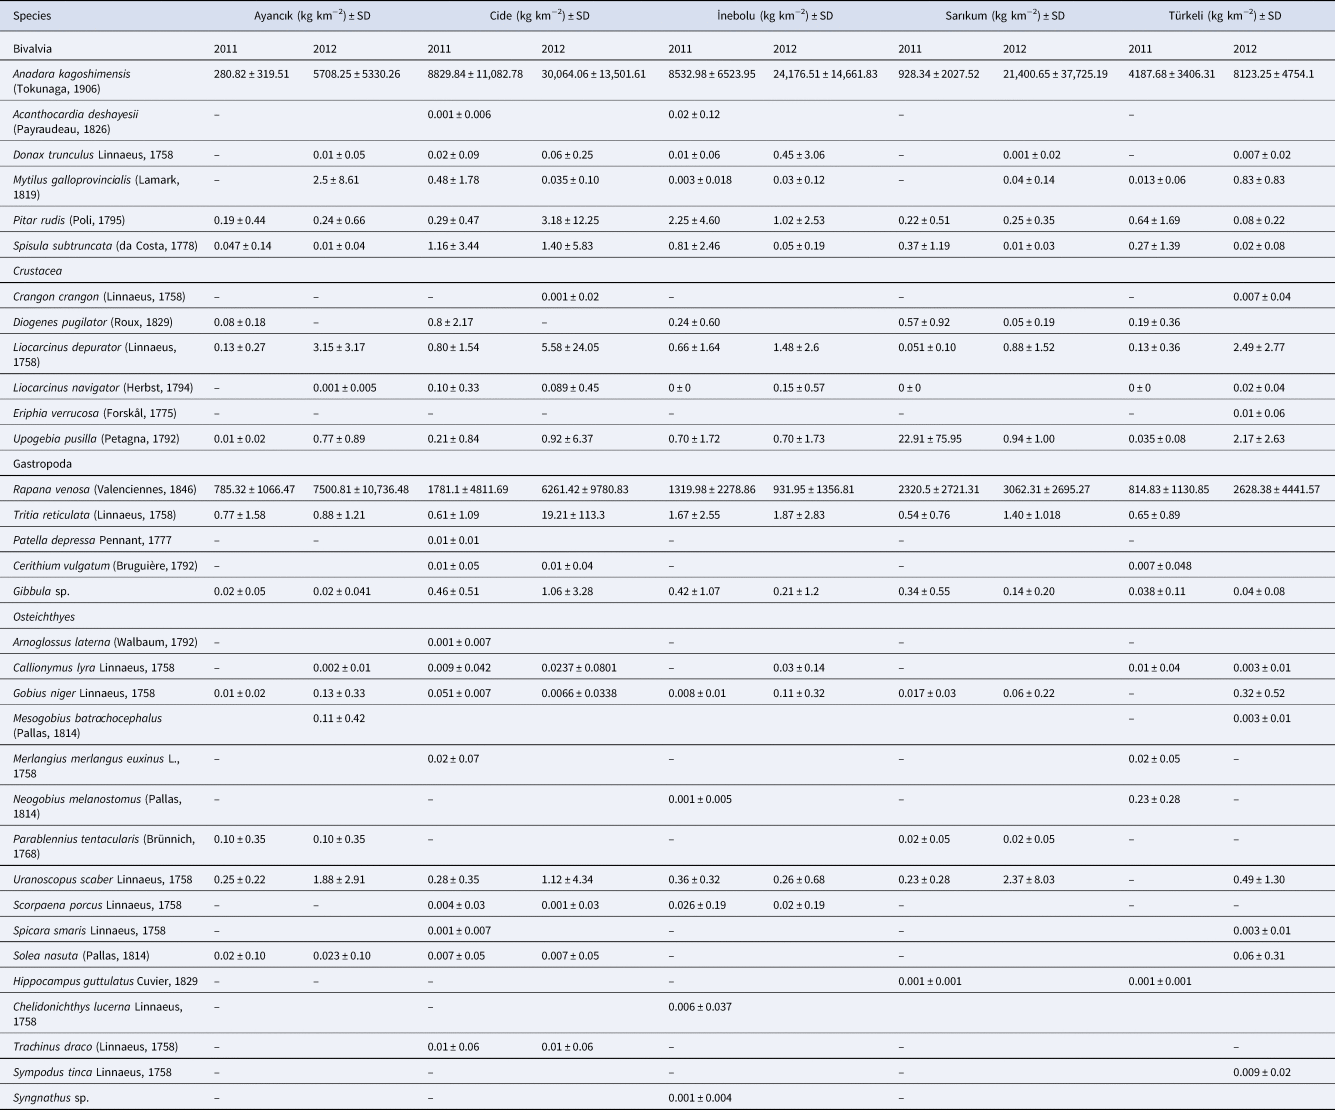
Within the samples, 32 bycatch species comprised. Within the catches, 32 of the commercial bycatch species comprised 15 Osteichthyes, five gastropods, six crustacea and six bivalves. The number of commercial species other than C. gallina was very low. The dominant species were founded in A. kagoshimensis and R. venosa (Table 6). Rapana venosa, of these species, which are both invasive species, is also a commercial species. The density of Pitar rudis and Spisula subtruncata bivalvia species, which share the same habitat with C. gallina and compete for food, was low (Table 6).
Yearly distribution of other species identified in striped venus clam (Chamelea gallina) experimental survey, mean CPUA (kg km−2 ± SD)

Discussion
The Cide area undergoes intermittent hauling for SVE. The region has a habitat with a dense, soft substrate, a very suitable environment for C. gallina to thrive, and unsurprisingly, this area has an abundance of stocks of SVE. The Inebolu sub-area includes Doğanyurt and Çatalzeytin, where intensive SVE hauling is carried out. Due to the negative effects of the hydraulic dredge, in some regions, there are pressures by both fishermen and by residents to prohibit fishing (Dağtekin, Reference Dağtekin2016). Although this perception has good justifications, it is understood that it is not always true. In consequence, the centre of the İnebolu sub-area has been permanently closed to fishing. However, at times illegal fishing may occur. Therefore it is rash to presume that stocks are not exploited in the areas closed to fishing. A significant flood event in 2012 adversely affected the Türkeli and İnebolu sub-regions. The widespread die-off of C. gallina occurred in estuarine areas. It is therefore thought that this flood event was the most important factor in the stock decrease in these regions. Undoubtedly, it is known that such disasters do not happen every year. However, these disasters are repeated in certain years in these regions.
The Catch Per Unit Effort (CPUE) of C. gallina was calculated as 125.1 kg h−1 by Köseoğlu (Reference Köseoğlu2005) at depths of 3–10 m in the west Marmara Sea. This figure is relatively low when compared with the densities in the sub-regions of our study area. It seems that in a study conducted in Italy (Morello, Reference Morello2002), total biomass experienced very sharp declines over the years, where high stock biomass occurred in the years immediately after 1994, 1998 and 1999, when juveniles were present. This confirms that the abundance of stock is directly related to new stock recruitment. It is known that in animals feeding on planktonic organisms, natural mortality is high and the probability of survival is low at the larval stage (Rumrill, Reference Rumrill1990). As widely recognized, recruitment itself is a very complex and little-known process. Recruitment is related to climate and weather conditions, constant changes immediately after the breeding period in the hydrodynamics of the region, reproductive potential, suitability of substrate, natural predations on adult and juvenile individuals, and competition with other species in the food chain (Osman & Whitlatch, Reference Osman and Whitlatch1995; Eckman, Reference Eckman1996; Apte et al., Reference Apte, Dutta and Babu2010). To be able to assess this process successfully, it is necessary to understand and analyse all the elements in this complex system. Results obtained from many studies show that commercial fishing activity, as well as environmental factors, causes important changes in stocks. It is notable that the stock density of our study area, where fishing for C. gallina is regulated, was higher than for the Italian coasts, except for 1998 and 1999 (Morello, Reference Morello2002). Following a comparison of our results with studies in Italy, one of the most important countries for SVE fishing in addition to Turkey, it was found that the ratio of individuals of commercial size in both stocks was high. Although there was no clam fishing in the Turkish region during our research, it is apparent that stock abundance was high compared with the coasts of Italy. Nevertheless, SVE stock levels have decreased in some regions. Kosyan & Divinsky (Reference Kosyan and Divinsky2019) reported that the SVE population biomass for 2010 was nearly the same as the highest values observed for 50 years. The biomass of C. gallina was 12.23 g/0.50 m2 at 0.5 m depth, 54.025 g/0.50 m2 at 1 m and 181.335 g/0.50 m2 at 2 m in the study conducted at 0–2 m depths on the Adriatic coast (Vaccarella et al., Reference Vaccarella, Pastorelli, De Zio, Rositani and Paparella1996). In a study of C. gallina populations at a depth of 5.5–30 m in the north-west region of the Black Sea, the total biomass was estimated as 6948 g m−2 (Stadnichenko & Zolotarev, Reference Stadnichenko and Zolotarev2001). In a study by Morello et al. (Reference Morello, Froglia, Atkinson and Moore2005a) conducted in the Adriatic Sea, the biomass of C. gallina was found to be 1666.19 g m−2 at 3–6 m and 3962.22 g m−2 at 7–12 m (Morello et al., Reference Morello, Froglia, Atkinson and Moore2005a). These earlier estimated biomass values are quite low compared with our study. In a study carried out on the southern coasts of Portugal, biomass at a depth of 3–15 m was estimated at 35,403 g m−2 (Rufino et al., Reference Rufino, Gaspar, Pereira, Maynou and Monteiro2010). These estimated amounts are also quite low compared to our study.
In another study performed in the Marmara Sea, which has been closed to SVE fishing since 1998, seasonal changes in biomass were estimated to be 86,281, 55,070, 27,118 and 34,849 kg km−2, in spring, summer, autumn and winter, respectively. It was reported that no individuals were encountered for both the autumn and winter months in Şevketiye and Kemer sub-regions while the season with the greatest abundance was spring. Biomass was found to be relatively lower in the autumn and winter months. Finally, this study showed that biomass was densest at a depth of 5–10 m (Çolakoğlu, Reference Çolakoğlu2011). According to this study, the biomass (CPUA (kg km−2)) of SVE was higher in the Black Sea. Considering that bottom trawling and hydraulic dredge fishing are prohibited in the Marmara Sea, it was thought that the low CPUA in the Marmara Sea compared with the Black Sea was because the Black Sea is rich in primary production compared with many seas (Ağırbaş et al., Reference Ağırbaş, Feyzioğlu and Kopuz2014). Although individuals of legal size make up a larger proportion in the region, it is assumed that either natural mortality of C. gallina is high or recruitment is low. In a study of SVE from Italy between 2010 and 2012, abundance was estimated as 3.3–60.9 kg km−2 in the Trigno region, 1.6–22.2 kg km−2 in the Sinarca region, 6.9–58 kg km−2 in the Rio Vivo region and 0.1–32.6 kg km−2 in the Saccione region. Biomass of commercial-sized individuals in all regions were 1.5–25.8, 2.7–13.3, 4.0–39.6, 0.04–9.8 kg km−2, respectively. The density of C. gallina in our research area was quite high when comparing CPUA ranges. A study performed off the coasts of Bulgaria (Petrova & Stoykov, Reference Petrova and Stoykov2011), reported that C. gallina individuals were in the 18–22 mm length range, total biomass was found to be 563 tons and 70% (411 tons) of the stock were of commercial size. While stocks of SVE in Bulgaria are very low compared with our study area, the average size was higher. It is thought that more intensive fishing activity off the Turkish coast impacted average length size. In a study carried out off the Mediterranean coasts of Egypt, C. gallina stocks were investigated in an area of 180 km2. The biomass was estimated at three depth ranges (0–3, 3–6 and 6–9 m) as 668 ± 810, 571 ± 676 and 164 ± 454 kg km−2, respectively, with total stock biomass in the study area estimated at 136 tons (FAO EastMed, 2014). Compared with our findings, Egyptian biomass values were low. Many studies have reported that large waves and, in particular, winter storms damage the mussel stocks (Harger & Landenberger, Reference Harger and Landenberger1971; Paine & Levin, Reference Paine and Levin1981). For example, in a study performed on Mytilus californianus, environmental disasters had caused a collapse in mussel stocks of around 65% (O'Connor et al., Reference O'Connor, Crowe and McGrath2006). Similarly, events such as El Niño cause negative effects on bivalve species in various regions of the world. One example of the severe environmental effects on commercial fisheries concerns Mesodesma donacium off the coast of Peru. This species lived in the soft substrate of the coast of Peru and experienced a massive amount of natural mortality causing stocks to collapse. In response, catching this species was prohibited in Peru in 1999. However, despite these measures, stocks did not recover to their pre-die-off levels. Natural disasters also cause harmful algae blooms and super-blooms, rising water temperature, and increased parasite populations. Environmental factors are widely known to have a great influence on benthic organisms (Defeo & Castilla, Reference Defeo and Castilla2012).
Chamelea gallina feeds on phytoplankton and other suspended solids (Scopa et al., Reference Scopa, Recchi and Nadia Beatrice Barile2014). Its growth is related to the phosphorus to nitrogen ratio. When the seawater temperature is below 10°C, the growth rate of C. gallina decreases or ceases completely (Froglia, Reference Froglia2000). In addition to biotic and abiotic factors, stock density affects the development of C. gallina. If stock levels are above the carrying capacity or there is an increase in competing species, there can be a reduction in nutrient availability for all individuals in a population (Scopa et al., Reference Scopa, Recchi and Nadia Beatrice Barile2014). Among the abiotic factors affecting mussel species, dissolved oxygen is one of the most important parameters. In summer, when water temperatures increase, the corresponding decrease in oxygen concentration causes an increase in ammonium levels which may reduce growth. In a previous study (Brooks et al., Reference Brooks, De Zwaan, Van Den Thıllart, Cattanı, Cortesı and Storey1991) where tolerance to varying oxygen levels, similar to those in the Black Sea habitat, of two bivalve species C. gallina and Anadara kagoshimensis were measured, the tolerance of C. gallina was reported to be relatively low. This suggests that natural mortality in C. gallina could be high in response to changes in abiotic factors. Shell deformation in C. gallina individuals under the minimum size, that are returned during hydraulic dredging may occur due to the effects of both water pressure and the size-based sieve system. In stressed individuals, a range of problems have been reported (Moschino et al., Reference Moschino, Deppieri and Marin2003). Although there had been no SVE fishing in the research area for two years, it is thought that such activities will have caused negative impacts on stocks. The average biomass of whiting, one of the predators of C. gallina along the Black Sea coast of Turkey, was estimated in 2012 to be 64.73 ± 66.60 kg km−2. Whiting biomass in 2012 in the Western Black Sea region (Zengin et al., Reference Zengin, Karakulak, Yıldız, Uzer, Akpınar and Gümüş2020), where our study was conducted, was relatively higher than the mean at 67.35 ± 62.87 kg km−2 but estimated as 62.91 ± 69.55 kg km−2 in the Eastern Black Sea (Dağtekin et al., Reference Dağtekin, Genç, Mısır, Erik, Ok and Altuntaş2020). The biomass of R. venosa, a voracious predator in the benthic habitat, was found to be 10.1 tons km−2 (Sampson et al., Reference Sampson, Ak, Cardinale, Chashchyn and Damalas2014). Chamelea gallina is reported to be one of the prey species of R. venosa (Savini & Occhipinti-Ambrogi, Reference Savini and Occhipinti-Ambrogi2006; Kosyan, Reference Kosyan2016). Predator pressure on C. gallina will increase, especially if species such as Mytilus galloprovincialis, which constitute the most important prey of R. venosa, decrease in the habitat.
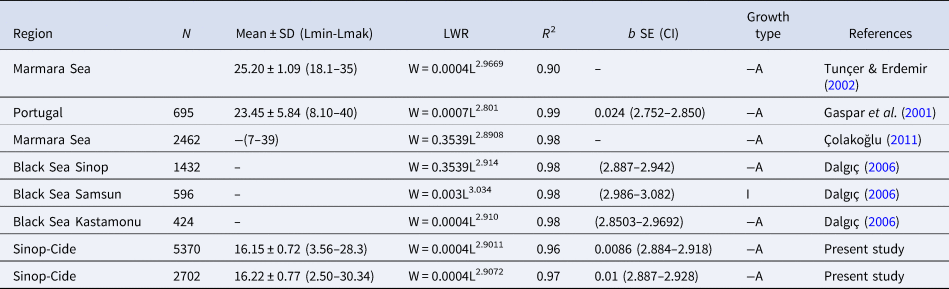
In the present study (2011–2012) a negative allometric relationship was found between the length-weight parameters of C. gallina. In previous studies of C. gallina from different regions of the Black Sea, growth was reported to be negative allometric (Dalgıç, Reference Dalgıç2006; Gözler et al., Reference Gözler, Şahin, Dalgıç and Engin2006). The results reported by various researchers from different regions (Gaspar et al., Reference Gaspar, Santos and Vasconcelos2001; Tunçer & Erdemir, Reference Tunçer and Erdemir2002; Dalgıç, Reference Dalgıç2006; Çolakoğlu, Reference Çolakoğlu2011) are also consistent with our findings. However, in contrast to most other research, Dalgıç (Reference Dalgıç2006) reported an isometric distribution for samples from Samsun on the Turkish Black Sea coast, whereas most other sources report negative allometry for the length-weight relationship (Table 7).
Length-weight relationship of striped venus clam (Chamelea gallina) reported by various researchers

SD, Standard deviation; SE, Standard error; −A, Negative allometric; I, Isometric; CI, Confidence interval.
Sparre & Venema (Reference Sparre and Venema1992) reported that growth parameters varied between species and within stocks within the same species, owing to various environmental conditions. In this study, L ∞ (33.78 mm SL) differed from that of previous studies (Table 8). The highest reported L ∞ (52.2 mm) was observed in the Middle Adriatic Italy (Polenta, Reference Polenta1993), whereas the lowest reported L ∞ (15.78 mm) was obtained from the Eastern Black Sea, Turkey (Gözler et al., Reference Gözler, Şahin, Dalgıç and Engin2006). In this study, C. gallina exhibited a slower growth rate (K = 0.276 year−1) compared with K = 0.79 year−1 from South Adriatic Italy (Vaccarella et al., Reference Vaccarella, Pastorelli, De Zio, Rositani and Paparella1996). Growth performance index according to our study findings, Costa et al. (Reference Costa, Bınachını, Ceccarellı, Orecchıa, Rambaldı and Volterra1987), Ramón & Richardson (Reference Ramón and Rıchardson1992), Arneri et al. (Reference Arneri, Giannetti, Polenta and Antolini1995), Vaccarella et al. (Reference Vaccarella, Pastorelli, De Zio, Rositani and Paparella1996), Polenta (Reference Polenta1993), Gaspar et al. (Reference Gaspar, Pereıra, Vasconcelos and Monteıro2004), FAO EastMed (2014), Boltacheva & Mazlumyan (Reference Boltacheva and Mazlumyan2003), Deval (Reference Deval1995), Deval & Oray (Reference Deval and Oray1998), Çolakoğlu, (Reference Çolakoğlu2011). It is higher than the results of the studies conducted by Dalgıç (Reference Dalgıç2006) and Gözler et al. (Reference Gözler, Şahin, Dalgıç and Engin2006) in the Black Sea (Table 8). However, there were no statistically significant differences in these investigations (P > 0.05).
Von Bertalanffy growth parameters of striped venus clam (Chamelea gallina) in different areas

The average natural mortality rate found by Çolakoğlu & Tokaç (Reference Çolakoğlu and Tokaç2010) was 0.65 years−1, and Deval's (Reference Deval2009) was 0.6031 year−1in a study of the North Marmara. In this study it was found to be M: 0.57 year−1. This shows that natural mortality rates at seas close to the regions where the present study was conducted were close to each other.
Conclusion
Chamelea gallina is one of the most important species in the benthic marine biocenosis of the Black Sea. Thus, the significance of this species in fisheries management must be considered. In this study, the total stock biomasses of C. gallina were estimated as 61,619.23 and 62,255.07 tons in 2011 and 2012, respectively. In 2012, stock levels decreased in the area of Ayancık, probably due to unusual environmental factors which are known to have a major impact on C. gallina. For this reason, we suggest that the present system of management of the fisheries, using a fallow period, should be reviewed. It appears that the 2-year closure period may not be sufficient for population recovery in some regions. The landings of SVE were 24,500 tons before the closure to fishing (TURKSTAT, 2022). If the regions are to be re-opened to fishing after the 2-year closed period, it will be useful to carry out stock assessments in the summer season to make more informed decisions. Considering the stock studies and the structure of the stocks, it will be beneficial to establish a quota system within the framework of these guidelines. It has been shown that large-sized individuals (25–30 mm) do not show even distribution within the population and that the proportion of individuals older than 4 years in the population was low. Fisheries will probably have an impact on this situation. The main causes of natural mortality, other than anthropogenic factors in clams, are related to phytoplankton explosions and anoxic layer changes in summer (Morello et al., Reference Morello, Froglia, Atkinson and Moore2005a, Reference Morello, Froglia, Atkinson and Moore2005b). Thus, opening and closing the region to fishing activity for specified periods may not be an effective strategy for the full recovery of stocks. During the planning of fisheries management regulations for SVE fishing, these factors should be considered. It is accepted that datasets based on long-term studies are needed to make evaluations in fisheries. Turkey plays an important role in terms of commercial fishing for the management of the Black Sea SVE stocks. Continuous population monitoring studies would be extremely useful as stocks of R. venosa, the main predator of C. gallina (Saglam & Duzguneş, Reference Saglam and Duzgunes2014; Kosyan, Reference Kosyan2016), have increased three-fold in one year (Table 6). Increased commercial fishing for R. venosa in the affected regions will reduce predator pressure. Finally, it should be highlighted that commercial fishing should use methods that do no harm, or cause the minimum possible damage, to the benthic habitat (Morello et al., Reference Morello, Froglia, Atkinson and Moore2005a, Reference Morello, Froglia, Atkinson and Moore2005b; Reine et al., Reference Reine, Clarke and Dickerson2014).
Acknowledgements
The authors are thankful to project ‘TAGEM/HAYSÜD/2011/09/02/05’ ‘A Prelimınary Study on Estimation Abundance of the Striped Venus (Chamelea gallina (Lınnaeus, 1758) in the Western Black Sea’. Sincere thanks are also due to the editor and anonymous referees whose suggestions greatly improved the manuscript. Also, we would like to thank Kocaeli University Academic Writing Unit and Assoc. Dr Arzu Morkoyunlu Yüce for their contribution to the English editing.
Author contributions
M.D. contributed to the manuscript conceptualization, methodology, data collection, and writing – original draft. G.D. contributed to the task of data collection and editing, M.E., S.Ö., M.A. and İ.Ö.A. contributed to data collection. S.K. was editing. C.E.Ö. was writing – review and editing.
Financial support
This study was supported by Republic of Turkey, Ministry of Agriculture and Forest, General Directorate of Agricultural Research and Policies [grant number: TAGEM/HAYSÜD/2011/09/02/05].
Conflict of interest
There are no known competing financial or non-financial, professional or personal conflicts that the authors can identify that would have appeared to have an impact on the work described in this publication.
Ethical standards
No situation required an ethics committee certificate for the study.