Introduction
Attempts to predict and mitigate the impacts of global climate change on the distribution of pathogens and the phenology of disease risk have accelerated efforts to resolve the geography of parasite diversity, identify hot spots of disease emergence and elucidate temporal patterns in disease dynamics (Jones et al., Reference Jones, Patel, Levy, Storeygard, Balk, Gittleman and Daszak2008; Estrada-Peña et al., Reference Estrada-Peña, Ostfeld, Peterson, Poulin and de la Fuente2014; Stephens et al., Reference Stephens, Altizer, Smith, Aguirre, Brown, Budischak, Byers, Dallas, Davies, Drake, Ezenwa, Farrell, Gittleman, Han, Huang, Hutchinson, Johnson, Nunn, Onstad, Park, Vazquez-Prokopec, Schmidt and Poulin2016). Tackling these issues requires large-scale datasets that cannot easily be assembled de novo, but that are instead compiled from existing sources. As a rule, comprehensive datasets used to address global-scale questions in parasite ecology or biogeography are assembled from information published in the scientific literature (see Morand and Krasnov, Reference Morand and Krasnov2010). However, the internet may provide a vast, yet mostly untapped alternative source of data (Jarić et al., Reference Jarić, Correia, Brook, Buettel, Courchamp, Di Minin, Firth, Gaston, Jepson, Kalinkat, Ladle, Soriano-Redondo, Souza and Roll2020; Poulin et al., Reference Poulin, Bennett, Filion, Bhattarai, Chai, de Angeli Dutra, Donlon, Doherty, Jorge, Milotic, Park, Sabadel and Thomas2021). Each query made through an internet search engine like Google, and each image uploaded to the internet, represents a record of a real-world observation. Many parasites, or their impacts on hosts, are easily noticeable by lay people; they arouse disgust and/or curiosity, causing people to share images online or search the internet for information. With metadata on the time and location associated with each query or image, one can assemble a dataset that can be explored for spatial or temporal patterns.
The human population represents a massive work force with huge data gathering potential. When harnessed, citizen science can provide useful and novel information. For instance, data from the public at large collected following a request from scientists proved more valuable to detect invasive mosquitoes than data from scientific monitoring programmes alone (Pernat et al., Reference Pernat, Kampen, Jeschke and Werner2021). However, data already stored on the internet and not solicited by scientists for a specific purpose also hold huge potential. Recently, the use of internet data for parasitological research, or iParasitology (Poulin et al., Reference Poulin, Bennett, Filion, Bhattarai, Chai, de Angeli Dutra, Donlon, Doherty, Jorge, Milotic, Park, Sabadel and Thomas2021), has emerged as an alternative to traditional research based on primary data acquired by scientists. Because internet data based on search activity and image uploads are akin to undirected citizen science, or passive crowdsourcing, it must be validated against rigorous scientific data to confirm whether it captures real-world patterns without biases. Only very few studies have attempted to ground-truth internet data with scientific data in the context of research on parasites or diseases. For example, Twitter activity relating to diseases such as malaria and tuberculosis can produce maps that reflect quite accurately the geographic distributions of these diseases (Bornmann et al., Reference Bornmann, Haunschild and Patel2020). Similarly, analyses of photographs uploaded to the internet by scuba divers have not only confirmed the known geographical range of a trematode that induces black spots on the skin of Caribbean reef fishes, but also allowed its occurrence to be extended to areas not previously recorded in the scientific literature (Elmer et al., Reference Elmer, Kohl, Johnson and Peachey2019). In these examples, one could obtain reliable information from internet data on the spatial distribution of parasites, vectors or diseases without consulting the scientific literature.
In the current study, we go beyond the use of internet data to establish geographical distributions and examine whether these data can be used to explore other aspects of host–parasite interactions. We test whether patterns in the spatial observations, temporal records and host use of hairworms (phylum Nematomorpha) reported through internet searches and uploaded images are congruent with, or alternatively whether they complement, those documented by empirical scientific research. Hairworms are exactly the kind of parasites likely to be noticed by non-scientists and to arouse their curiosity. Typically, these parasites develop within terrestrial arthropods over several months, reaching relatively large sizes (often >10 cm) before emerging from the host (Schmidt-Rhaesa, Reference Schmidt-Rhaesa and Schmidt-Rhaesa2013; Bolek et al., Reference Bolek, Schmidt-Rhaesa, de Villalobos, Hanelt, Thorp and Rogers2015). Outside the host, hairworms are prone to desiccation and must therefore emerge from their host into water. They have evolved the ability to alter host behaviour in the late stages of infection, causing their hosts to enter water and allow the parasite to exit there (Thomas et al., Reference Thomas, Schmidt-Rhaesa, Martin, Manu, Durand and Renaud2002). Often, the host dies right after the parasite exits its body, although host survival is possible. As free-living, non-feeding adults, male and female worms find each other to mate, often forming large aggregations of many individuals, commonly referred to as Gordian knots. Death follows shortly after reproduction. There are several hundred known species of hairworms, occurring across the world except for Antarctica (Schmidt-Rhaesa, Reference Schmidt-Rhaesa and Schmidt-Rhaesa2013). A worm emerging from its host, a single worm wriggling in shallow water, or a mass of worms entangled during reproduction, are all easily visible to anyone, scientist or not. They are easily photographed, and many people intrigued by their sight are likely to upload photos or query the internet to learn about them.
The main goal of this study is to determine whether, for parasites likely to be noticed by the public at large, internet data can provide a useful alternative or complementary source of data for scientific studies. Our specific objectives are to: (1) test whether the geographical distribution of hairworms based on scientific records matches that based on data from internet searches or uploaded photos; (2) determine whether the number of internet searches per month relating to hairworms reflect their seasonal occurrence as documented by scientific studies and (3) compare the host taxa of hairworms identified by scientific studies with those seen in photos taken by the public and uploaded to the internet. Our analyses take into account demographic variables, i.e. human population size and number of tertiary education institutions per geographic area, which can affect the number of sightings made by the public, the intensity of scientific research or both. In addition, we limit our analyses to North America (Canada and the United States, including Hawaii); although English is not the only language currently used in North America, its usage is widespread enough that most internet searches conducted with the Google search engine are in English. Furthermore, socioeconomic conditions, use of smart phones and access to the internet are probably more homogeneous across North America than on most other continents. Therefore, hairworms and North America provide a great model system in which to evaluate the usefulness of internet data generated by the public for research on host–parasite interactions.
Materials and methods
Data from the scientific literature
Scientific records of hairworms in the literature were compiled from the Web of Science ‘All Databases’ database up to the end of 2020, using the following search string for article titles: (nematomorph* OR ‘horsehair worm*’ OR hairworm* OR ‘hair worm*’ OR gordiid* OR gordiac* OR gordioi* OR gordius). This search string yielded the highest number of relevant articles among several combinations tested. From the total hits obtained, the articles included in this study were then identified based on their title or abstract. To expand the spatial and temporal coverage of the dataset, we translated articles in languages other than English when possible. Data were extracted from a total of 277 articles published worldwide between 1927 and 2020 inclusively. Although this list was not exhaustive, we considered that it was representative of the general scientific research activity relevant to this study. From these articles, we recorded the location where hairworms of any life stage (egg, larva, cyst, juvenile or adult) were observed as part of that study, and in what year this occurred. If no year was mentioned, the publication year of the article was noted instead. We also recorded the taxonomic group of the host when possible, e.g. identification of the definitive host was confirmed if the author(s) observed an adult hairworm emerging from it. When focusing on Canada and the United States of America (denoted as North America hereafter), a total of 353 hairworm locations and 54 definitive host records were collated from 76 articles. The spatial data were converted into the number of records per state, province or territory (referred to here as geographical divisions). These data were then used for statistical comparisons with the crowdsourced data gathered from North America.
Internet search data
To determine the most popular search terms for hairworms used by the general population, we tested several comprising one to three words directly in Google Trends and selected those that yielded the highest number of hits over time. Search terms of four words or more, e.g. a short sentence such as ‘worm coming out of bug’, yielded little to no results, thus limiting the size of search terms. Assuming that non-specialists use common names more often in their search queries, we prioritized the use of common names. Based on our preliminary results, the following six search terms were selected: ‘horsehair worm’, ‘horse hair worm’, ‘hairworm’, ‘hair worm’, ‘gordian worm’ and ‘gordius’. Then, internet search trends for North America were downloaded from Google Trends using the package ‘gtrendsR’ in R version 4.0.4 (Massicotte and Eddelbuettel, Reference Massicotte and Eddelbuettel2021; R Core Team, 2021). This package extracts information such as the location and date of each search query since the beginning of Google Trends in 2004. Then, the search metadata from 2004 to 2020 inclusively for all six search terms were pooled together both spatially to obtain the total number of hits per geographical division across North America (all years combined), and temporally to obtain the average number of hits per month (all years and all geographical divisions combined).
Internet photo data
The image data related to hairworms and their respective hosts in North America were downloaded from the iNaturalist (www.inaturalist.org) citizen science platform until the end of 2020. Although only a subset of images taken by the public are available through iNaturalist, they were all uploaded voluntarily and not to test any particular scientific hypothesis. The search was conducted under the category ‘Horsehair Worms (Phylum Nematomorpha)’ and all resulting search records were exported using the feature ‘Export Observations’. We inspected each image individually and any duplicates or incorrect observations were excluded (most incorrect identifications are clearly mermithid nematodes). If an image captured an adult hairworm emerging from its definitive host, the latter was identified to the lowest taxonomic level possible. We also noted the date when the image was taken (as entered by the user) and the geographic location where the hairworm was photographed (also as entered by the user). As for the internet search data, the image metadata were pooled together both spatially to obtain the total number of image uploads per geographical division across North America (all years combined), and temporally to obtain the average number of images uploaded per month (all years and all geographical divisions combined).
Confounding demographic variables
Population census data were extracted for each geographical division using the R packages ‘cancensus’ version 0.4.2 (von Bergman et al., Reference von Bergmann, Shkolnik and Jacobs2021) and ‘usa’ version 0.1.0 (Kiernan, Reference Kiernan2020) for Canada and the United States of America, respectively. We also gathered the total number of tertiary education establishments (colleges and universities) from each geographical division from The Greenest Workforce (https://thegreenestworkforce.ca/index.php/en/schools/) for Canada and Statista (https://www.statista.com/statistics/306880/us-higher-education-institutions-by-state/) for the United States of America.
Statistical analyses
All statistical analyses were performed in R version 4.0.4 (R Core Team, 2021). First, we tested whether spatial data from crowdsourcing activities could be used to predict the spatial data collated from the scientific literature in North America. We used two Bayesian multilevel models, one for each crowdsourced dataset (internet search data and internet photo data), with the ‘brms’ package (Bürkner, Reference Bürkner2017). The response variable in both models was the total number of hairworm records per geographical division according to the scientific literature; therefore, a negative binomial distribution was implemented into the models to account for overdispersion of the data. Geographical divisions with no record were included in the analysis, and given a value of zero record. The main predictor in the first model was the total number of search hits per geographical division from internet search data (Google Trends), whereas in the second model it was the total number of image uploads per geographical division from internet photo data (iNaturalist). Since these data may be dependent upon population size or the total number of tertiary education establishments, we initially included these additional variables as predictors in both models. However, since population size and the total number of tertiary education establishments per geographical division were highly correlated with each other (R 2 = 0.884), we decided to keep only the total number of tertiary education establishments as a correcting factor in both models to avoid collinearity problems (Dormann et al., Reference Dormann, Elith, Bacher, Buchmann, Carl, Carre, Garcia Marquez, Gruber, Lafourcade, Leitao, Muenkemueller, McClean, Osborne, Reineking, Schroeder, Skidmore, Zurell and Lautenbach2013).
Additionally, we tested whether the average number of monthly search hits in Google correlated with the average number of image uploads in iNaturalist. For this, we calculated a Spearman's rank correlation coefficient. Finally, we assessed whether any relationship existed between the host records from the scientific literature and the internet photo data. For this, we performed a chi-squared test of independence for host class between both sources of data. Since insects accounted for over 90% of host records, we also performed a chi-squared test of independence for the different orders of insects identified from both sources of data.
Results
General results
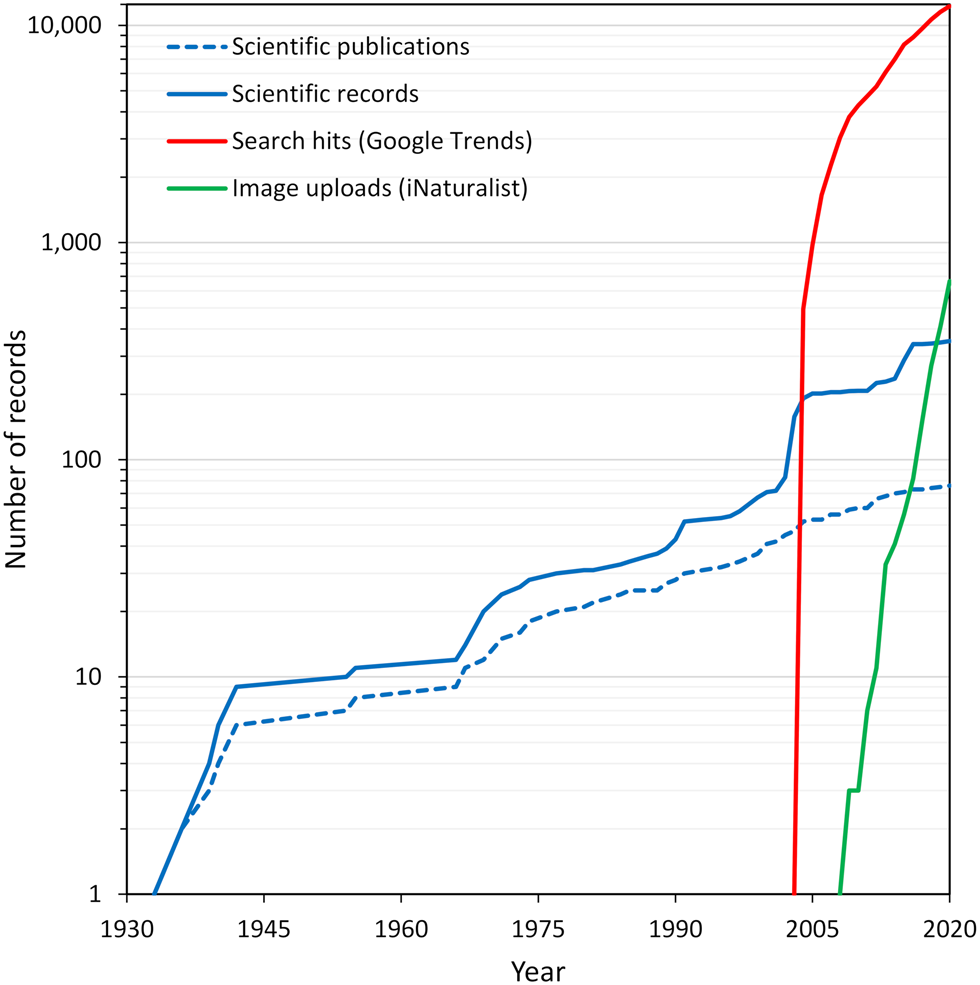
Table 1 provides a summary of the number of hairworm records from the scientific literature and the crowdsourcing activities that produced the spatial, temporal or host data. The accumulation of records over time for all these sources of data is shown in Fig. 1. The figure shows that the number of internet search hits surpassed the number of scientific records by an order of magnitude approximately 2 years after Google Trends first came online. The number of images uploaded to iNaturalist also surpassed the scientific records within the past 5 years. The full dataset used in our analyses is available in Table S1 in the Supplementary material.
Cumulative number of records as a function of time for hairworms (phylum Nematomorpha) in Canada and the United States of America, including scientific and crowdsourced data.

Numbers of records used to compare spatial occurrence, temporal trends and definitive host use of hairworms (phylum Nematomorpha) between different sources of data for Canada and the United States of America

A dash indicates that the particular source of data was not used for that test.
Spatial occurrence of hairworms
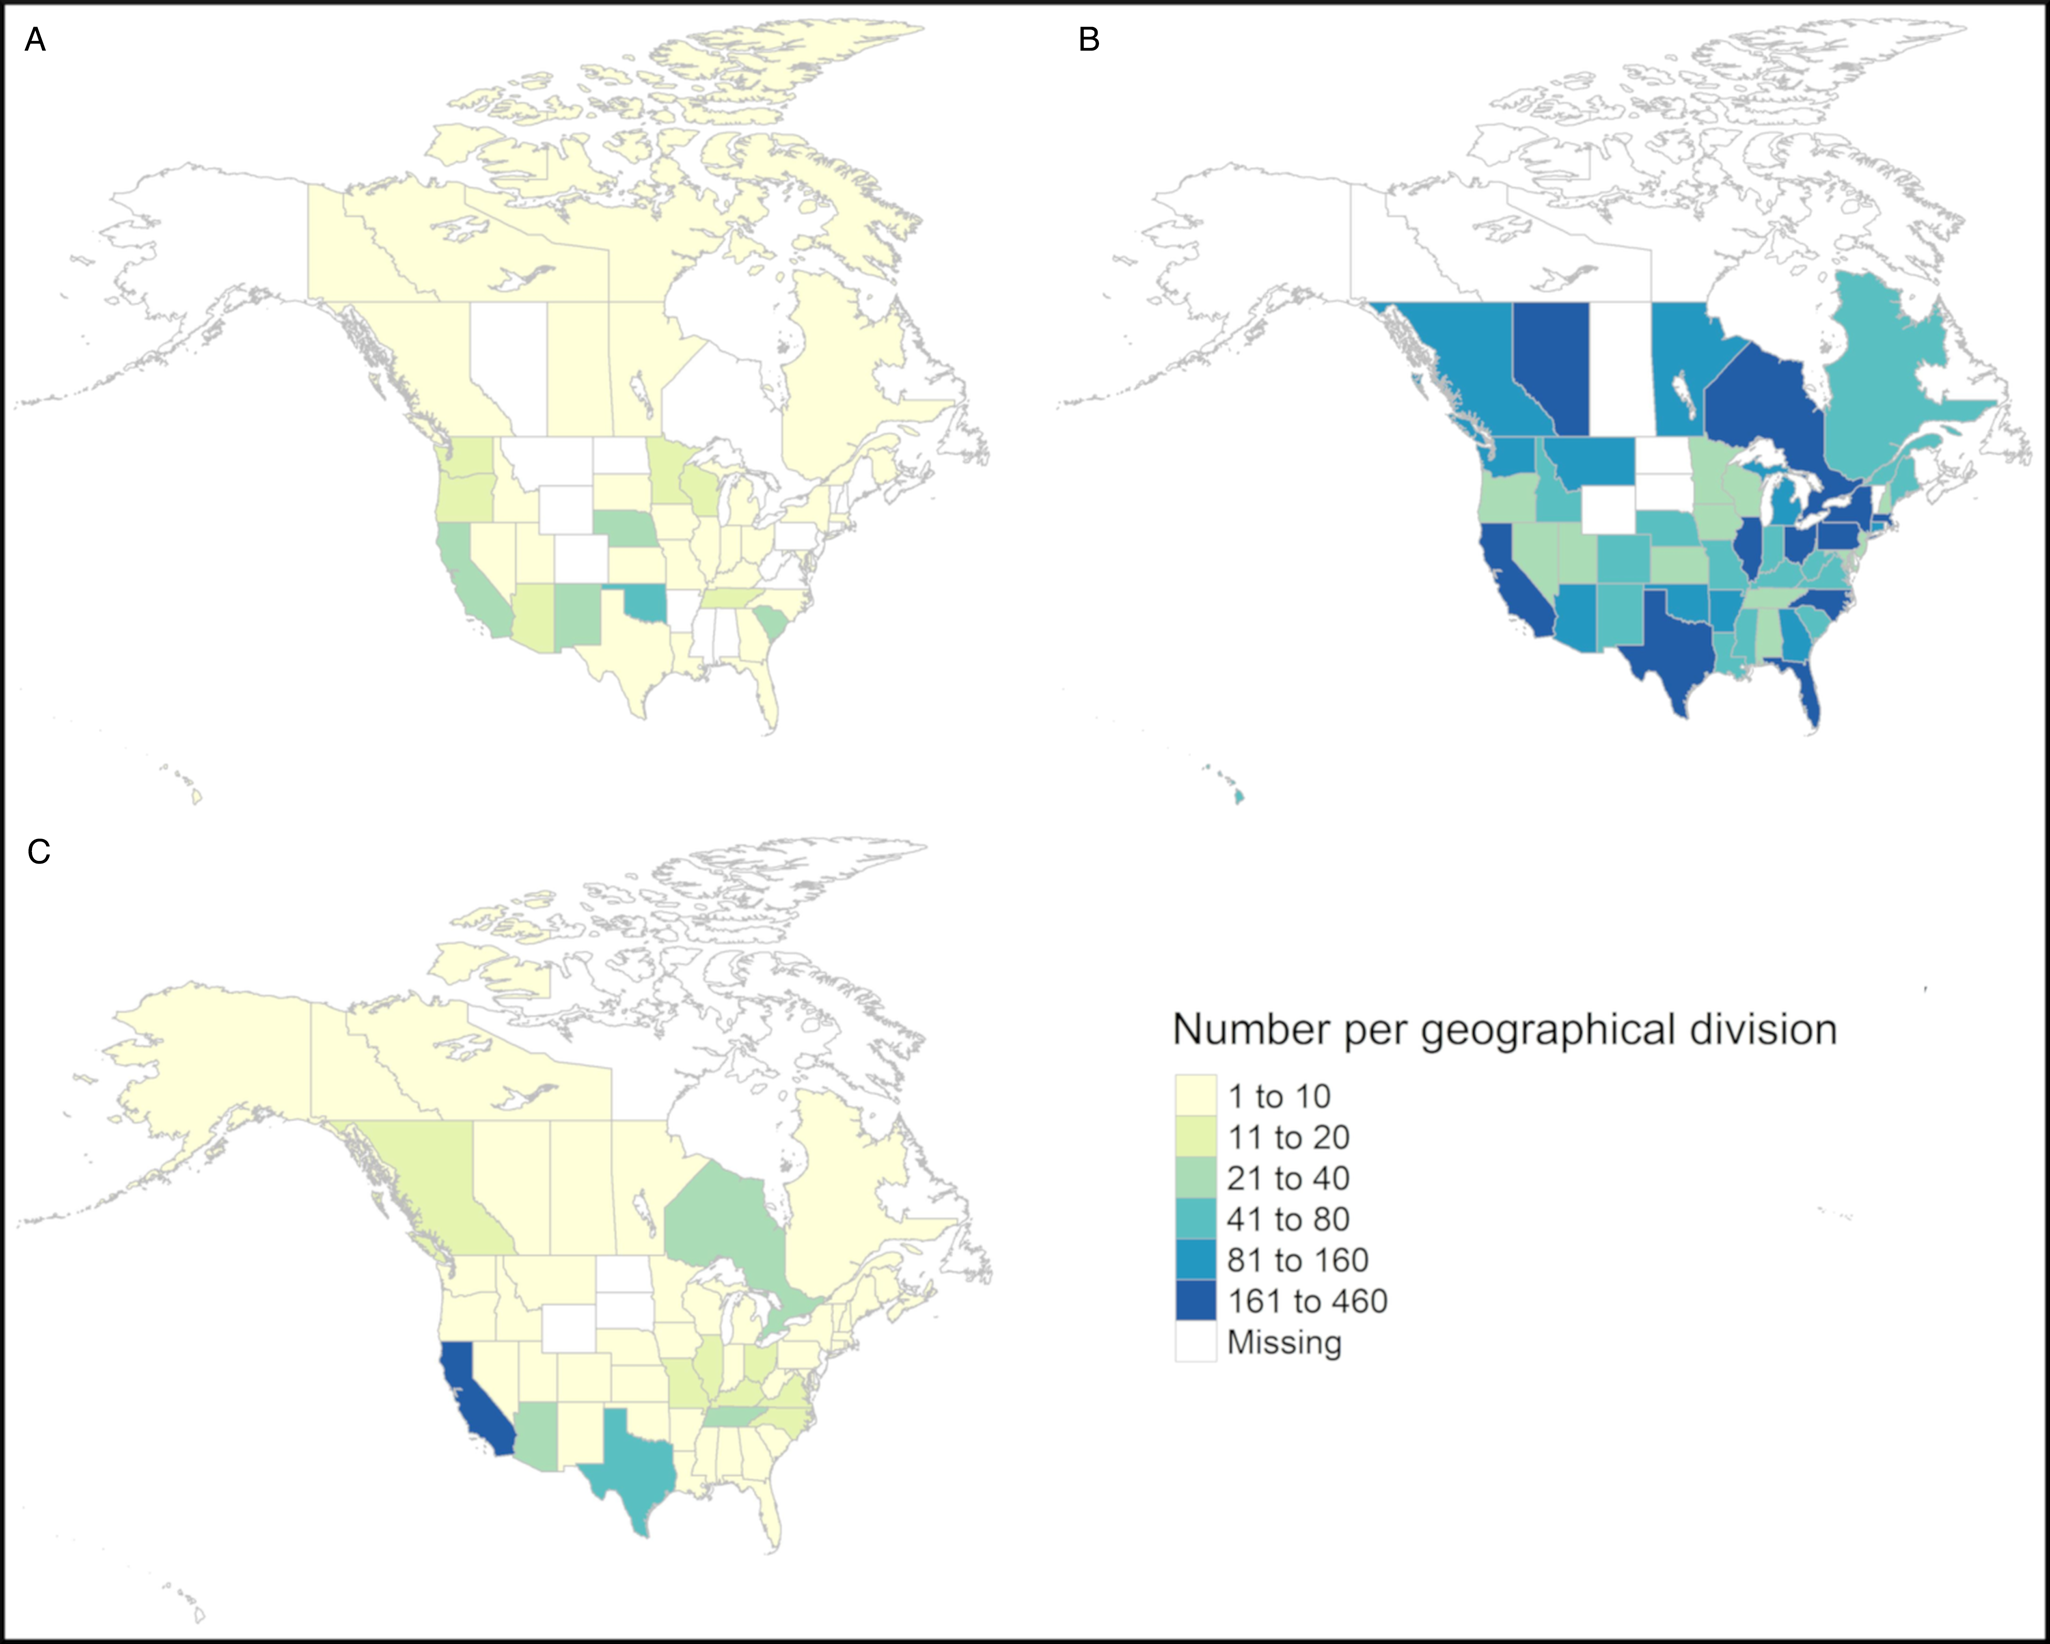
We mapped the spatial distribution of hairworms in North America according to the scientific literature, internet searches and images uploaded to the internet (Fig. 2; see Fig. S1 in the Supplementary material for an interactive version). Out of the 64 geographical divisions identified (50 states, one federal district, 10 provinces, and three territories), 40 had at least one scientific record. According to the scientific literature, the top hairworm hot spots are located in Oklahoma, New Mexico and Nebraska (Fig. 2A). Internet searches were available for 49 geographical divisions and their distribution visibly contrasted with what was reported in the scientific literature (Fig. 2B). For example, Alberta, New York and Ontario had little to no scientific records of hairworms, whereas in terms of internet searches they were among the top locations across North America. The hot spots identified from the scientific literature no longer stood out in terms of internet searches. Images uploaded to iNaturalist covered the most geographical divisions at 54 (Fig. 2C). California held the top position in terms of images uploaded, as it did for internet searches. In all three sources of data, no records existed for Delaware, Newfoundland and Labrador, North Dakota, Prince Edward Island and Wyoming. According to Bayesian multilevel modelling, both internet search data (posterior estimate = 0.000, 95% credible interval = −0.010 to 0.010) and internet photo data (posterior estimate = 0.010, 95% credible interval = −0.020 to 0.060) were poor predictors of the number of hairworm records found in the scientific literature across geographical divisions. In both models, the number of tertiary education establishments also had no effect (credible intervals overlapping zero). Overall, the two models had low predictive power. Nevertheless, the hairworm distributions they predicted included different hot spots than those emerging from the scientific records, such as California, Texas and New York, and even areas like Ontario which had no record in our data from the scientific literature (see Fig. S2B for predictions from the internet search data model, and Fig. S2C for predictions from the internet photo data, in the Supplementary material).
Spatial distribution of hairworm records (phylum Nematomorpha) per geographical division (state, province or territory) across Canada and the United States of America. (A) Total number of records in the scientific literature; (B) total number of internet searches in Google Trends and (C) total number of images uploaded to iNaturalist.

Temporal trends in hairworm records
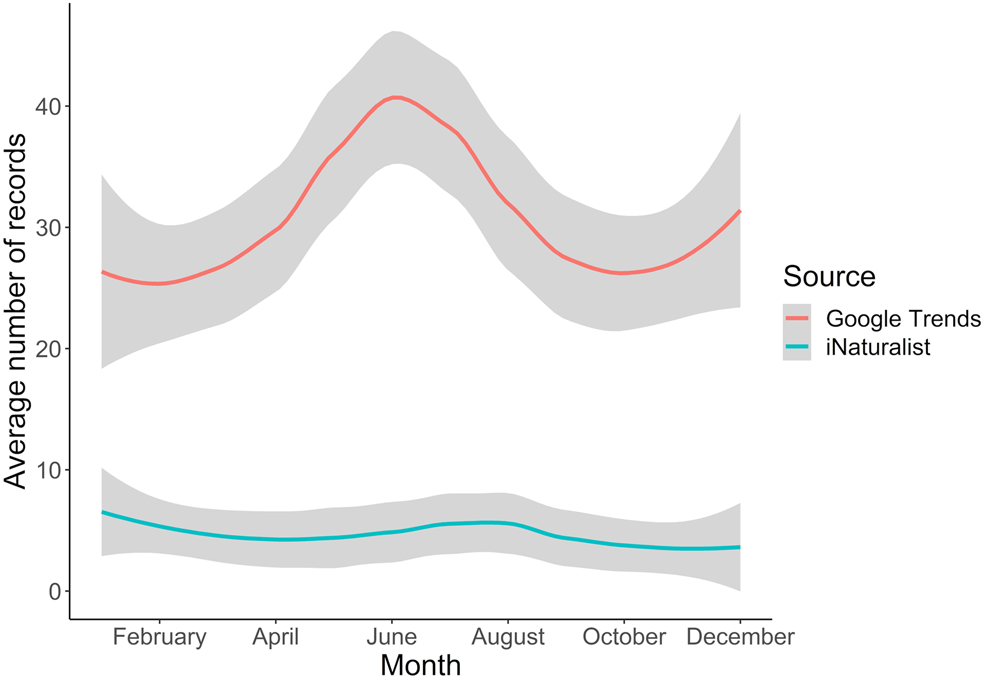
The monthly averages of internet searches and image uploads in North America are presented in Fig. 3. Although internet searches show a clear peak during the summer months of June–July with fewer monthly searches during the rest of the year, images uploaded to iNaturalist do not show any obvious seasonal trend. A Spearman's rank correlation coefficient of −0.077 supports that there is a clear difference in the monthly averages between both sources of data (P value = 0.812).
Temporal trends in records of hairworms (phylum Nematomorpha) per month in Canada and the United States of America, shown here as the average monthly number of internet searches in Google Trends and the average monthly number of images uploaded to iNaturalist (with 95% confidence intervals; shaded areas).

Host use by hairworms
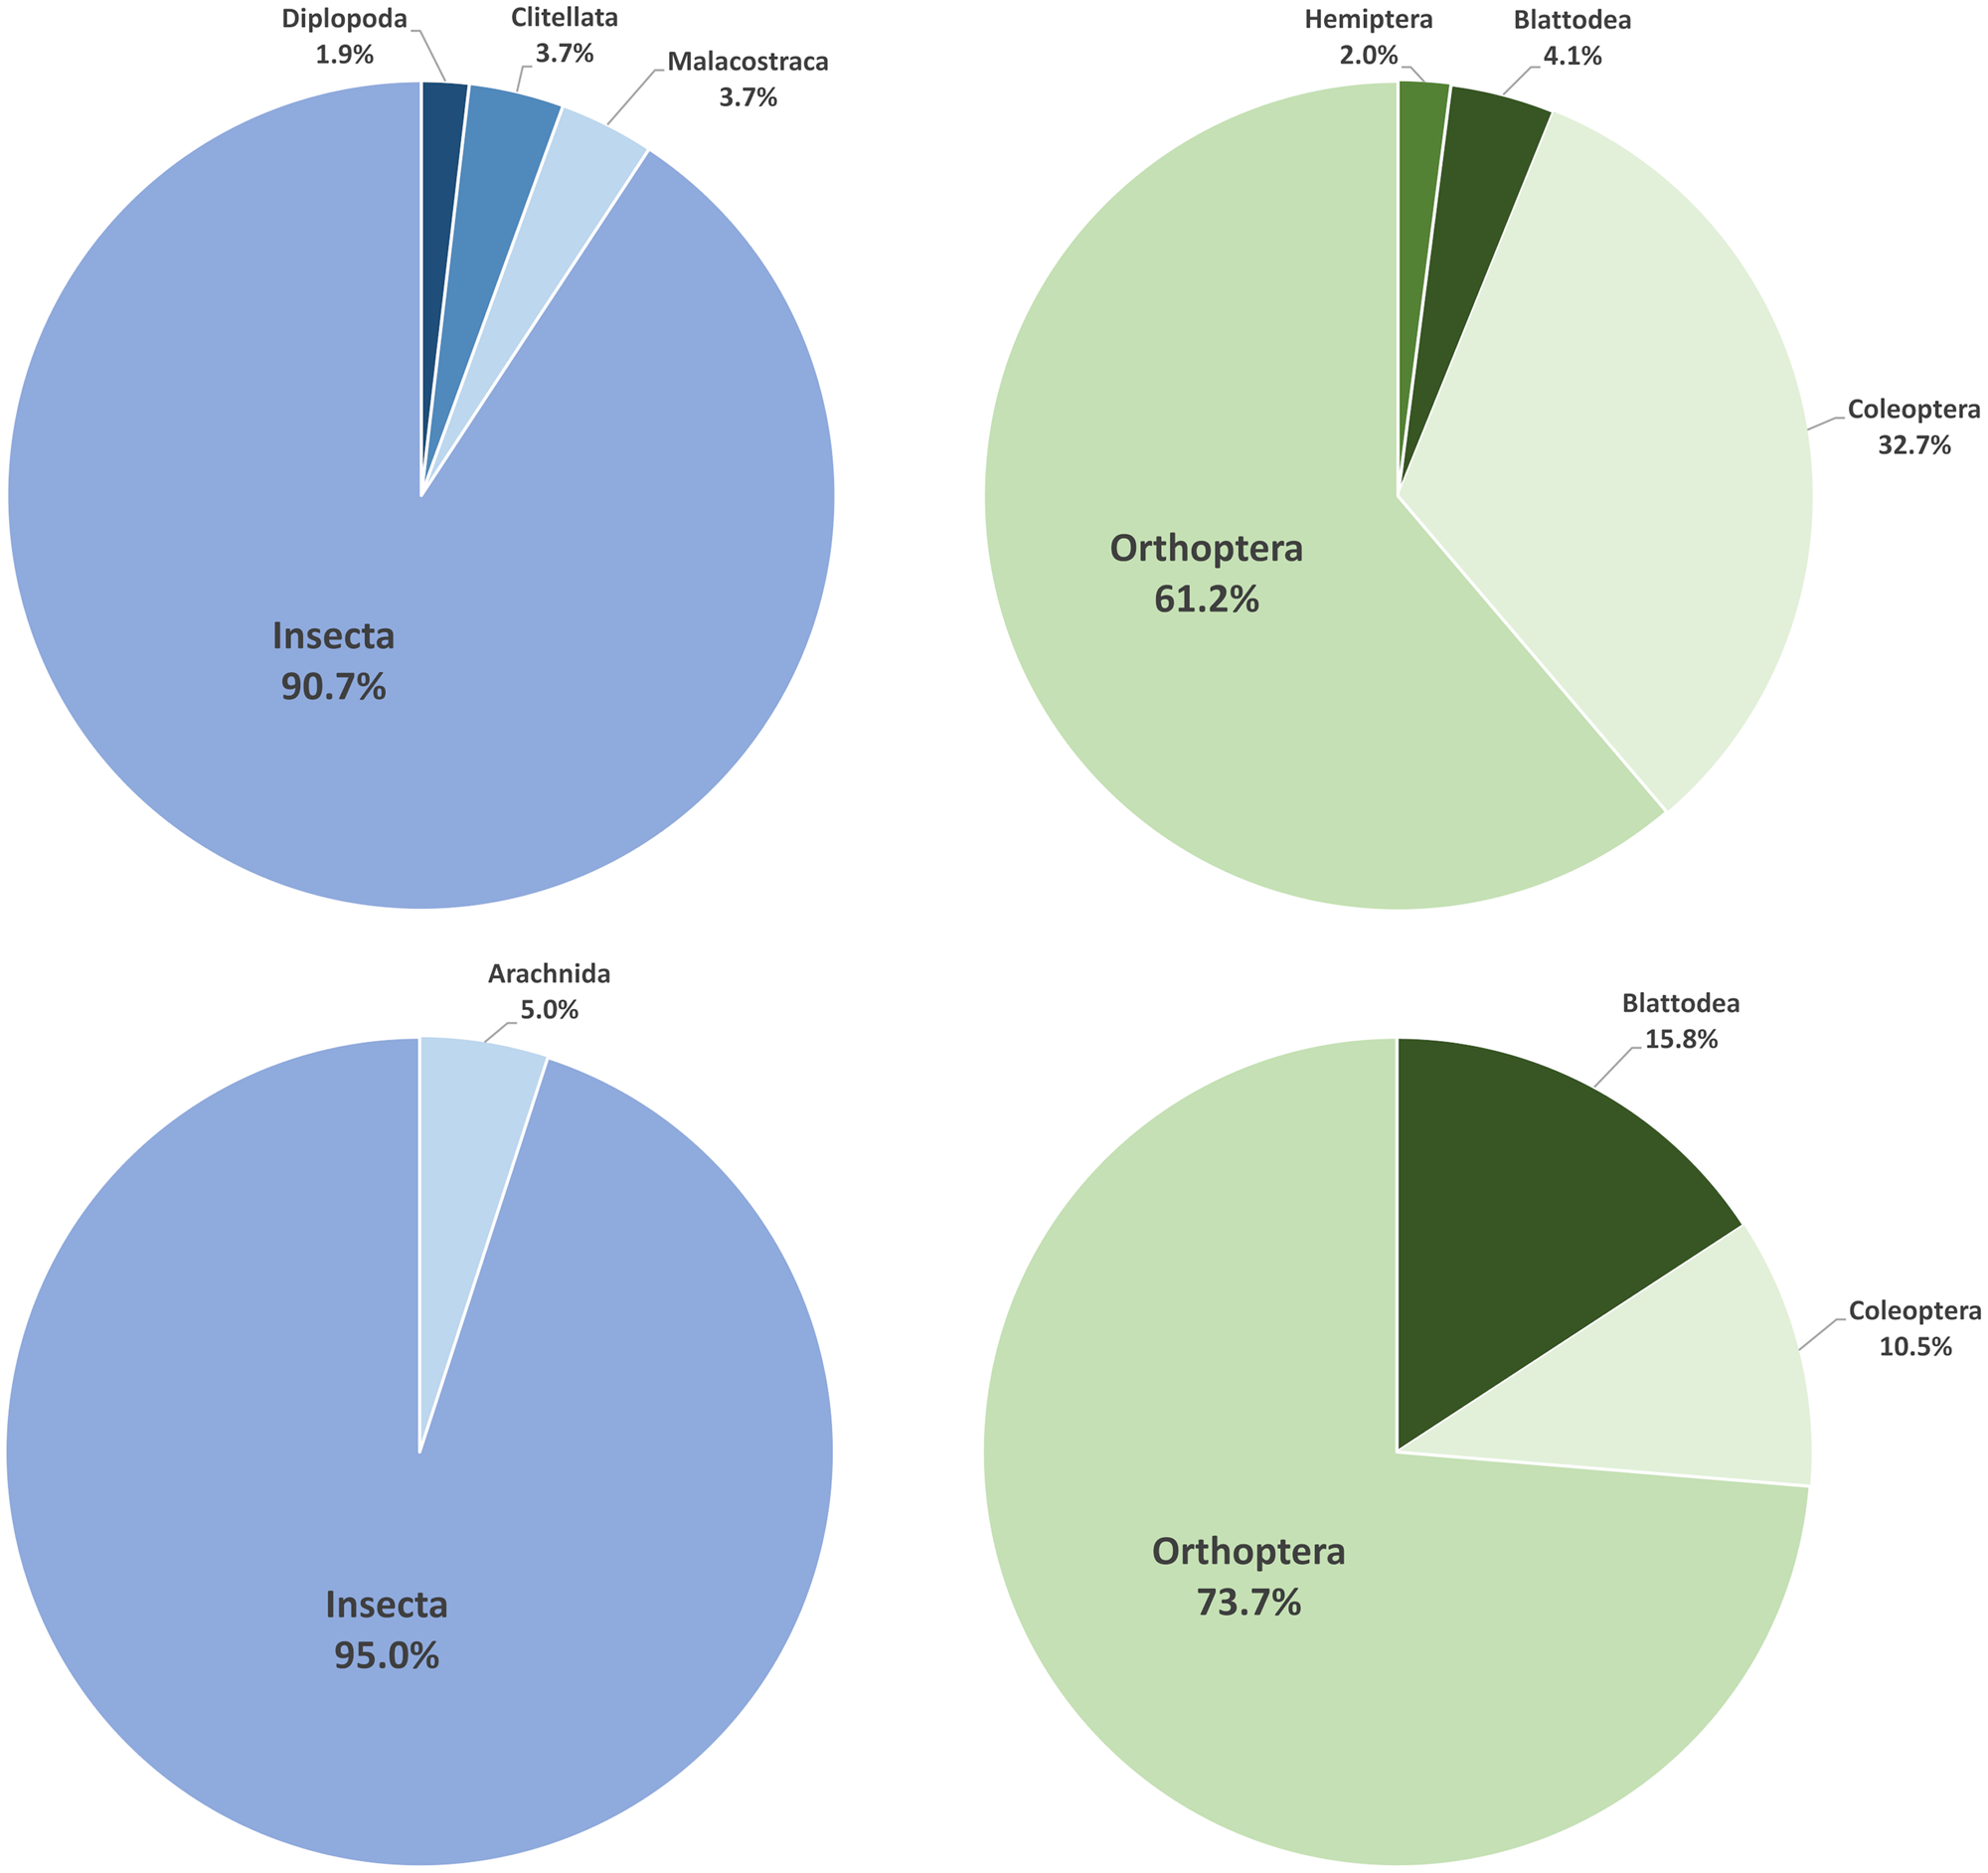
The distribution of hairworms per host class and per insect host order from the scientific literature and internet photo data in North America is presented in Fig. 4. The class Insecta accounted for over 90% of host records in both sources of data. However, different sets of host classes make up the rest of the hairworm–host associations (Fig. 4). For example, spiders are only reported as hosts of hairworms in internet photo data. Nevertheless, a chi-squared test of independence supports the null hypothesis that the frequencies of records among host taxa are not different between the two sources of data (χ 2 = 4.581, df = 4, P value = 0.333). Similarly, the distribution of records among insect host orders was similar between both sources of data (χ 2 = 5.801, df = 3, P value = 0.122). Indeed, Orthoptera comprised of at least 60% of definitive insect host records in both the scientific literature and the images uploaded to iNaturalist (Fig. 4).
Distribution of definitive host records of hairworms (phylum Nematomorpha) per host class (blue) and insect host order (green) in Canada and the United States of America. The top two pie charts represent host records collated from the scientific literature, whereas the bottom two pie charts represent host records obtained from images uploaded to iNaturalist.

Discussion
In recent years, ecologists and conservation biologists have made increasing use of the massive data accumulating on various internet platforms as a consequence of public curiosity (Jarić et al., Reference Jarić, Correia, Brook, Buettel, Courchamp, Di Minin, Firth, Gaston, Jepson, Kalinkat, Ladle, Soriano-Redondo, Souza and Roll2020). Similarly, epidemiologists have used internet data to successfully track disease outbreaks in space and time (Carneiro and Mylonakis, Reference Carneiro and Mylonakis2009; Ning et al., Reference Ning, Yang and Kou2019; Aiello et al., Reference Aiello, Renson and Zivich2020). However, it is only recently, and in a still limited number of cases, that internet data have been harnessed to test hypotheses in general parasitology, an approach referred to as iParasitology (Poulin et al., Reference Poulin, Bennett, Filion, Bhattarai, Chai, de Angeli Dutra, Donlon, Doherty, Jorge, Milotic, Park, Sabadel and Thomas2021). Our study demonstrates its potential to inform host–parasite interactions. We found that internet data can (1) identify geographical areas of apparently high hairworm abundance that have not yet received much scientific attention, (2) predict seasonal peaks in abundance of free-living adult hairworms that match those recorded by researchers and (3) correctly identify the most frequent host taxa of hairworms, and even point to some host taxa that may have been previously understudied by scientists. Overall, our study validates internet data collected by non-scientists as a reliable and complementary source of information about parasites.
Hairworms are likely to be distributed widely across all of North America, except for the most arid areas and the far north of the continent. Yet, the distribution of published scientific records of hairworms is highly uneven across the continent. Scientists often conduct most of their research locally, i.e. near their home institution (Martin et al., Reference Martin, Blossey and Ellis2012). Therefore, the distribution of scientific records of hairworms probably reflects the activity of the few specialists working on these parasites, such as the research groups of Dr Matthew Bolek (Oklahoma State University) and Dr Ben Hanelt (University of New Mexico). In contrast, the number of curious members of the public is probably just a roughly constant fraction of the total population within a geographical region. Controlling for population size, data from both internet searches and uploaded photos suggest that other areas of North America, which have received little or no scientific attention, may in fact be hot spots of hairworm abundance. These include California, New York, Alberta and Ontario. Other factors that vary spatially may influence the likelihood that people encounter hairworms. For instance, in the most arid states of the southwestern United States, people and hairworms may be concentrated in areas of water availability, whereas the overlap between people and hairworms might be much lower in areas with a wetter climate. The links between landscape, weather and human behaviour go beyond the scope of the current study, and do not weaken its findings. Earlier studies have shown that data from both passive crowdsourcing mined from uploaded photos (Elmer et al., Reference Elmer, Kohl, Johnson and Peachey2019) and active citizen science programmes (Pernat et al., Reference Pernat, Kampen, Jeschke and Werner2021) can serve to extend the known geographical range of parasites or disease vectors beyond what had been determined by scientists. Conservation biologists also benefit from internet data to better delimit the geographical range of endangered species (e.g. McDavitt and Kyne, Reference McDavitt and Kyne2020). In the case of hairworms, our findings provide a list of areas that may be worth exploring more intensively for these parasites. Although we did not analyse data from the rest of the world, because language issues and unequal internet access may affect the validity of internet data collected in English, a look at the distributional maps also shows large discrepancies between where hairworms are found based on scientific records vs either internet search data or photo uploads data (see interactive Fig. S3 in the Supplementary material).
Queries from the public about hairworms using the search engine Google show a clear temporal peak in summer months. People are only likely to notice hairworms when they emerge from their hosts, or during their short adult life post-emergence in water. The summer peak in sightings seems to fit with the known developmental schedule of hairworms and seasonal phenology of their arthropod hosts in temperate zones, with emergence from the host often reported in spring or early summer (Schmidt-Rhaesa, Reference Schmidt-Rhaesa and Schmidt-Rhaesa2013). The few scientific studies conducted in the temperate Northern Hemisphere and monitoring hairworm abundance over a full year also show a peak in summer months (e.g. Meguro et al., Reference Meguro, Kishida, Utsumi, Niwa, Igarashi, Kozuka, Naniwa and Sato2020). Not all such studies in North America show this seasonal pattern, however, possibly due to the greater dependence of certain hairworms on precipitation in the parts of the continent with a milder winter (e.g. Anaya et al., Reference Anaya, Hanelt and Bolek2021). However, the summer peak in internet search activity probably highlights a general continent-wide, seasonally-driven life cycle and provides a clear example of the reliability of internet data to capture real biological phenomena.
Interestingly, data from photos uploaded to iNaturalist do not show any seasonal peak. There are at least two reasons for this mismatch between internet search data and scientific data on the one hand, and data from photo uploads on the other hand. First, the much smaller number of hairworm photos available compared to the huge number of internet searches makes the photo data more subject to stochastic effects and less likely to show clear patterns. Second, the date associated with each photo is entered manually by the user at the time of upload. It is possible that users make mistakes and enter not the date when the photo was taken, but the date when it was uploaded. However, it seems unlikely that a large enough number of people would make such errors to erase the underlying seasonal trend. Whatever the reason for the mismatch, to test for temporal patterns in parasite sightings, we recommend internet search data, as searches are much more likely to be conducted very soon after a sighting and are thus less prone to errors of date.
Finally, we identified the host taxon seen in all photos of hairworms emerging from their host to construct a dataset on the main arthropod taxa used by hairworms, and compared it to a similar dataset assembled from published records in the scientific literature. For this purpose, we did not consider data from internet searches; even if the person making the query names the host from which a hairworm was seen emerging, there is no way of validating identifications made by members of the public. Our findings indicate that the two datasets are statistically congruent, with orthopterans (e.g. crickets, grasshoppers, etc.) dominating in both cases. Interestingly, however, spiders have been seen as the host of hairworms in photos uploaded by the public, but get no mention as hairworm hosts in the North American scientific literature retrieved by our search of Web of Science. Spiders are known hosts of hairworms in many parts of the world (see Schmidt-Rhaesa, Reference Schmidt-Rhaesa and Schmidt-Rhaesa2013), although some doubts have been raised about the reliability of certain reported hairworm-spider associations (see Poinar, Reference Poinar2000). Our results suggest that either spiders are more likely to attract public attention (and thereby get overrepresented in photos), or they have been understudied by scientific researchers. In a similar vein, Mikula et al. (Reference Mikula, Hadrava, Albrecht and Tryjanowski2018) found that photos available on the internet showing African oxpeckers feeding on ticks attached to mammals reveal some bird–mammal associations that are underrepresented in the scientific literature. Whatever the reason for the small discrepancy we observed between photo data and scientific data, internet data on host use are proving valuable as they globally confirm observations by scientists, and possibly even guide future research towards neglected host taxa.
Citizen scientists have already helped in the study of nematomorphs, by contributing specimens for a study of hairworm genetic diversity (Hanelt et al., Reference Hanelt, Schmidt-Rhaesa and Bolek2015). The main goal of the present study was to determine whether iParasitology, i.e. harnessing internet data for parasitological research, can complement the more traditional sources of scientific data with additional and valid information. Our results suggest that it can do that. There are limitations to the use of data passively generated by the public and available on the internet (see Poulin et al., Reference Poulin, Bennett, Filion, Bhattarai, Chai, de Angeli Dutra, Donlon, Doherty, Jorge, Milotic, Park, Sabadel and Thomas2021). However, for visible parasites likely to arouse curiosity, such as ectoparasitic copepods and isopods on fish, or those that induce noticeable changes in host appearance, such as cataract-inducing diplostomid trematodes in freshwater fish (Karvonen et al., Reference Karvonen, Seppälä and Valtonen2004), members of the public can act as reliable recorders of parasite occurrence. We encourage parasitologists to reflect on how internet data might contribute to their studies, and consider adding iParasitology to their research toolbox.
Supplementary material
The supplementary material for this article can be found at https://doi.org/10.1017/S0031182021000962
Data
Data compiled and used for this study are available in Table S1 in the Supplementary material.
Acknowledgements
This paper was prepared during a working retreat hosted by the New Zealand Marine Studies Centre (Portobello) and the Quarantine Island Lodge (Otago Harbour). We thank Rob Lewis for his time and invaluable assistance, and the Emerson's Brewery, Dunedin, for generous liquid sponsorship. And we also acknowledge the curious people who upload photos and seek answers on the internet, without whom the huge datasets used here would not exist.
Author contributions
RP conceived the study in consultation with all other authors; all authors contributed to compilation of the data; JFD and AF analysed the data and prepared the figures; JFD, AF and RP wrote the manuscript, with input from all authors.
Financial support
JFD, AF, JB, URB, XC, DdAD, MM and EP are supported by postgraduate scholarships from the University of Otago. JFD is also supported by a Natural Sciences and Engineering Research Council of Canada (NSERC) scholarship (PGSD3-530445-2019). FJ, AJMS and RP receive support from the Marsden Fund (Royal Society of New Zealand).
Conflict of interest
The authors declare having no conflict of interest.