What are the macroeconomic consequences of a pandemic? Do non-pharmaceutical interventions (NPIs) change the dynamics of the epidemic and at what economic cost? These questions have arisen during the Covid-19 pandemic and it is natural to look at precedents for answers. Pandemics are rare and the most recent one of comparable magnitude is the Spanish influenza of 1918/19.Footnote 1 It is known that the United States economy experienced a recession at the same time as the pandemic, but it was of “exceptional brevity and moderate amplitude” (Burns and Mitchell Reference Burns and Mitchell1946, p. 109).
But are not pandemics disasters? When they are not, is it because they were mitigated? Or do they become economic disasters because of costly mitigation? Perhaps because of their rarity, pandemics have not attracted the sustained attention of economists. In their survey after the SARS outbreak, Bell and Lewis (Reference Bell and Lewis2004, p. 151) noted that the 1918 pandemic had “not received much attention from economists” and the forthcoming survey by Beach, Clay, and Saavedra (Reference Beach, Clay and Saavedra2021) confirms the literature on the economic effects of the 1918 pandemic remains sparse; it was even more so when this paper was first written.Footnote 2 Not only sparse: it is also inconclusive.
Part of the literature suggests that pandemics have sizeable and long-lasting effects. Jordà, Singh, and Taylor (Reference Jordà, Singh and Taylor2020) go back as far as the fourteenth century to find rates of return depressed for decades. Barro, Ursúa, and Weng (Reference Barro, Ursúa and Weng2020) use annual aggregate data for a large cross-section of countries affected by the 1918 pandemic and find evidence for sizeable effects on GDP (negative), stock prices (negative), and inflation (positive). For the United States, with limited regional data at two points in time (1919/21 and 1930), Brainerd and Siegler (Reference Brainerd and Siegler2002) find evidence of higher growth rates in the 1920s for states more affected by the epidemic; interpreted as a return to trend growth, they imply a sizeable departure from trend. In the same vein Correia, Luck, and Verner (Reference Correia, Luck and Verner2020, April version) examine the impact of mortality and NPIs in 1918 on outcomes in later years, using a cross-section of cities and states between 1919 and 1923. They find a large negative impact of mortality, and positive impact of interventions, on output, employment, consumer durables, and bank balance sheets five years after the epidemic. The impacts are not only large but also growing over time.
Another part of the literature, however, is less apocalyptic. Based on qualitative evidence mostly from the St. Louis Federal Reserve District, Garrett (Reference Garrett2007) finds that the effects were short-term. Fourie and Norling (Reference Fourie and Norling2021) documents mild and short-lived effects from household consumption data in the United States. Using annual state-level data on employment from 1914 to 1924, Bridgman and Greenaway-McGrevy (Reference Bridgman and Greenaway-McGrevy2020) find no effect of the pandemic or interventions after controlling for the wartime boom. Empirical findings in other countries are similar: in Sweden, Karlsson, Nilsson, and Pichler (2013) find a negative impact on capital income and poverty rates (after 1920) but no effect on earnings. Dahl, Hansen, and Jensen (2020), for municipality-level data in Denmark, and Domènech Feliu, Roses Vendoiro, and Basco Mascaro Reference Domènech Feliu, Ramon Roses Vendoiro and Basco Mascaro(2020), in Spain, also find limited effects (see also Benmelech and Frydman Reference Benmelech and Frydman2020). In Italy, Carillo and Jappelli (Reference Carillo and Jappelli2020) find a 6.5 percent difference in GDP growth between the most-affected and the least-affected region, but it dissipates within three years. Bodenhorn (Reference Bodenhorn2020), in a recent in-depth study of the U.S. South, finds a severe shock to the labor supply and generally mild effects, albeit commensurate with the magnitudes of Barro, Ursúa, and Weng (Reference Barro, Ursúa and Weng2020).
Why would a pandemic have economic consequences? An unusual and widespread illness is, at a minimum, a labor supply shock, as individuals fall sick and are taken out of the labor force, or avoid working because of contagion fears. Production is disrupted by the absence of some workers as coordinated tasks cannot be performed. In addition, the illness may also generate a demand shock, to the extent that some consumption is curtailed either voluntarily (because of income loss or contagion fears) or by NPIs designed to reduce the spread of the illness. Guerrieri et al. (Reference Guerrieri, Lorenzoni, Straub and Werning2020) show that this does not happen in a one-sector new Keynesian model (the contraction in demand is less than the contraction in supply) but can arise through complementarities in demand across multiple sectors. Then, the initial disruption might have persistent effects through a variety of transmission mechanisms and state variables. Business failures destroy organizational capital, household and firm balance sheets are weakened, human capital is lost through deaths and depreciation of skills during unemployment. With adjustment costs capital, both financial and human takes time to return to its initial level. Reallocation of resources may be hampered by frictions. Another possible mechanism to slow the recovery is uncertainty, either about the duration of the shock or about impending policy responses. Finally, if the shock is large enough agents might revise their beliefs about future risks and increase precautionary saving (Kozlowski, Veldkamp, and Venkateswaran Reference Kozlowski, Veldkamp and Venkateswaran2020).
With these mechanisms in mind, I examine the U.S. macroeconomy in depth during and immediately after the Spanish influenza epidemic. The goal is to document what happened to the economy and, if possible, parse out what part of the recession can be attributed to the pandemic. To do so, I need high-frequency data, because the pandemic and the interventions were brief, and were soon followed by the end of WWI. Contemporary commentary suggests that the Armistice of 11 November 1918 and the reallocation of resources (including four million demobilized soldiers) for a peacetime economy created uncertainty and weighed on activity. Independently of the pandemic, the analysis can also be viewed as a case study of a recession where the initial shock is easily recognized and quantifiable.
Casting a wide net for data at the highest possible frequency, I look for the channels by which the epidemic could affect the economy, both immediately and through its impact on state variables. I look at aggregate time series but also at regional time series. The point here is not that the cross-section is a silver bullet to prove causality, much less a substitute for common sense (Monnet and Velde Reference Monnet, Velde, Bisin and Federico2021); but if there is evidence in the cross-section that the disruption affected demand in 1919 or 1923, a sanity check is to look for such effects in 1918, in particular any state variables like balance sheets. Finally, to address the question of effectiveness and costs of NPIs, I estimate a standard epidemiological model augmented with an economic component, which allows me to dissociate the effect of the epidemic from that of interventions. I also draw on contemporary testimony to corroborate what the time series suggests.
My main conclusion is that the pandemic coincided with the start of a mild recession from which the economy rebounded quickly. I distinguish the initial downturn, due to a negative labor supply shock, from the rest of the recession, likely due to the end of the war rather than the pandemic itself. Output was contemporaneously affected through a negative labor supply shock but demand reacted very little, and there was little damage done to the balance sheets of the nonfinancial or financial sector. Interventions affected mortality, as is known from the epidemiological literature, but had limited implications for contemporaneous economic outcomes. Given the peculiar nature of the epidemic that affected the labor force through incapacitation, the negative direct impact of NPIs (if any) was probably compensated by the mitigation of the labor supply shock. The conclusions are broadly similar to those of Bodenhorn (Reference Bodenhorn2020), who uses some of the same data as I do. The absence of impact on balance sheets and business failures makes it difficult to identify channels for the long-run outcomes claimed by Correia, Luck, and Verner (Reference Correia, Luck and Verner2020). A possible reconciliation is the presence of pre-trends (Lilley, Lilley, and Rinaldi Reference Lilley, Lilley and Rinaldi2020) and the confounding effect of wartime activity (Bridgman and Greenaway-McGrevy Reference Bridgman and Greenaway-McGrevy2020).
The paper proceeds as follows. I first review the 1918/19 pandemic in the United States based on mortality data to delineate its timing and extent, and the policy responses (NPIs) that it prompted. The next section looks for the impact of the pandemic on various economic variables, paying attention not only to flows (hours worked, production, consumption) but also to state variables that could propagate the shock. Contemporary testimony suggests that the recession was partly due to the armistice that ended WWI, and to disentangle the two I look at regional data on the coal industry nationwide, and manufacturing in two states. Finally, to assess the epidemiological effects and economic costs of NPIs I estimate a structural model using weekly data at the city level. I then conclude with some speculation on the differences between 1918/19 on one hand, 1920/21 and 2020/21 on the other hand.
THE 1918 PANDEMIC IN THE UNITED STATES
The general features of the 1918 pandemic are well known and I will therefore be brief. The purpose of this section is to set the time-frame of the pandemic, emphasize its short duration, assess its impact on the labor force, and review the NPIs that will be assessed. Replication files are available from Reference VeldeVelde (2022).
Timing
From origins, both biological and geographic, that remain unclear (Morens and Fauci Reference Morens and Fauci2007, table 1) the pandemic swept the world in waves. The first, in spring 1918, was debilitating but not very lethal and propagated from the United States to Europe, probably through troop movements (Patterson and Pyle 1991). Its virulence was noticed in May 1918 as it spread through Europe. It may have mutated sometime in August, as a much more lethal second wave spread through Europe and also arrived in New England in late August 1918. Deaths peaked in most of the United States after several weeks and the epidemic was waning by November 1918, but some areas were affected by a third wave in the winter or early spring 1919.
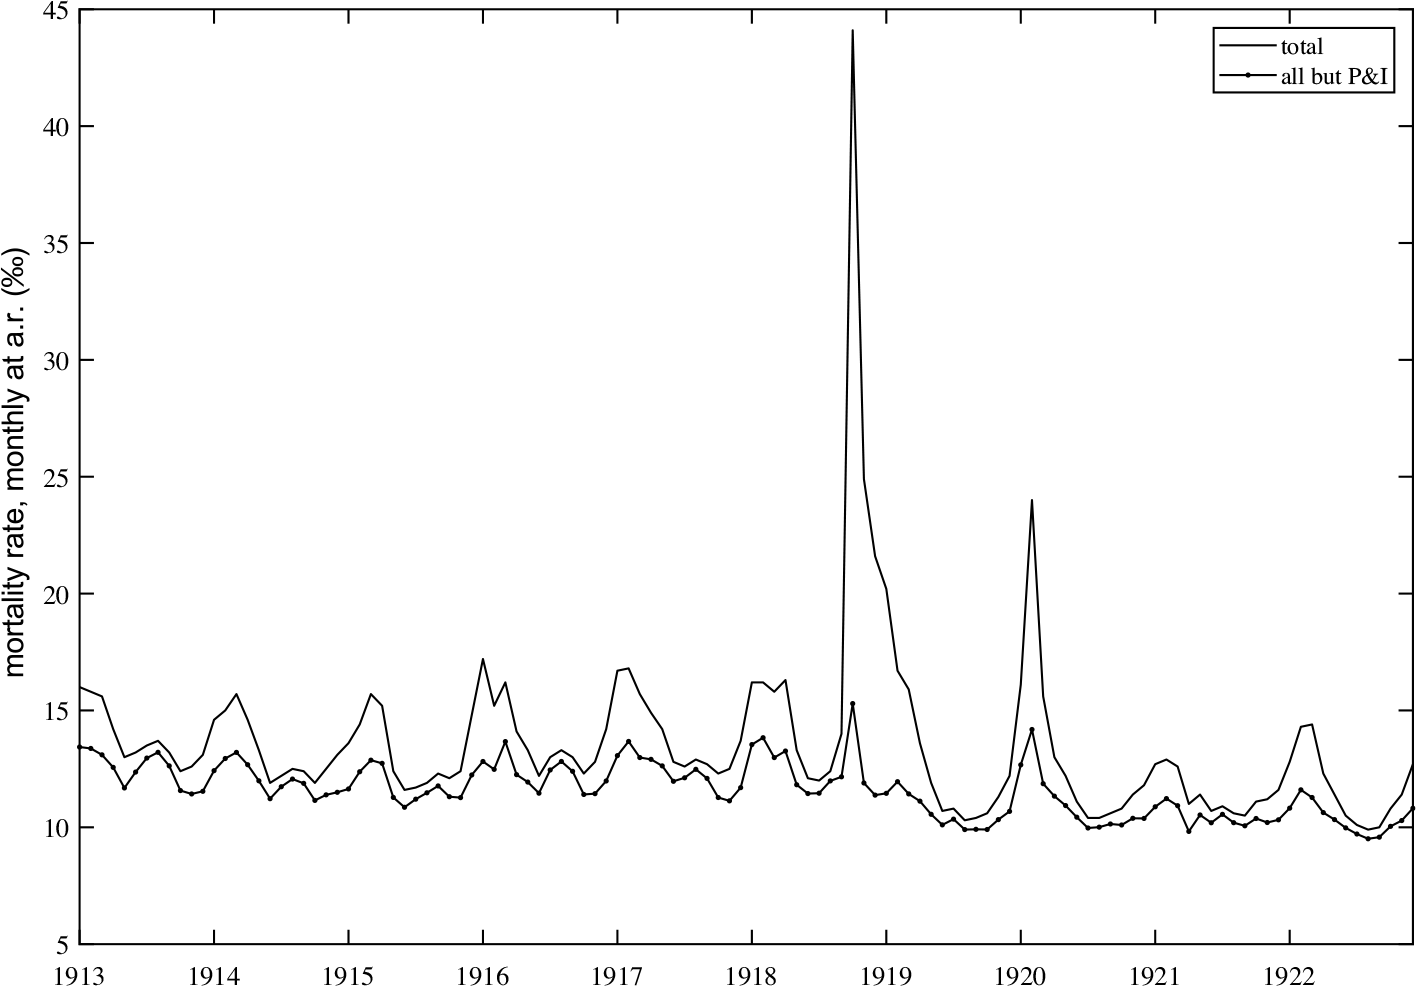
Influenza was generally not a reportable disease before the 1918 epidemic and data on cases are spotty and unreliable. Since “most fatalities had secondary pneumonias caused by common bacteria” (Morens and Fauci Reference Morens and Fauci2007, p. 1019), deaths were variably recorded as due to influenza or pneumonia, with much variation in reporting. Hence the standard way to track the epidemic is through excess mortality from pneumonia, broncho-pneumonia, and influenza (excess pneumonia and influenza (P&I)). Figure 1 compares the monthly mortality rate from all causes and from all but P&I in registration states.Footnote 3
U.S. MORTALITY RATE FOR ALL CAUSES, AND FOR ALL EXCEPT INFLUENZA AND ALL FORMS OF PNEUMONIA (P&I), MONTHLY 1913–1923
Sources: Bureau of the Census (1913–1923, Table 10), Linder and Grove (Reference Linder and Grove1947, pp. 824–71) (for population numbers).

Influenza was a familiar disease that accounted for a substantial and seasonal component of deaths, peaking between January and March of each year. But the year 1918 stands out. While “most patients experienced symptoms of typical influenza with a three- to five-day fever followed by complete recovery” (Kilbourne Reference Kilbourne2006, p. 9), the lethality of the virus was unusual. A late but relatively small mortality peak in April 1918, perhaps due to the first spring wave, was followed by the outsize peak of October 1918, and another smaller peak in February 1920.
Mortality
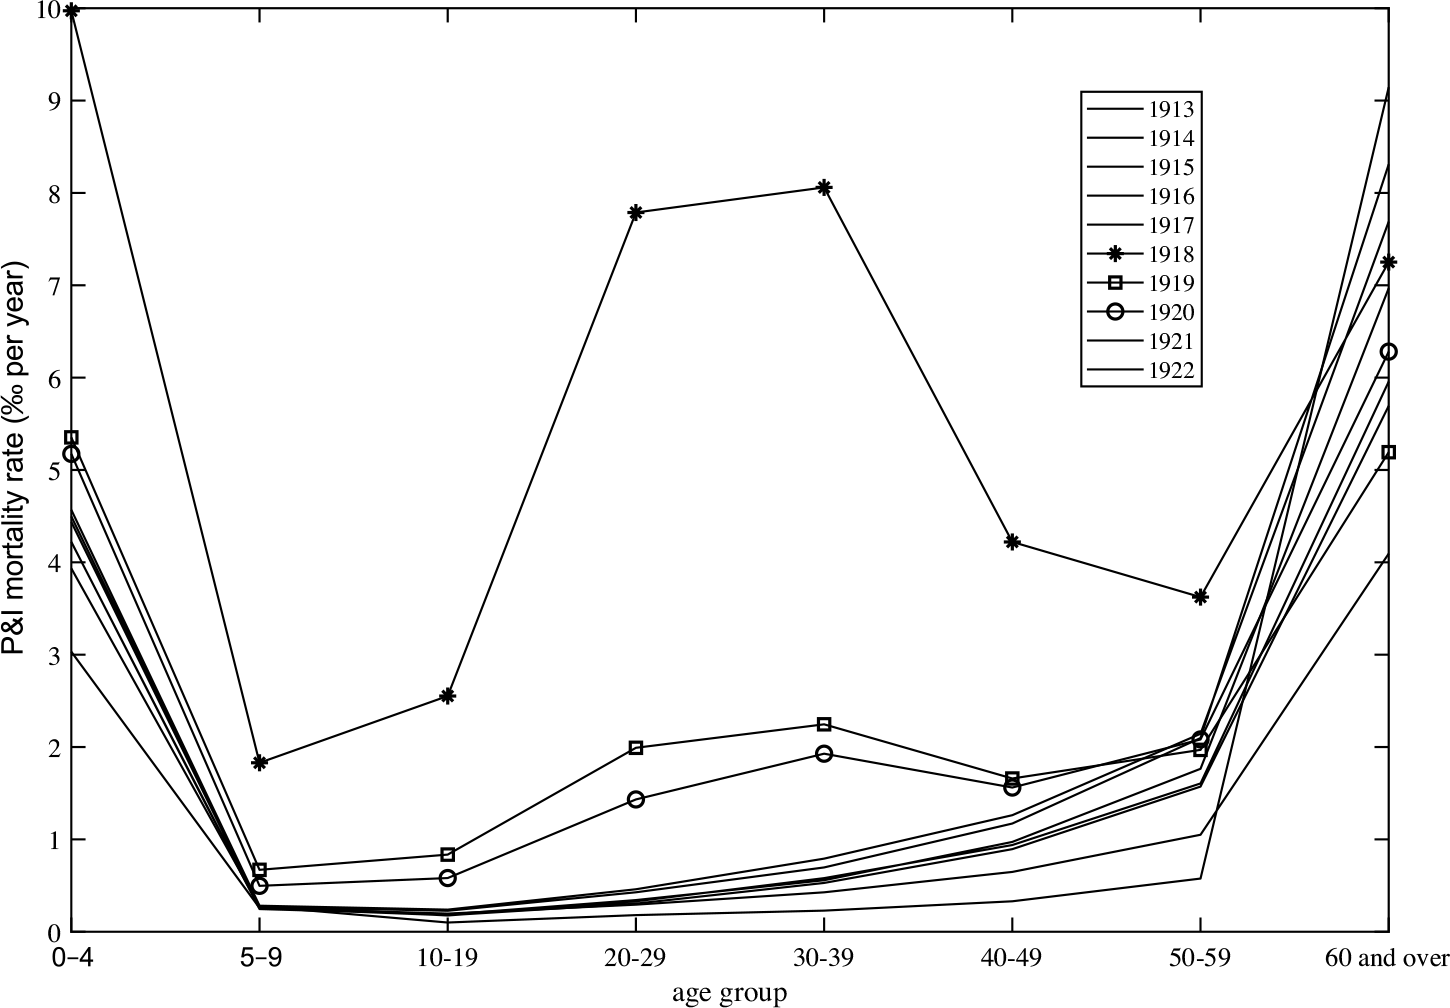
The influenza waves of 1918–1920 are characterized by the pattern of mortality across ages, shown in Figure 2 for successive years. The years 1913–1917 display an identical “U-shaped” pattern of mortality high for the young and old and negligible for ages 5 to 60. The years 1918–1920 display a “W-shaped” pattern, particularly pronounced in 1918 but present in the next two years as well. The pattern disappears after 1920.
P&I MORTALITY IN THE UNITED STATES (REGISTRATION STATES) BY AGE GROUP, 1913–1922
Source: Census Bureau, Mortality Statistics (1913–1921).

Excess P&I mortality was 0.5 percent of the population between July 1918 and July 1919, and another 0.07 percent in the following 12 months. The unusual age pattern of mortality, however, means that the labor force was much more affected by the lethality than in any other influenza season. I calculate that excess P&I mortality in 1918 was only 300,000 in the 20–60 age group, which represents 0.56 percent of the group or 0.77 percent of the labor force. By comparison, U.S. casualties in WWI (battle deaths and other deaths) were 116,000.
The epidemic also caused temporary incapacitation. The best information (Frost Reference Frost1920), based on surveys carried out immediately after, suggests an attack rate of 20 to 25 percent. The course of the disease, however, was relatively rapid. Based on data from Chicago, Keeton and Cushman (1918) show that 89 percent of admitted patients had died or recovered within three weeks, and the peak of mortality was nine days after admission. The labor supply impact of the disease would therefore occur in the months of high mortality. An upper bound estimate, assuming that all those infected are incapacitated for a full month, would be a one-month drop of around 20 to 25 percent, or a 2 percent reduction in labor supply on an annual basis.
Spatial Pattern
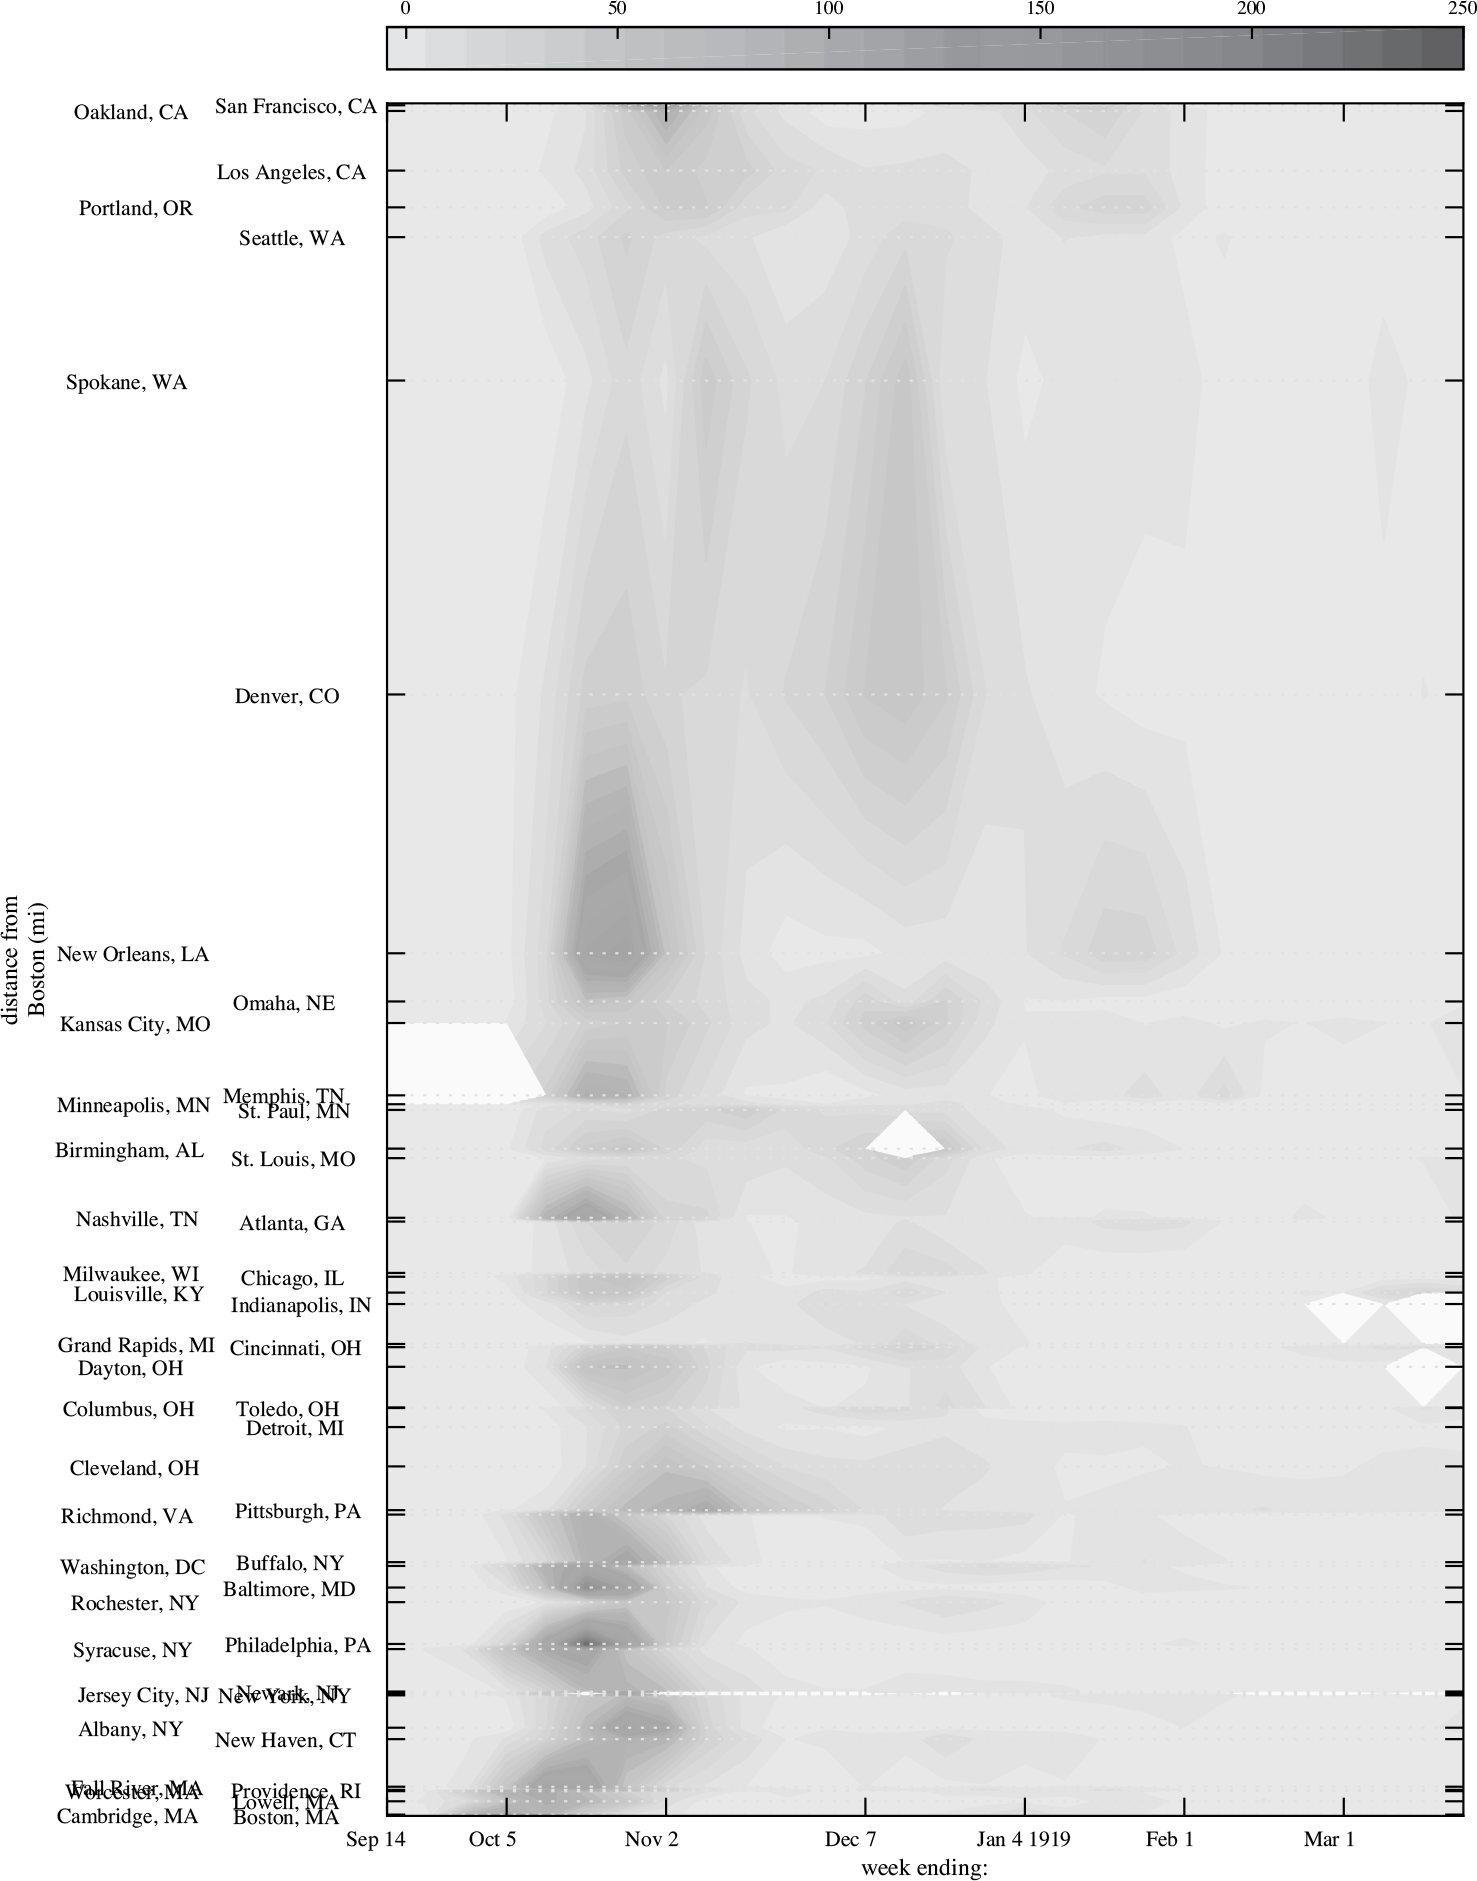
Finally, Figure 3 shows the spatial and temporal pattern of the 1918 epidemic in the United States, by plotting excess P&I mortality for 47 cities at a weekly frequency (Collins et al. Reference Collins, Frost, Gover and Sydenstricker1930). I use distance from Boston, the starting point of the epidemic, merely as a convenient way to reduce the spatial dimensions to one. The figure shows that the epidemic propagated rapidly from New England to the whole country, hitting the West Coast last. Peak mortality varied widely across cities, and mortality rates fell back within weeks except for the third wave in some places, mostly west of the Alleghenies.
CONTOUR MAP OF EXCESS P&I MORTALITY RATES (DEATHS PER 100,000 PER WEEK) OF 47 U.S. CITIES PLOTTED AGAINST TIME (IN WEEKS) AND DISTANCE FROM BOSTON
Source: Collins et al. (Reference Collins, Frost, Gover and Sydenstricker1930).

Non-Pharmaceutical Interventions (NPIs)
The epidemiological literature (Ferguson et al. Reference Ferguson, Cummings, Christophe Fraser and Cajka2006; Bootsma and Ferguson Reference Bootsma and Ferguson2007; Hatchett, Mecher, and Lipsitch Reference Hatchett, Mecher and Lipsitch2007; Markel et al. Reference Markel, Lipman, Alexander Navarro, Alexandra Sloan, Michalsen and Cetron2007) examines the effectiveness of NPIs on mortality outcomes, using the same weekly mortality data for the largest U.S. cities shown in Figure 3 (Collins et al. Reference Collins, Frost, Gover and Sydenstricker1930). NPIs, imposed mostly by cities but sometimes at the state level, took a wide variety of forms ranging from shutting down public gatherings and crowded places to staggering business hours, closing schools and churches, imposing quarantines for infected people, and requiring masks. No intervention in those cities went so far as closing all businesses, as have the lockdowns of the 2020 pandemic.
Markel et al. (Reference Markel, Lipman, Alexander Navarro, Alexandra Sloan, Michalsen and Cetron2007) measure the NPIs by sorting them into three categories and counting the number of days during which measures of each category are applied: thus, one day on which schools and bars are closed and sick people are quarantined counts as three. But all measures would not have similar economic effects: quarantines and self-isolation concerned individuals already less active. In addition, this one-time measure of the intensity of NPIs is not practical for time-series purposes. For these reasons, I concentrate on the timing and duration of closings of businesses.
The restrictions likely to impact economic activity directly were essentially closings of places of gatherings mandated by local authorities. The list varied somewhat, but almost always included theaters, movie theaters, bowling alleys, dance halls, and places of amusement in general. Saloons were not always included, and restaurants are rarely mentioned. Retail stores were not closed, although some cities like New York instituted staggered business hours to lessen crowding in public transportation. Outside of entertainment and saloons, businesses were not closed.
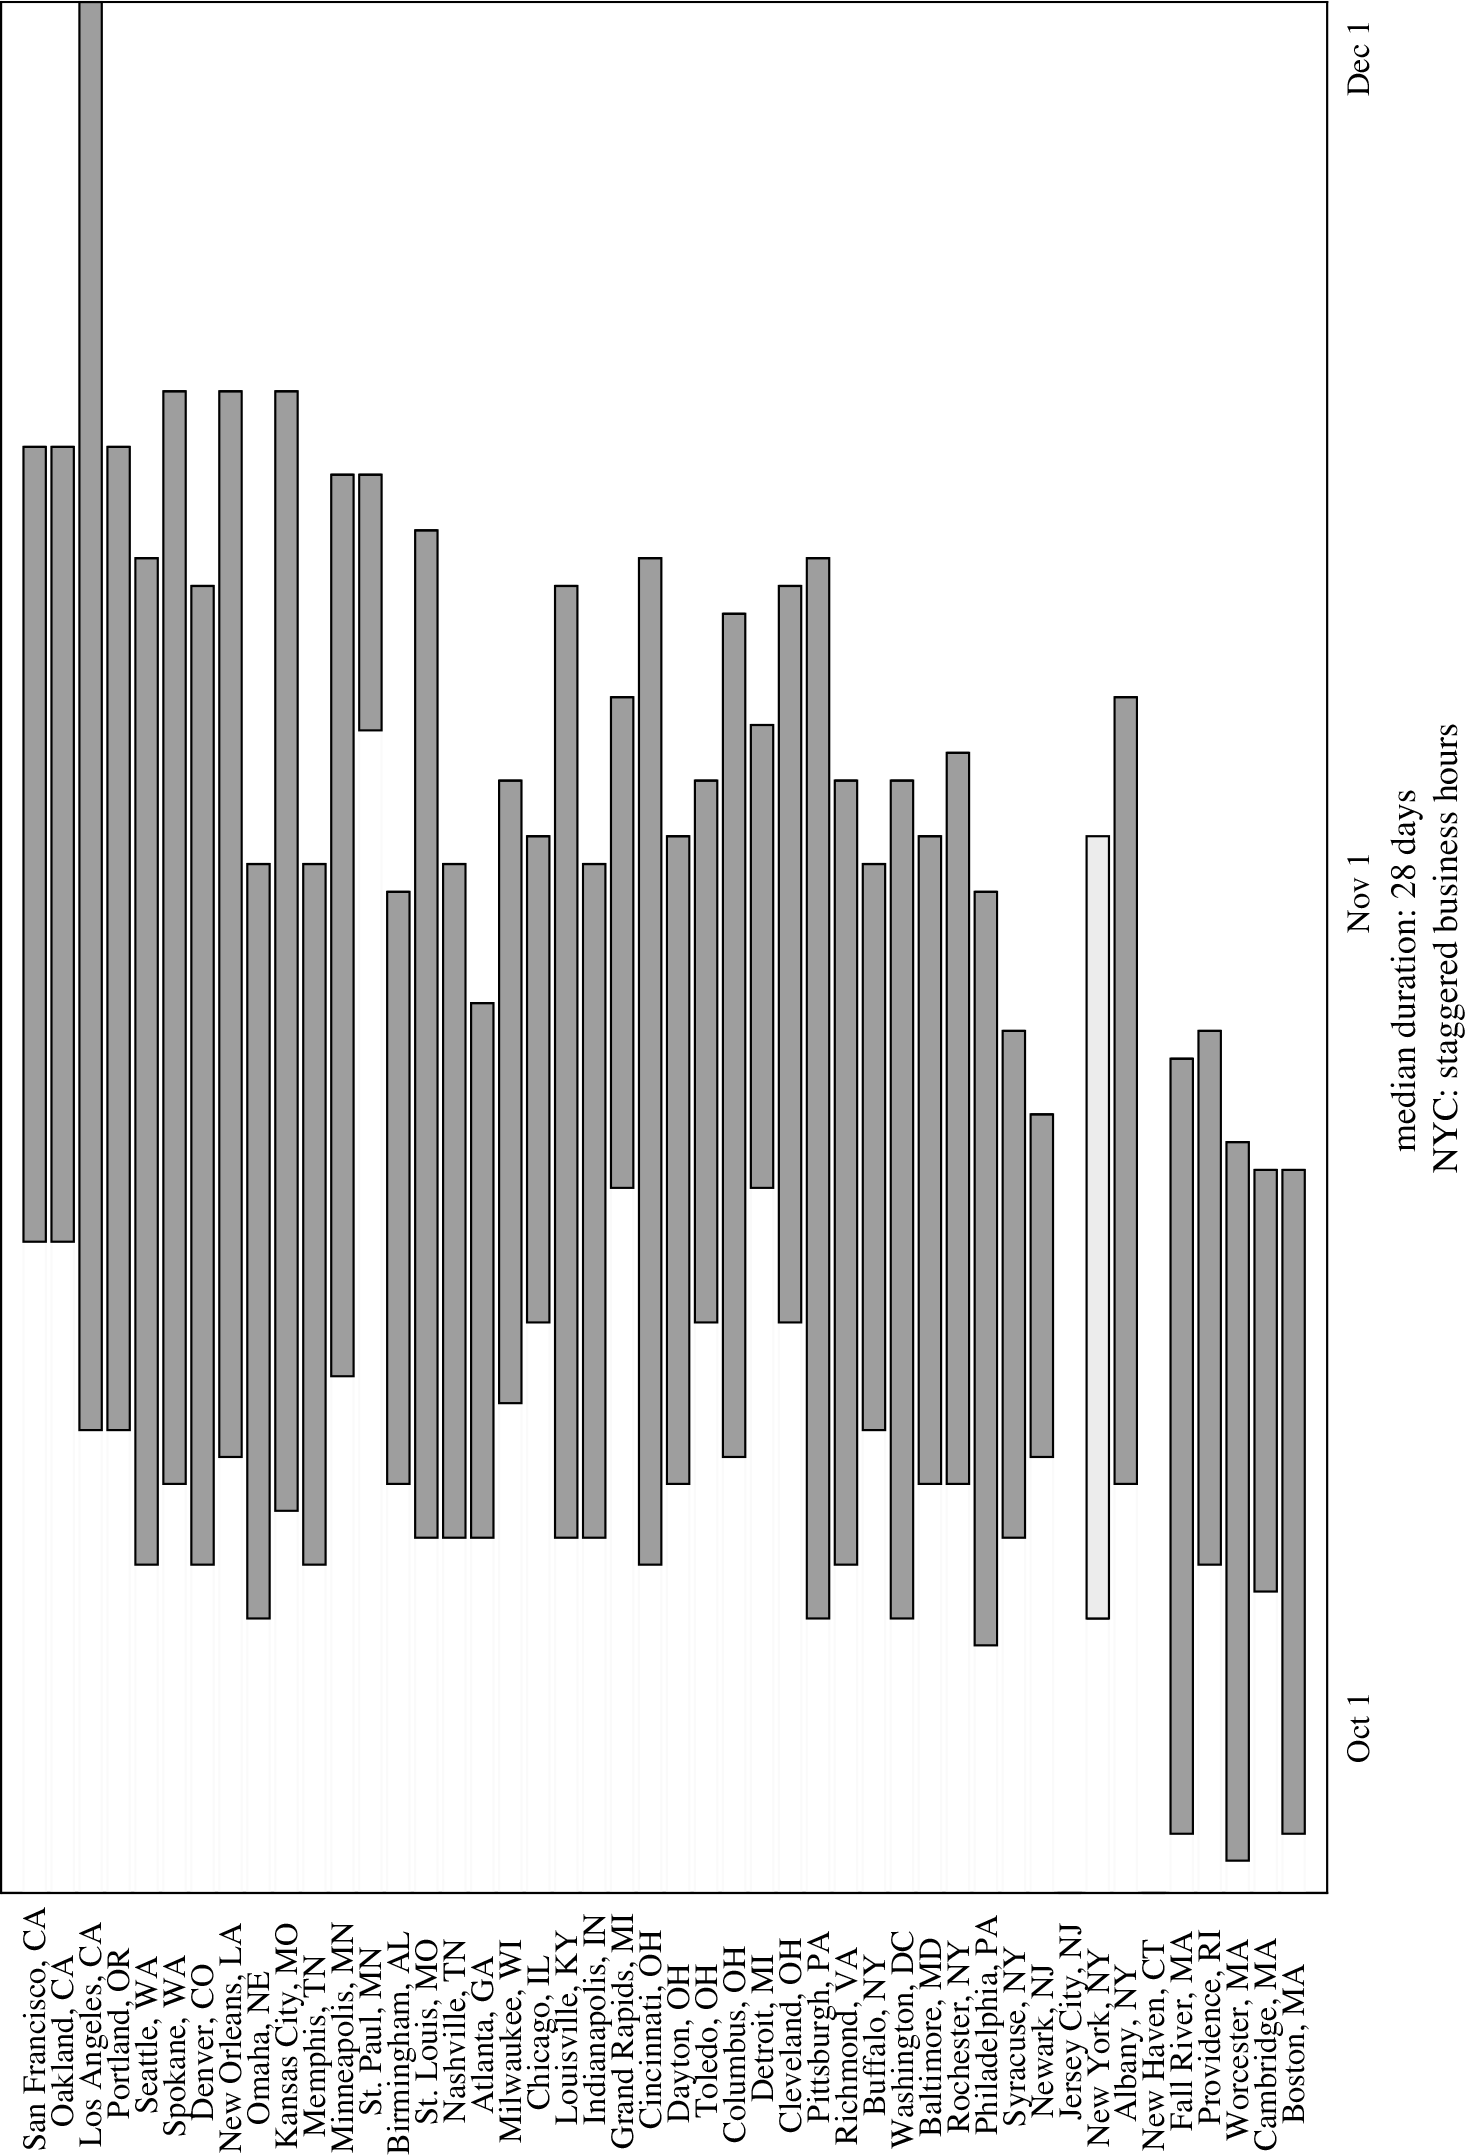
Figure 4 shows the duration of closings across U.S. cities. New Haven and Jersey City had no closings. The median duration of closings was 28 days, the earliest closing started on 25 September and the latest on 14 October. There were some school closings during the third wave (December 1918 to February 1919) but no businesses were closed. Hence, the cross-sectional variation in timing and duration of closings is quite limited.
TIMING AND DURATION OF CLOSINGS IN 43 U.S. CITIES
Source: See Online Appendix 1.

The closings of 1918 were not only short: compared to the lockdowns of 2020, they were mild. Using the scoring method of Hale et al. (Reference Hale, Noam Angrist, Petherick, Phillips and Webster2020), no city’s stringency rates were higher than 45; by contrast, throughout April 2020 only four countries out of 177 rated below 45. The views of health officials at the time help understand why. As the epidemic was hitting Chicago, William A. Evans, recent president of the American Public Health Association (see Benjamin, Fee, and Brown Reference Benjamin, Fee and Brown2010) wrote in the Chicago Tribune (6 October 1918):
Influenza will sweep over the country as it did in 1891 and as it has always done. We cannot escape it, but we can spread the cases over several weeks instead of having them all lump together as they usually come when the epidemic attacks men in barracks. If the epidemic can be spread out to a moderate extent our hospitals’ nurses and physicians can handle the situation.
In modern parlance, he advocated flattening the curve to avoid excess burden on the health care system and slowing the epidemic was not expected to change the total number of cases but to reduce the case fatality rate.
One fact everyone agreed on was that transmission was through “nasal and pharyngeal discharges,” and therefore close contact with infected persons, including the asymptomatic. Reducing contacts would logically help reduce transmission and an absolute reduction would stop the epidemic. Complete quarantines were tried effectively for small communities and institutions (Jordan Reference Jordan1927, pp. 452–58), but not on a large scale. Doing more was viewed as unacceptably costly, as one of many declarations from public health officials makes clear:
“As the living necessities of a community out-weigh the more rigid, but more consistent measure of a total closing, the Health Department closed those places of crowding not essential to the life of a town … Those cities which tried total closing methods did not bear with them except for a very short period…. A total closing would undoubtedly have ameliorated the trouble. The emergency of a daily livelihood is too great and such a condition could not be accomplished.” (Minneapolis Department of Health 1918, pp. 5–6, 11)
THE 1918/19 RECESSION
The epidemic and the interventions were very concentrated in time, compared to the frequency at which economic phenomena are normally measured. Detecting and measuring the immediate impact of the epidemic and interventions on the economy requires high-frequency data, at a minimum monthly or bi-monthly. The second challenge is the absence of many modern constructs that we typically use, particularly aggregate data. Finally, although much data was published by public and private actors (such as the weeklies Commercial and Financial Chronicle and Bradstreet’s), systematic collection by government agencies was only beginning. As a result, many modern series begin in January 1919.
One can start with the modern annual GNP series: the so-called standard series, based on the work of Simon Kuznets and his students (HSUS table Ca211), and modern revisions (Balke and Gordon Reference Balke and Gordon1989; Romer Reference Romer1989). The standard series and the Romer series actually show growth of 1.5 percent from 1918 to 1919, peak in 1919, and drop by 3 to 4 percent over the ensuing two years 1920 and 1921. The Balke-Gordon series peaks in 1918, drops 4 percent in 1919 and another 5.6 percent from 1919 to 1921. Thus all three agree on a fall in 1920 and 1921, which is the well-known post-war recession of 1920/21, but Romer (Reference Romer1988), in her extensive discussion of U.S. output during and after WWI, does not mention the influenza epidemic at all.
Business cycle historians identified a cyclical downturn at the time of the epidemic, distinct from the better-known recession of 1920/21. In their classic work, Burns and Mitchell (Reference Burns and Mitchell1946, pp. 78, 109) find a business cycle peak in August 1918 and a subsequent trough in April 1919, but note the “exceptional brevity and moderate amplitude” of the recession.Footnote 4 The data they used was a vast array of economic time series at the monthly frequency (Romer Reference Romer1994). In this section, I examine those that can pick up signs of the epidemic.
Visual inspection of the series confirms why the 1918/19 recession is often overlooked in business cycle histories: it was simply not that remarkable, particularly compared to the much worse 1920/21 recession. Industrial production shows a decline in 1918, and measures of employment confirm a sharp drop at the start of the epidemic. The magnitudes are in line with what one could expect based on the labor supply calculations of the previous section. When we turn to measures of spending and payments, however, much less is visible. In particular, the retail sector is fleetingly affected. Finally, balance sheets are affected temporarily if at all. In the banking sector, higher mortality shows up in the cross-section as a temporary increase in lending volumes, while business failures show no impact of the recession.
The downturn in employment, however, lasts until March 1919, long after the epidemic was over. The contemporary commentary noted the epidemic’s effect on labor supply but also highlighted a factor that is not immediately apparent in the time series, namely the period of uncertainty that followed the end of the war. The next section will focus on separating the impact of the pandemic from that of the peace, using cross-sectional data.
Industrial Production
Industrial production, a classic measure of economic activity, is plotted in Figure 5. The drop from July 1918 to January 1919 is about 20 percent, but it is hardly unusual: similar drops occurred in 1916 and 1917. The contraction of 1920 is much more severe and prolonged: the trough is reached 14 months later and the peak-to-trough reduction is by half. These two features observed by Burns and Mitchell (short and mild recession in 1918/19, long and deep recession in 1920/21), reappear over and over again in the next graphs.
INDEX OF INDUSTRIAL PRODUCTION, MONTHLY. YELLOW BANDS MARK THE NBER-DATED RECESSIONS
Source: Miron and Romer (Reference Miron and Romer1990).

Employment
Data on employment is sparse, particularly at the monthly frequency. The national census of manufacturing was quinquennial from 1899 to 1919 and became biennial in 1921: it thus skipped over the year of the pandemic. A few states had recently begun to collect employment data: New York every month from 1914 and Wisconsin every other month from 1915. The Bureau of Labor Statistics (BLS) began data collection in late 1915, which greatly enlarged “in scope and volume” in the 1920s (Monthly Labor Review 1926, p. 168). All three surveys covered a fixed set of establishments. In contrast, Massachusetts’s annual census of manufacturing collected monthly employment data retrospectively for the past year but covered all establishments. Ohio’s census covered all employers of five or more persons and recorded employment on the 15th of each month. In addition, Ohio’s data covers all industries, while the other series measure employment in manufacturing only.
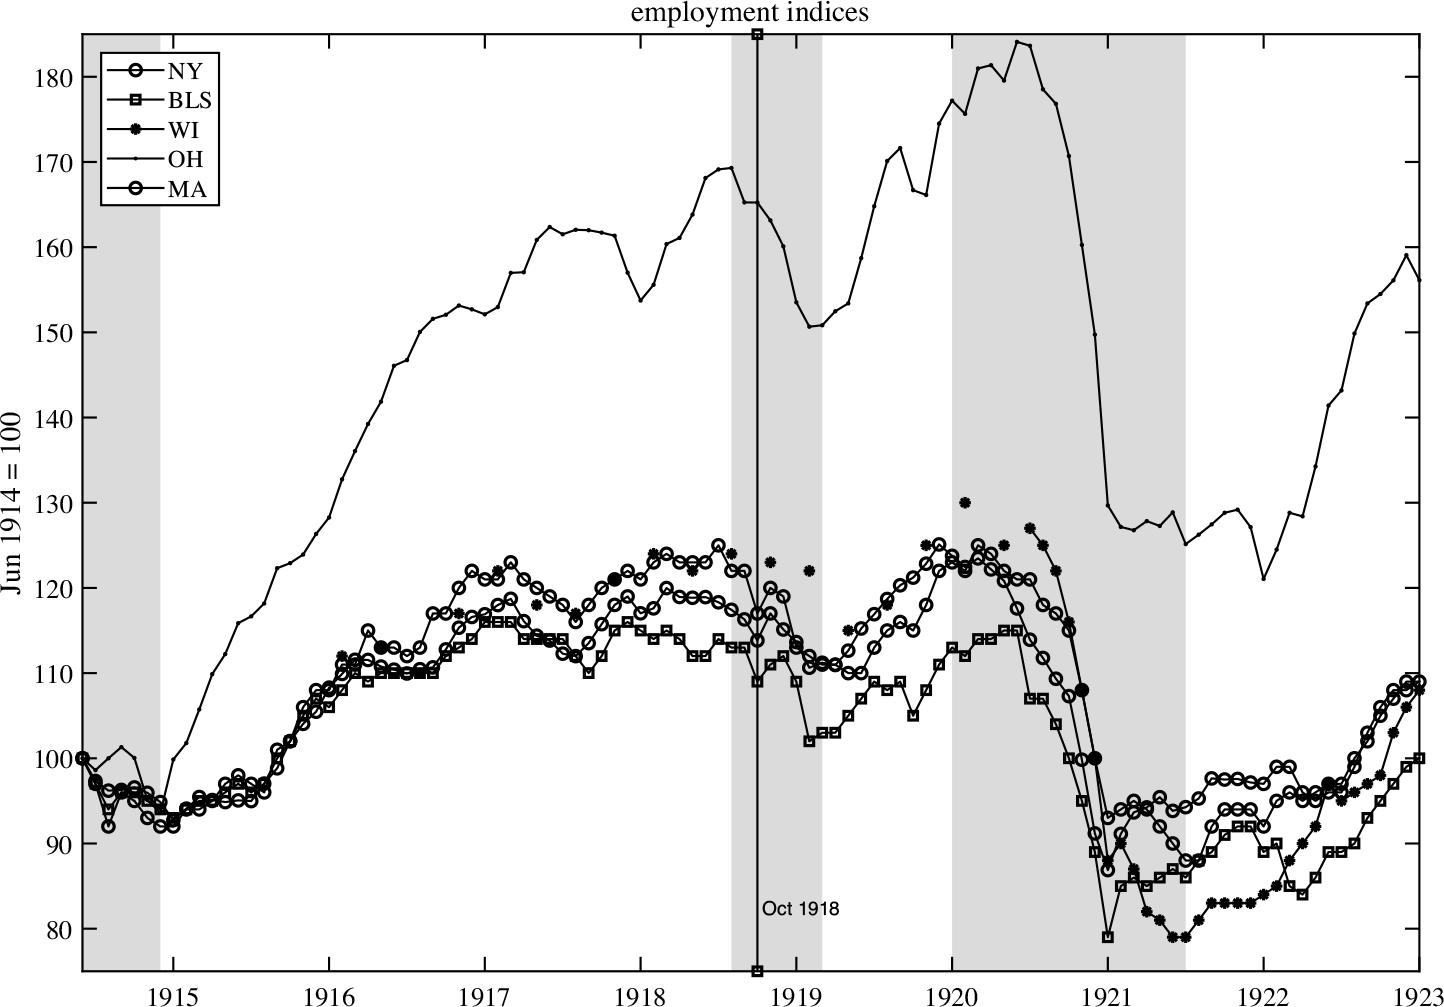
Given the disparities in scope and method, I present all available series in Figure 6. They show broadly similar behavior, in particular, a mild recession in 1918 compared to the severe 1920 recession. From the peak, in summer 1918 New York’s index falls by 15 percent, the BLS by 12 percent, Ohio by 11 percent, Massachusetts and Wisconsin by 7 percent. All indices then recover over the course of 12 months and regain their previous levels by December 1919 at the latest; Massachusetts and Ohio by August 1919. By contrast, the fall in 1920/21 is substantially worse for all indices (30 to 40 percent), levels remain depressed for longer, and the ensuing recovery only begins in early 1922 although once it starts it is extremely rapid.

Interestingly, three indices show a 2 to 4 percent drop for October 1918, quickly reversed, followed by a steeper drop starting in November. One might overlook this as a data quirk, were it not for the contemporary testimony (see Online Appendix 2).
Retail
The volume of retail trade is documented by Copeland (Reference Copeland1929), based on two mail-order stores (Sears, Roebuck and Company and Montgomery Ward and Company), two five-and-ten-cent store chains (Woolworth and Kresge), one grocery chain in the New York Fed’s district, one drug chain (Liggett and Co), one dry-goods and clothing chain (JCPenney and Co), and five department stores all near New York City.Footnote 5 He concedes the “scarcity and peculiar nature” of the data prior to 1919 and that it represents probably less than 3 percent of total retail sales. It is particularly limited in geographic scope, and as it happens New York City was the one major city to eschew the use of business closings, relying instead on quarantines, isolation, tracking of infections, and an education campaign (Aimone Reference Aimone2010). This, however, only affects the grocery and department store index.
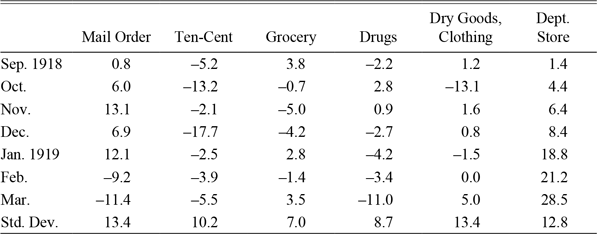
Table 1 shows the movements in the seasonally adjusted volume indices relative to August 1918. Perhaps not surprisingly the drugstore did well in October and November, as did the mail-order chains, an early version of the “Amazon effect”; and both suffered in early 1919 as the epidemic waned. Dry goods and ten-cent stores and groceries suffered during the epidemic, again as one might expect, but bounced back more or less quickly. That said, the variations during the 1918/19 recession are hard to distinguish from the general noisiness of the series (see the last row), whereas the 1920 recession is much more noticeable (the overall index dropped 20 percent).
PERCENT CHANGE IN RETAIL INDICES IN SELECTED MONTHS RELATIVE TO AUGUST 1918, AND STANDARD DEVIATION OF MONTHLY CHANGE (1915–1921)

Source: Copeland (Reference Copeland1929).
The brevity of the epidemic’s impact on retail trade is confirmed by reports from the Federal Reserve Bank of Philadelphia, according to which sales fell by 30 to 50 percent in October and customers by one-third, but in November “retail trade improved wonderfully” and by December “retail trade was exceptionally good.” Likewise, the New York Fed reported a “very excessive slackening in business during October. Following the signing of the armistice, retail sales increased decidedly in nearly all lines, due partly to the decrease of influenza, but principally to the relaxation of the rigid economies practiced during the war. The result was a holiday trade of record proportions” (Federal Reserve Board 1919b, pp. 375, 423–24).
Payment Volumes
A favorite series of early statisticians trying to measure the business cycle (Persons Reference Persons1919; Rorty Reference Rorty1923) was the volume of bank clearings reported by various cities’ clearinghouses. This seems like a good reason to glance at it in the aggregate, although I will return to it in the cross-section. Typically New York’s clearings, which reflected settlements of stock market transactions, were excluded for business cycle purposes. Admittedly the variable is not a clean gauge of economic activity. Miron and Romer (Reference Miron and Romer1990) do not use them to measure production because they are neither pure quantity nor pure price. They are not necessarily monotonically related to economic activity. Inasmuch as they measure interbank activity, a rise in volume could well reflect increased lending to distressed households and businesses, and increased withdrawals by banks from their correspondents.Footnote 6
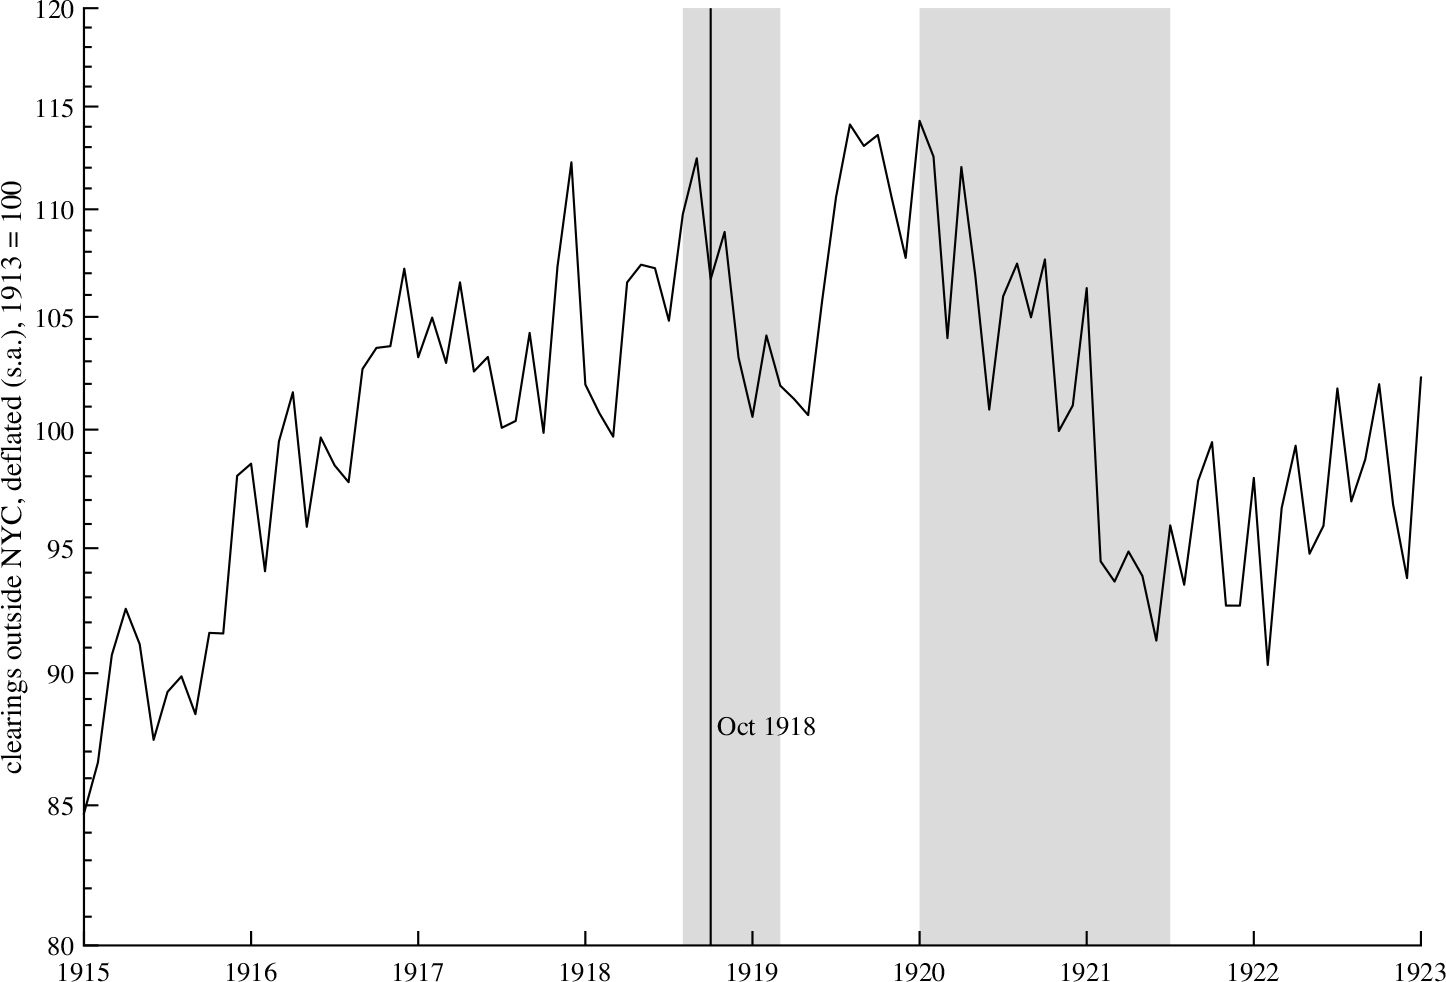
Nominal clearings in fact increase during the epidemic proper, then decline about 10 percent from December 1918 and rise after the trough in March 1919. The size of the fall in deflated clearings (shown in Figure 7) over the course of the recession is about the same magnitude (10 percent) but the timing is a little different because of the lifting of wartime price controls in February 1919. Note again that the contraction during the 1920/21 recession is about twice as large.
NOMINAL AND DEFLATED BANK CLEARINGS OUTSIDE NEW YORK CITY (MONTHLY, S.A.)
Sources: NBER macrohistory database, series m12014 and m12018ba, from Macaulay (Reference Macaulay1938, A255–A270).

Banking
How did the banking sector react to the epidemic? In particular, did lending expand or contract in response to the economic shock? If lending expanded, did it create a burden of debt that would be carried forward?
Aggregate data for a monthly frequency is not available because of the complexity of U.S. banking regulation and inconsistent reporting. Instead, I use regional variation in the intensity of the epidemic and matching regional data on banks to detect an impact of the epidemic on the financial sector. The annual reports of the Comptroller of the Currency provide total assets and total loans and discounts of national banks (about 40 percent of all bank assets) on call dates, six times a year. The data is available by state and for reserve cities. I use the 30 states and the 37 reserve cities for which excess P&I mortality data is available, and the mortality data is summed into bimonthly series. The sample runs from December 1916 to November 1921 (30 call dates). I use local projections of assets and loans (in logs) on bimonthly mortality, of the following form, with i denoting either region or city:
 $$\Delta \log ({\rm{asset}}{{\rm{s}}_{i,t + h}}) = {\beta _h}{m_{i,t}} + \sum\limits_{k = 1}^4 {{\gamma _k}} \Delta \log ({\rm{asset}}{{\rm{s}}_{i,t - k}}) + {a_i} + {b_t},\,\,h = 0, \ldots 6$$
 $$\Delta \log ({\rm{loan}}{{\rm{s}}_{i,t + h}}) = {\beta _h}{m_{i,t}} + \sum\limits_{k = 1}^4 {{\gamma _k}} \Delta \log ({\rm{laon}}{{\rm{s}}_{i,t - k}}) + {a_i} + {b_t},\,\,h = 0, \ldots 6$$
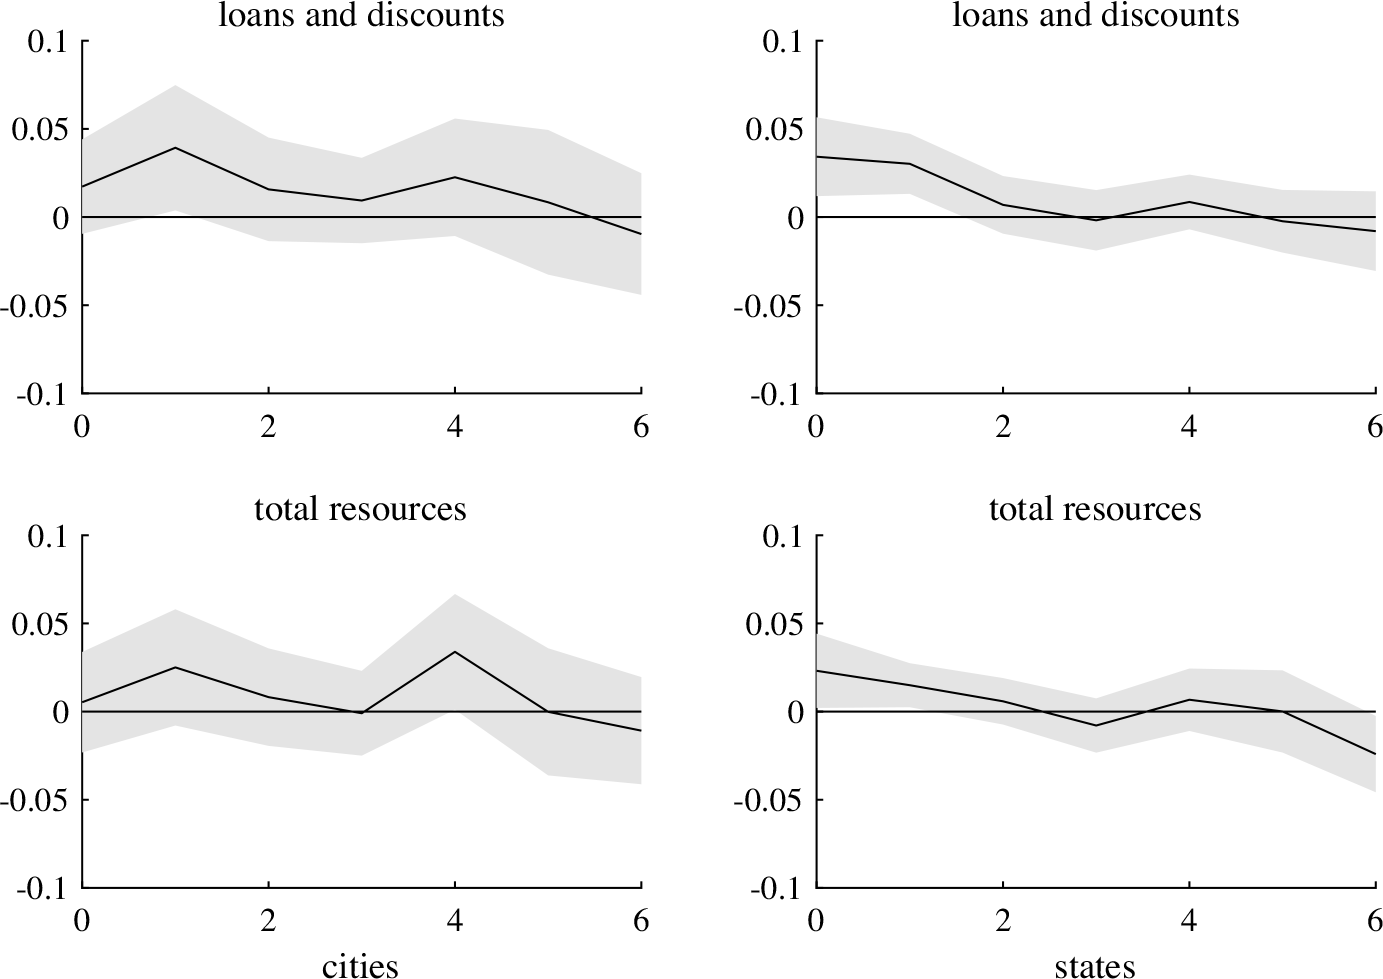
The response of these variables to mortality is shown in Figure 8, scaled by the median city’s shock size. The city-level evidence is somewhat stronger, although these cities are the most important financial centers. They show a rise in loans and total assets after two months, partly reversed after one year. In other words, the financial sector functioned as it should have by providing short-term financing to smooth the transitory shock. There is no evidence of any effect that could carry forward into future years.
IMPULSE RESPONSE FUNCTIONS FROM LOCAL PROJECTIONS OF NATIONAL BANKS’ LOANS AND DISCOUNT AND TOTAL RESOURCES (IN LOGS) ON CITY (RESP. STATE) MORTALITY, WITH 90 PERCENT CONFIDENCE BANDS
Notes: The units of the x-axis are periods of two months (between call dates). The response is to a shock of 0.1 percent mortality (100 deaths per 100,000) in one month.
Source: Author’s calculations.

Business Failures
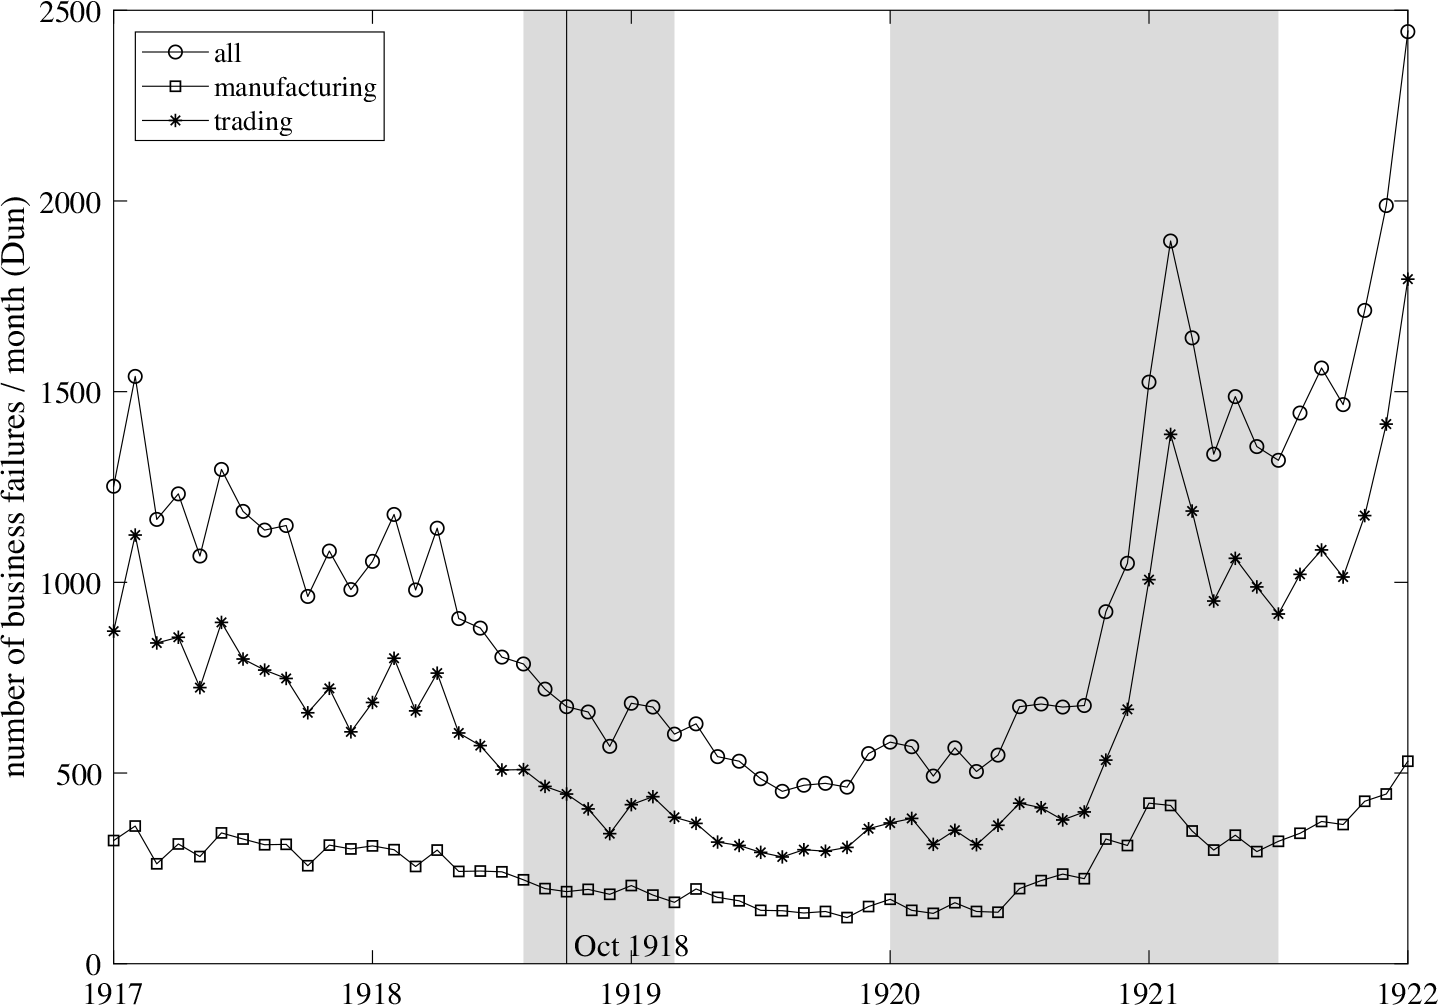
Two credit rating agencies, Dun & Bradstreet (the firms merged in 1933) systematically collected data on business failures, for which Bradstreet required that it involve “some loss to creditors of individuals, firms or corporations engaged in ordinary commercial operations,” (Persons Reference Persons1919, p. 44, who judges it “comprehensive”). Although this excluded professionals, it did not necessarily bias the sample toward large firms: in 1918/19, the average size of assets was around $10,000 in the Bradstreet sample. The data from Dun is shown in Figure 9 (the Bradstreet data is very similar). The most striking aspect of the series is the almost complete absence of a surge in failures during the 1918 recession (note that the data are not seasonally adjusted). In fact, the number of failures goes down steadily. In contrast, the number of failures rises by a factor of four or five during the 1920/21 recession. The detailed statistical analysis in Bodenhorn (Reference Bodenhorn2020) comes to the same conclusion.
NUMBER OF BUSINESS FAILURES FOR ALL COMMERCIAL, MANUFACTURING, AND TRADING, MONTHLY
Sources: Dun, NBER macrohistory database.

Bradstreet’s analysis of the year 1918 (1 February 1919, p. 77) is worth quoting at length because it documents where contemporaries placed the epidemic within the context of all the events affecting the economy:
Failure returns for 1918 reflected unprecedented prosperity of a vast proportion of the country’s inhabitants, due mainly to the stimulus of a highly successful war conducted at a distance, so that few unfavorable effects were to be seen or felt. The results were total business casualties below any thing witnessed for a third of a century, liabilities that compared favorably with any but the best of years, an unprecedentedly small number of banking casualties, and a smaller proportion of failures to those engaged in business than ever before recorded since Bradstreet’s records of Business Mortality were first made up…. There were some unfavorable features met with in the year, notably extremes of cold and heat in winter and summer, a severe drought causing partial failures of corn and cotton, an unprecedentedly fatal epidemic, government interdiction ending in partial paralysis of a number of important industries, notably building, brewing, distilling and automobile manufacturing, and accompanying restriction of all but most essential operations in other lines. On the other hand, there was first and foremost a hothouse stimulation of all lines aiding in war operations, immense demand from government sources for all kinds of materials and products that could be used in war, active employment at high wages for all who could work with their hands, and a vastly enlarged purchasing power of the mass of the people… It is an additionally interesting feature that, notwithstanding the slowing down in business that followed fast upon the signing of the armistice and the interruption to trade at many centers by the influenza, so great was the momentum in business and so profitable had been the previous months’ trade, that the lowest monthly totals of casualties ever recorded were reached in the closing quarter of the year.
The epidemic was just one of many “headwinds” in an eventful year, like extreme weather, drought, and wartime restrictions on production (the “government interdiction”), which a booming economy in the first half-year, stimulated by government demand, enabled firms to face. Even the slowdown caused by the armistice did not dent the “momentum in business.”
Bradstreet’s view of the recession, in particular the sharp but brief downturn in production and the transient impact on retail, is amply confirmed by the reports of the Federal Reserve Banks on the conditions in their districts (Online Appendix 2).
It is worth noting that financial markets also displayed great equanimity during the pandemic. From 14 August 1918, when the influenza’s arrival in the United States is first mentioned in newspapers, to October 18, when nationwide deaths peaked at 20,000 per week, the Dow Jones Industrial rose 9 percent. Only in the second half of November, after the armistice, did it fall back to its summer level where it remained until it started climbing again in late February 1919, to gain 50 percent in nine months. The 1920/21 recession cut the Dow Jones Industrial Average’s (DJIA) value in half.
EPIDEMIC OR ARMISTICE? USING THE CROSS-SECTION
I now investigate the relationship between the epidemic and economic activity, using what cross-sectional data is available at a higher than annual frequency. The frequency constraint means that I can only explore parts of the economy, but the results are nevertheless suggestive.
Data from the coal industry identify two distinct phases in the recession, one related to the epidemic through its impact on labor supply, and the other to the armistice, but show no correlation across regions between the intensity of the epidemic and the post-armistice slowdown. Manufacturing data in two states (New York and Massachusetts) show the same pattern. The epidemic dented employment only briefly, and the cross-sectional variation (admittedly within a small sample) suggests that the post-armistice downturn was an unwinding of wartime activity. Those regions whose employment grew most after the start of the war also saw the greatest reduction after the armistice.
The Coal Industry
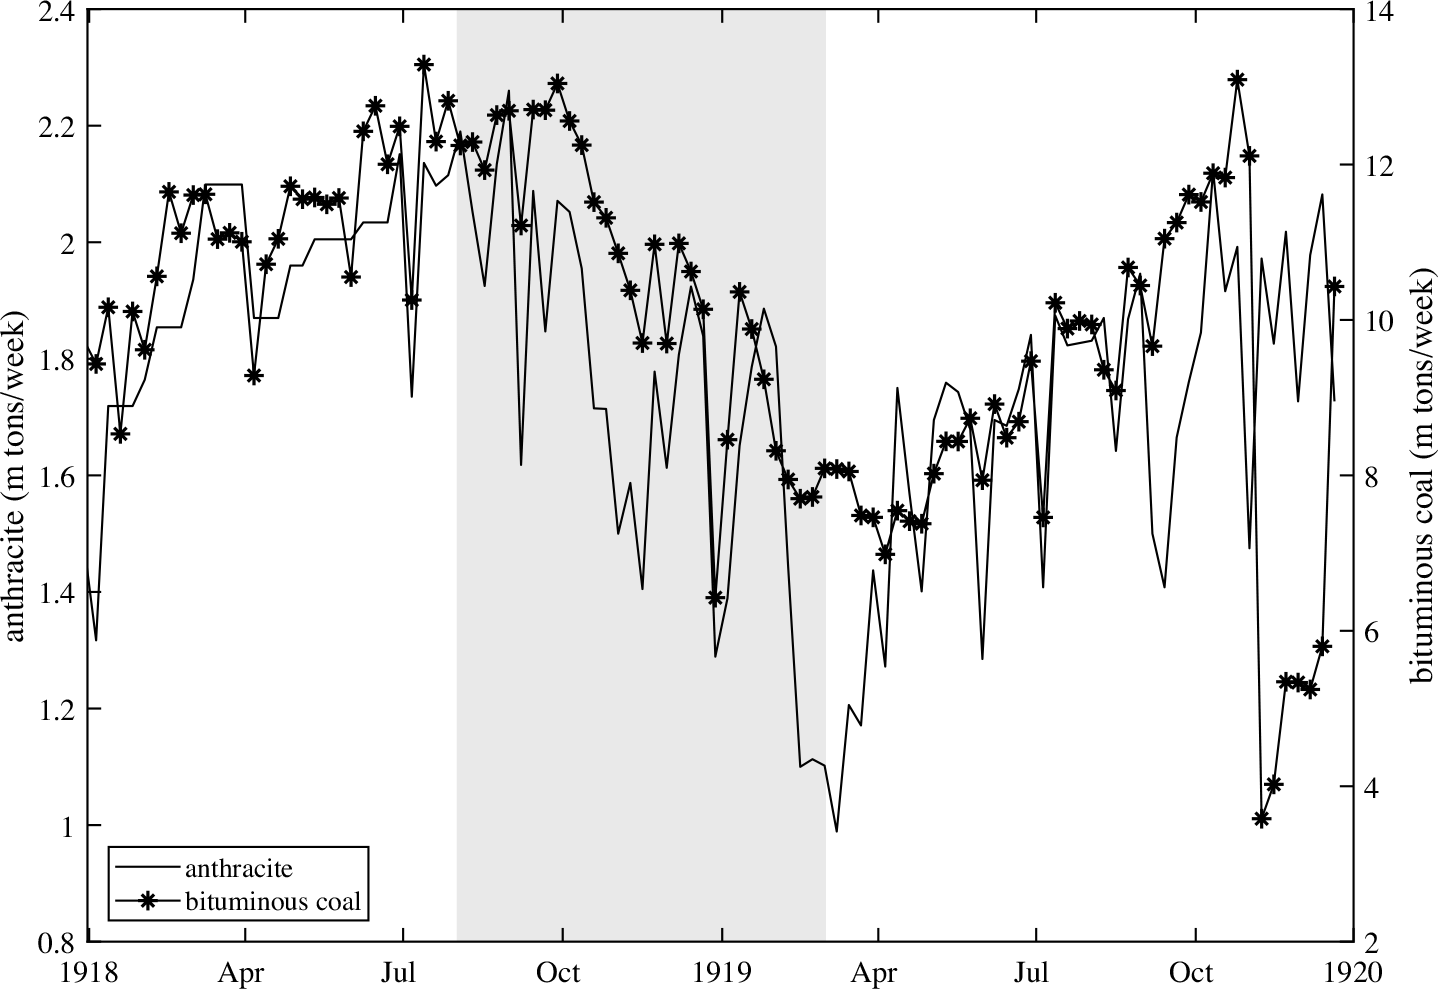
Coal mining is one particular industry, but located throughout the nation and of substantial importance. It employed at the time around 1 m people or 2.5 percent of the labor force. The second-most important component of the Miron-Romer IP index is shipments of anthracite, a form of coal mostly used for domestic heating and principally mined in Pennsylvania. The other major form of coal was bituminous or soft coal, used for industrial purposes and mined throughout the United States. Figure 10 shows weekly production estimates for both types of coal. Production of anthracite peaks in the last week of August and bottoms out 56 percent lower in the first week of March 1919. Bituminous coal peaks in the last week of September and bottoms out 46 percent lower in the first week of April 1919. Both outputs regain their peak levels in early October 1919 just before the onset of strikes and labor disputes.
WEEKLY PRODUCTION OF ANTHRACITE AND BITUMINOUS COAL IN THE UNITED STATES
Sources: Lesher (Reference Lesher1919) and the Coal Trade Journal, various issues.

Contemporaries had no doubt about the cause for the initial drop: the Federal regulator’s report on the industry stated: “The tremendous drop in October [1918] was due almost entirely to the epidemic influenza, which struck the anthracite region with peculiar force, causing numerous instances of community death rates rising to 10 per thousand, and even more, in a single month and reducing the working forces at many mines to less than 50 per cent” (Garfield Reference Garfield1921, p. 245). Trade periodicals such as Coal Age and The Coal and Coal Trade Journal carried numerous reports of the epidemic’s impact on the labor force.
This impact did not last long, however, and the extended fall in production until March 1919 was due to other causes. An analysis in the Coal Trade Journal (5 March 1919, p. 228) saw the “primary causes” as “the sudden cessation of hostilities abroad and the unusually mild winter at home,” while the “chief secondary causes” were “the unpreparedness of the country for peace and the delays incident to the settlement of war contracts and the clarification of the government’s future attitude toward business enterprises of all kinds.” The last comment, an illustration of the sort of disruption that the armistice brought, is an allusion to the federal government relinquishing control over the coal industry. When the United States entered the war a U.S. Fuel Administration was established to manage the production and distribution of national energy sources. Price controls were set and shipments of coal across regions were restricted. In late January 1919, these constraints were removed.
The Coal Trade Annual offered a similar analysis: production declined in November 1918 “owing to decrease in demand following the signing of the armistice and also because of the epidemic of influenza…. The cessation of war activities and warm weather in November and December caused many consumers to begin using storage coal earlier than usual” (1918, p. 3); “stocks accumulated during the fall of 1918 in anticipation of another year of European warfare, in the light of the mild winter of 1918/19 and the reduced industrial activity that came on the heels of the cessation of major hostilities across the seas, proved too large for the country to absorb” (1919, p. 1).
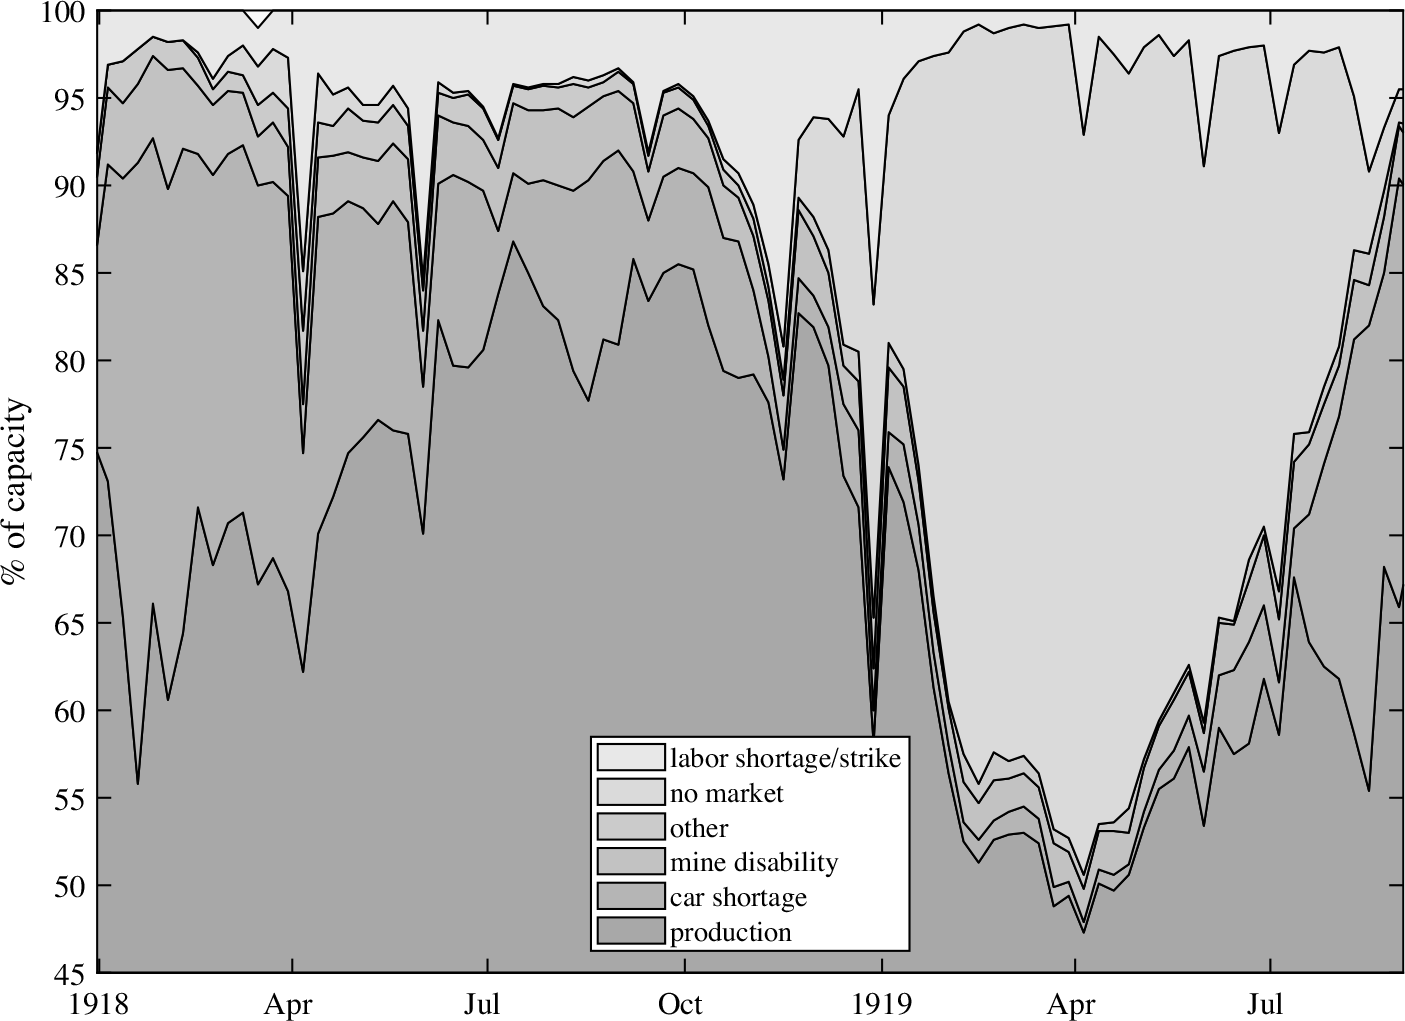
Data on capacity utilization collected by the U.S. Fuel Administration substantiates the claim that other factors took over from the epidemic in the downturn. Every week it published reports by mine operators on their production relative to capacity, and explanations for the shortfall classified as car shortage (transportation), mine disability, labor shortage, strikes, and “no market,” that is, low demand. The reports came from mines representing between 65 and 90 percent of the total national output across the country. The publication reports them aggregated by regions of production, which I aggregate to the state level to match available mortality data.Footnote 7
Figure 11 plots the weekly decomposition of capacity utilization based on these reports, for the country as a whole. Aside from special eventsFootnote 8 the figures show how labor shortages grew sharply in October and peaked in mid-November, and fell back by mid-January to the August level. The continued diminution in mine output was then driven by another factor, “no market,” which grew from November 1918 to April 1919 and then subsided.
CAPACITY UTILIZATION AS REPORTED BY MINES, WEEKLY
Sources: Lesher (Reference Lesher1919) and the Coal Trade Journal, various issues.

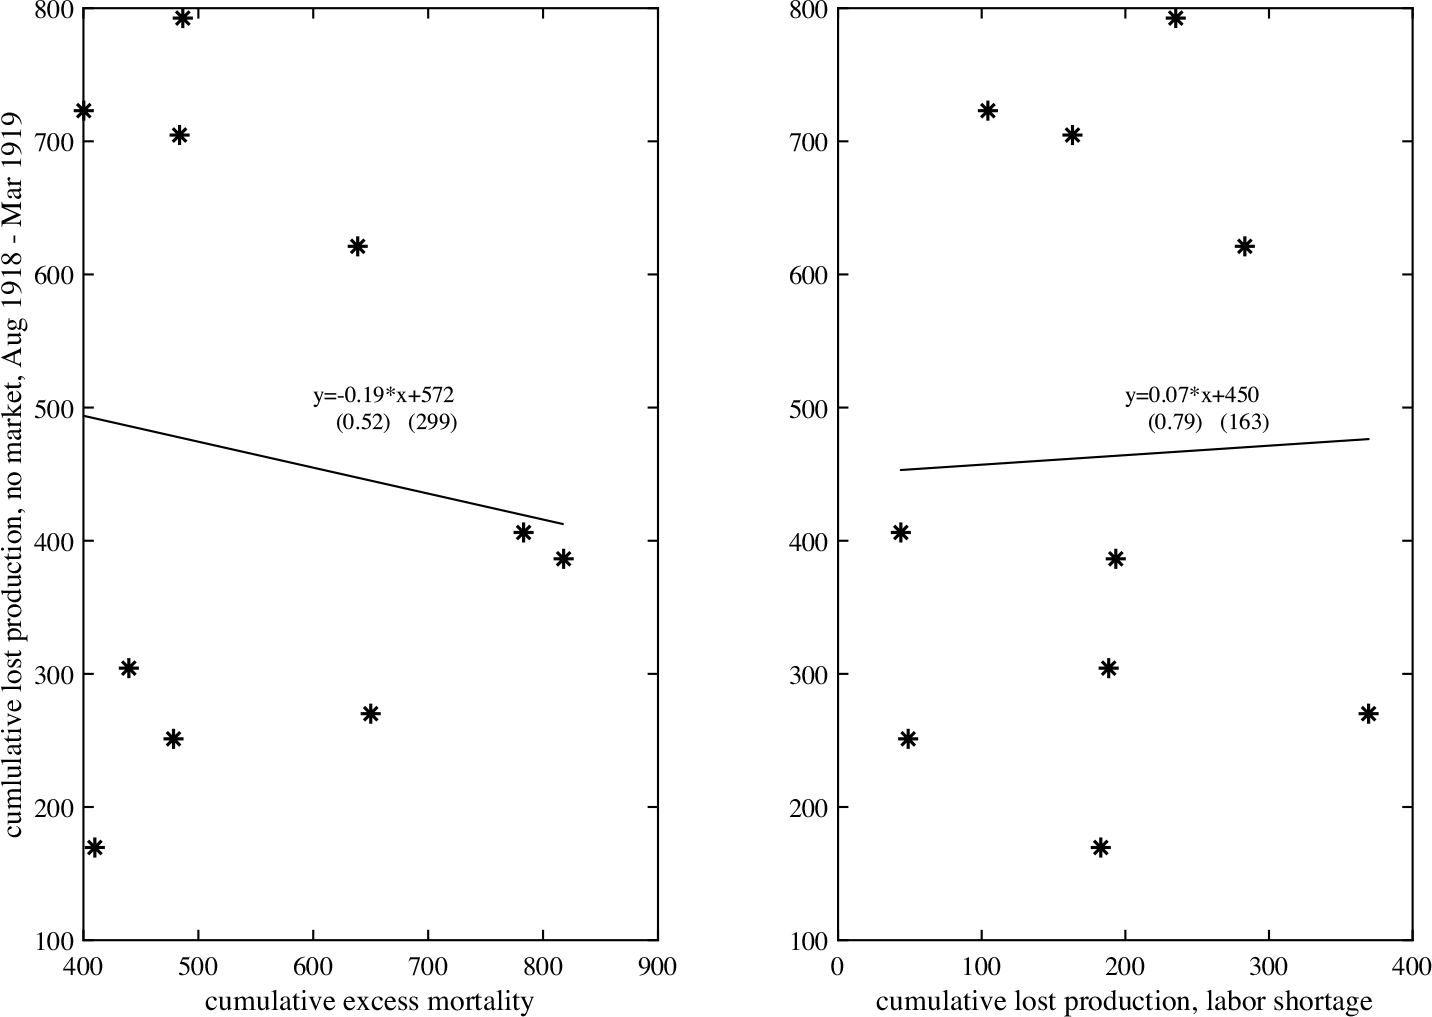
Perhaps the epidemic was a supply shock giving rise (through “labor shortage” and reduced income) to a subsequent fall in demand (“lack of market”): in terms of Figure 11, the top layer begetting the next layer below. The possible mechanism here is the one modeled by Guerrieri et al. (Reference Guerrieri, Lorenzoni, Straub and Werning2020): complementarities across sectors could lead to spillovers from a supply shock to a demand shock. We can use the cross-section to test this possible linkage. Figure 12 shows the relation, or rather the lack thereof, between mortality and the labor shortage it induced on one hand, the ensuing shortfall in production due to lack of demand on the other hand. The two regression lines are not consistent with each other and the slope coefficients are not significant (p-values of 0.37 and 0.47).
RELATION BETWEEN CUMULATIVE EXCESS MORTALITY, RESP. CUMULATIVE LOST PRODUCTION DUE TO LABOR SHORTAGE, AND CUMULATIVE LOST PRODUCTION DUE TO LACK OF MARKET, AUGUST 1918 TO MARCH 1919
Source: Author’s calculations.

In sum, the coal industry was sharply affected by the epidemic but production bounced back quickly. The ensuing slump, assigned by contemporaries to the consequences of the armistice, has no relation in the cross-section with the epidemic and the labor shortfalls it created.
Manufacturing in the State of New York
This section and the next consider monthly manufacturing employment in two states. As mentioned previously, the state of New York’s annual census of manufacturing was based on a fixed sample of establishments, but nevertheless provides regional employment data for seven industrial regions at a monthly frequency.
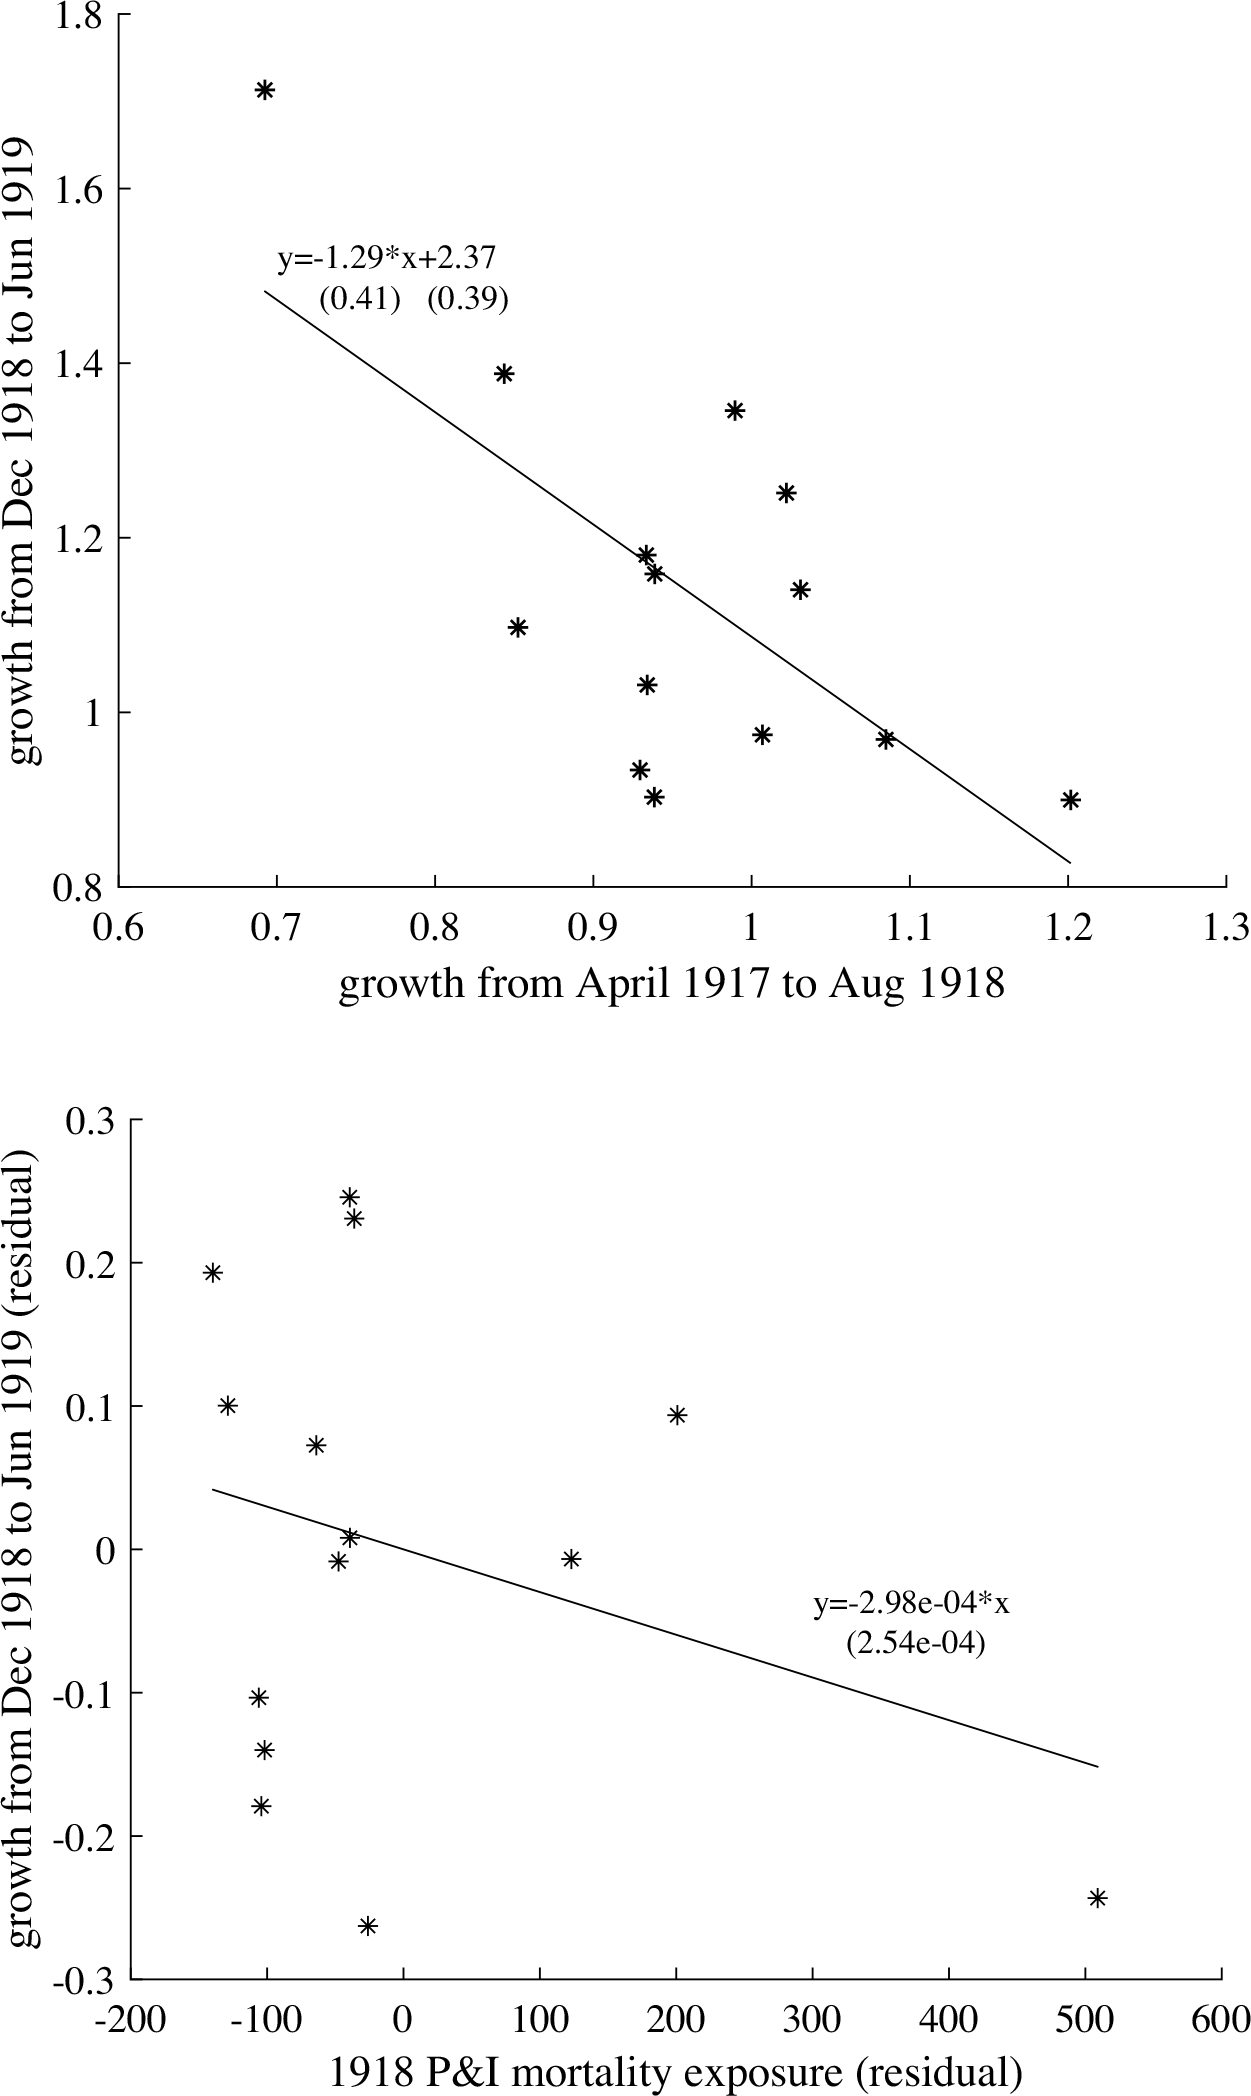
All series show a dip in October 1918, with some variation across industrial regions in the size of the dip from 1.5 percent in Syracuse to 9.4 percent in New York City (the aggregate index for New York State, shown in Figure 6, falls by 4 percent). The correlation of that size with P&I mortality is 0.49. All regions show a bounce-back in the following month of November. What happens next varies by region. The aggregate fall from December 1918 to June 1919 is 8 percent, much less than the 30 percent fall during the 1920/21 recession. The downturn is severe in Buffalo (–20 percent to June 1919) and Utica (–35 percent) but the trough is reached by mid-1919. In Binghamton and Rochester employment actually grows by a few percentage points throughout the 1919 recession. The correlation between growth from December 1918 to June 1919 and growth from the start of the war in April 1917 to September 1918 is –0.86: the regions that grew when the war started were those that shrank when it ended.
Figure 13 confirms this with partial regression plots. First (in the left panel) I regress employment growth after the armistice with employment growth from the start of the war to the epidemic. The relation is very tight, except for Rochester: employment drops after the armistice more than one-for-one. I then regress the residuals on the residual of mortality regressed on 1917/18 employment growth. There remains a significant negative effect of mortality on subsequent employment, but the epidemic only explains a very small fraction of the 1918/19 recession (excluding Rochester, mortality explains 1 percent of the variation).
REGRESSION OF GROWTH FROM DECEMBER 1918 TO JUNE 1919 ON GROWTH FROM APRIL 1917 TO SEPTEMBER 1918, AND RESIDUAL REGRESSION ON P&I MORTALITY RATES, NEW YORK STATE, BY INDUSTRIAL REGION
Sources: New York State Department of Labor (1940, pp. 176–82) for employment; Collins et al. (Reference Collins, Frost, Gover and Sydenstricker1930) for mortality in New York City, Eichel (Reference Eichel1923) for mortality outside of New York City, and New York State Department of Health (1920, vol. 3, p. 44) for estimated population in 1918.

Manufacturing in Massachusetts
I attempt a similar exercise with data from Massachusetts, albeit with less data. The state of Massachusetts also conducted a census of manufacturing; unfortunately, the publication gives monthly numbers by industry, and annual number by city, but not monthly numbers by city. I use city-level mortality statistics by cause for the year 1918 and estimated population in 1915 (Commonwealth of Massachusetts, Office of the Secretary 1920, pp. 190–214) to construct a vector of annual city-level P&I death rates X of length N. From the statistics of manufacturing (Commonwealth of Massachusetts, Bureau of Statistics 1917–1920, 1917, pp. 12–44, tables IB, IE) I find the share of total Massachusetts employment in industry i located in city j, which gives me a matrix (a ij ) (the rows do not add to 1 because the information provided is incomplete). I interpret the product Y = AX as a vector of industry-level exposure to the epidemic. I collect monthly employment data on various industries in Massachusetts (Commonwealth of Massachusetts, Bureau of Statistics 1917–1920, table III) and aggregate to 14 industries using the classification of the U.S. Census of Manufactures for 1914 (Department of Commerce, Bureau of the Census 1917, p. 29).
As in Figure 13, I show partial regression plots in Figure 14. Remarkably, the slope in the left panel is almost identical in Massachusetts to the one obtained using New York data. There is again a negative effect of mortality on employment growth after the armistice but it is driven by one outlier (tobacco) and not significant.
REGRESSION OF GROWTH FROM DECEMBER 1918 TO JUNE 1919 ON GROWTH FROM APRIL 1917 TO SEPTEMBER 1918, AND RESIDUAL REGRESSION ON INDUSTRY EXPOSURE TO P&I MORTALITY, MASSACHUSETTS, BY INDUSTRY
Source: Author’s calculations.

IMPACT OF MORTALITY AND INTERVENTIONS: HIGH-FREQUENCY CITY-LEVEL EVIDENCE
In this section, I use weekly data on mortality (Collins et al. Reference Collins, Frost, Gover and Sydenstricker1930), NPIs (see Online Appendix 1), and economic activity to examine the impact of NPIs on the epidemic itself and on economic activity.
The challenge is to find weekly economic data. The weekly publication Bradstreet’s, A Journal of Trade, Finance, and Public Economy provides me with quantitative data on payment volumes, as well as the ingredients for a qualitative index of business conditions. I conduct two exercises. The first describes the impact of the onset of the epidemic and of closings on business conditions, using local projections. This treats each as a shock, to which the economy’s response is traced out over the ensuing weeks. Payment volumes and trade show some responses, although all effects are limited and transient. I also split the sample between cities that closed early and those that closed late: the response of payment volumes and manufacturing comes mostly from the late movers, while the response of trade comes from the early movers. The contemporaneous response of mortality to closings suggests endogeneity of the latter to the former.
The other exercise formulates and estimates a simple epidemiological-economic model to estimate the responses of mortality and economic conditions conditional on closings and to quantify the impacts. The estimation recovers an impact of closings on the epidemic itself and suggests a way to understand why the closings were relatively costless.
Mortality, Closings, and Business Conditions
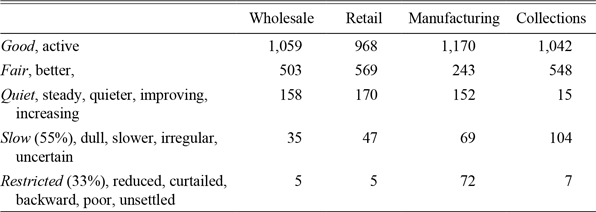
The weekly Bradstreet’s reported bank clearings, that is, the volumes of net clearings through the local clearinghouses on a weekly basis. It also included a “trade at a glance” box at the top right of the front page, which reported on various cities’ business conditions in “wholesale and jobbing trade,” retail, manufacturing and industry, and collections on commercial debt.Footnote 9 Conditions in each city and activity were described by a single adjective, with additional remarks for the city as a whole. I have assigned adjectives to five groups and converted them to scores from 5 to 1, thus assigning a weekly indicator of business conditions between 5 and 1 for each week, city (the list is in Online Appendix 1), and branch of economic activity. The most common adjectives in each group, and the total number of occurrences, are shown in Table 2. The table shows that, between July 1918 and June 1919, business conditions were rarely worse than “quiet.” This is consistent with the results of the previous section about aggregates.
CLASSIFICATION OF ADJECTIVES DESCRIBING BUSINESS CONDITIONS IN BRADSTREET WITH NUMBER OF OCCURRENCES, JULY 1918 TO JUNE 1919. THE MOST COMMON ADJECTIVES IN EACH GROUP IS IN ITALIC AND FOLLOWED BY ITS SHARE IN PARENTHESES

Source: See the text.
To analyze the impact of the epidemic and interventions on the economy, I use the following variables. The first, taken from Markel et al. (Reference Markel, Lipman, Alexander Navarro, Alexandra Sloan, Michalsen and Cetron2007) is an indicator of the week in which the city’s P&I mortality first reached a threshold level defined as twice the baseline level for that week of the year. This is meant to represent the onset of the epidemic. The second is an indicator of the week in which theater and other closings were imposed in that city (see Online Appendix 1). I carry out local projections of mortality, log of bank clearings excluding New York (Cl), and the indices of business conditions defined in the previous paragraph (BC) on these two shocks. Specifically:
 $${\rm{mor}}{{\rm{t}}_{i,t + h}} = {\beta _h}S_{i,t}^j + {a_i} + {b_t},h = 0, \ldots 16,\;\;\;\;j = 1,2$$
 $$B{C_{i,t + h}} = {\beta _h}S_{i,t}^j + \mathop \sum \limits_{k = 1}^8 \,{\gamma _k}B{C_{i,t - k}} + {a_i} + {b_t},h = 0, \ldots 16,\,j = 1,2$$
 $${\rm{log}}\left( {C{l_{i,t + h}}} \right) = {\beta _h}S_{i,t}^j + \mathop \sum \limits_{k = 1}^8 \,{\gamma _k}{\rm{log}}\left( {C{l_{i,t - k}}} \right) + {a_i} + {b_t},$$
 $$h = 0, \ldots 16,\;\;\;\;j = 1,2,\;\;\;\;i \ne {\rm{NYC}}$$
where
 $${\{ S_{i,t}^j\} _{j = 1,2}}$$
is a dummy variable that is zero in all weeks except the one in which (1) the mortality threshold was reached, or (2) closings were imposed.
Figure 15 shows the impulse responses of mortality, clearings, and each index of business conditions to the two shocks. Mortality rises two weeks after the epidemic starts then falls back. It rises in the week in which closings begin, but falls within two weeks: this is of course not because closings cause a contemporaneous increase in mortality, but rather because closings probably respond to that increase.
IMPULSE RESPONSE FUNCTIONS FROM LOCAL PROJECTIONS ON ONETIME SHOCKS: MORTALITY THRESHOLD ON THE LEFT, CLOSINGS ON THE RIGHT (90 PERCENT CONFIDENCE BANDS)
Note: Time units are weeks, mortality is in deaths per 100,000 annualized, indices of business conditions range from 1 (worst) to 5 (best).
Source: Author’s calculations.

The volume of transactions is affected about five weeks after the epidemic shock, and a week after closings by about 5 percent, but not any further. Wholesale and retail show a decline in response to the epidemic, earlier for retail, while the picture for manufacturing is unclear and collections are not affected at all. The impact of closings is clear on wholesale and matches that of clearings, but retail shows no effect and the picture for manufacturing and collection is murky.
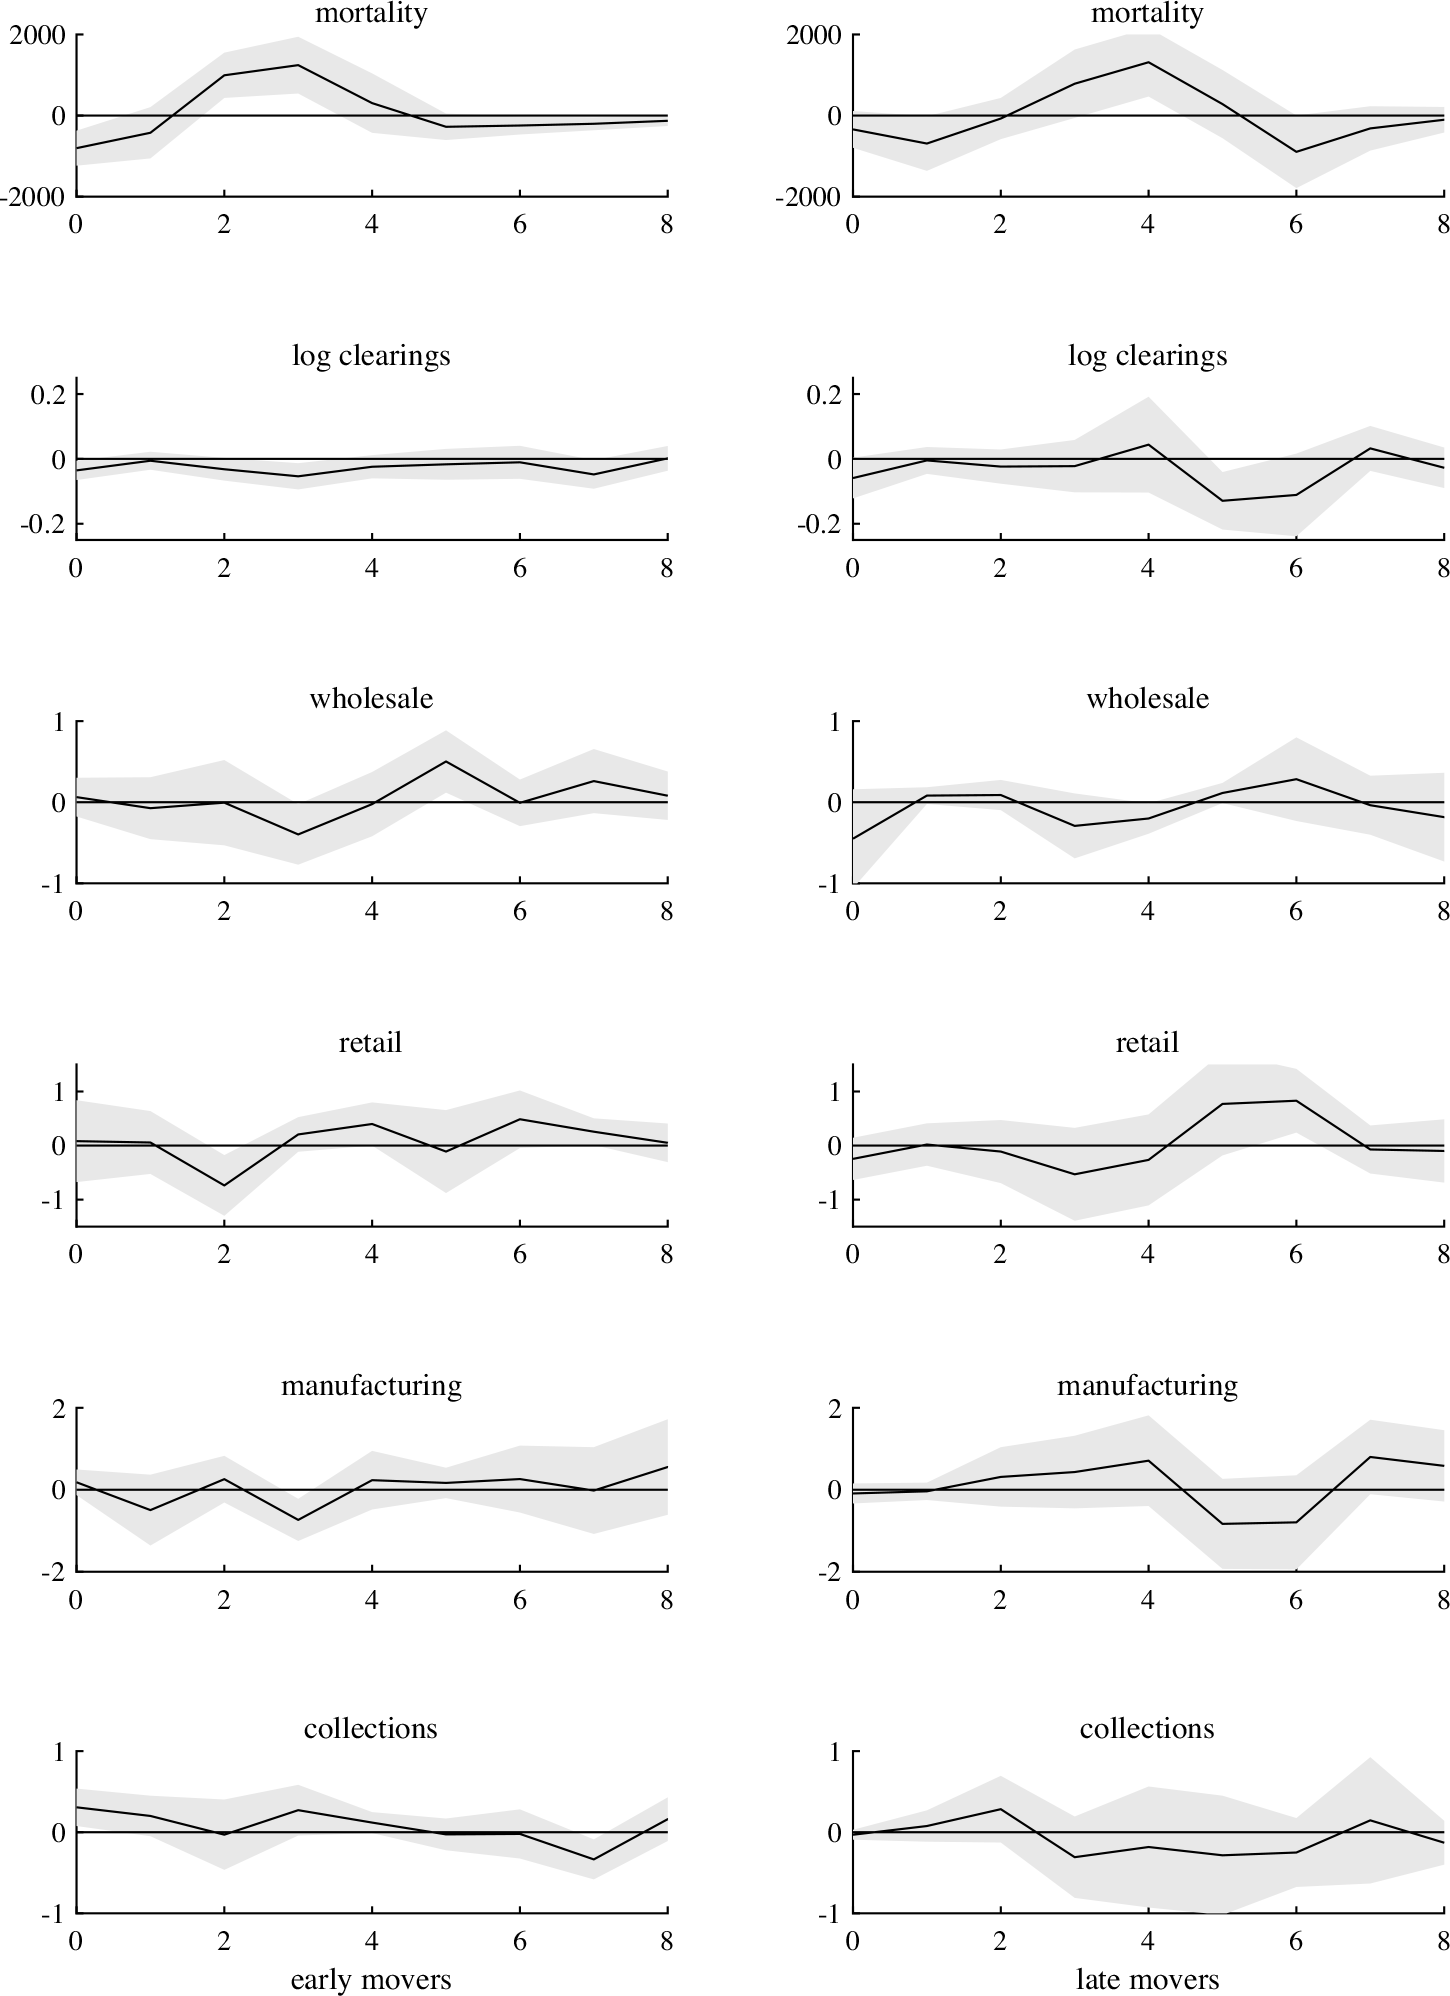
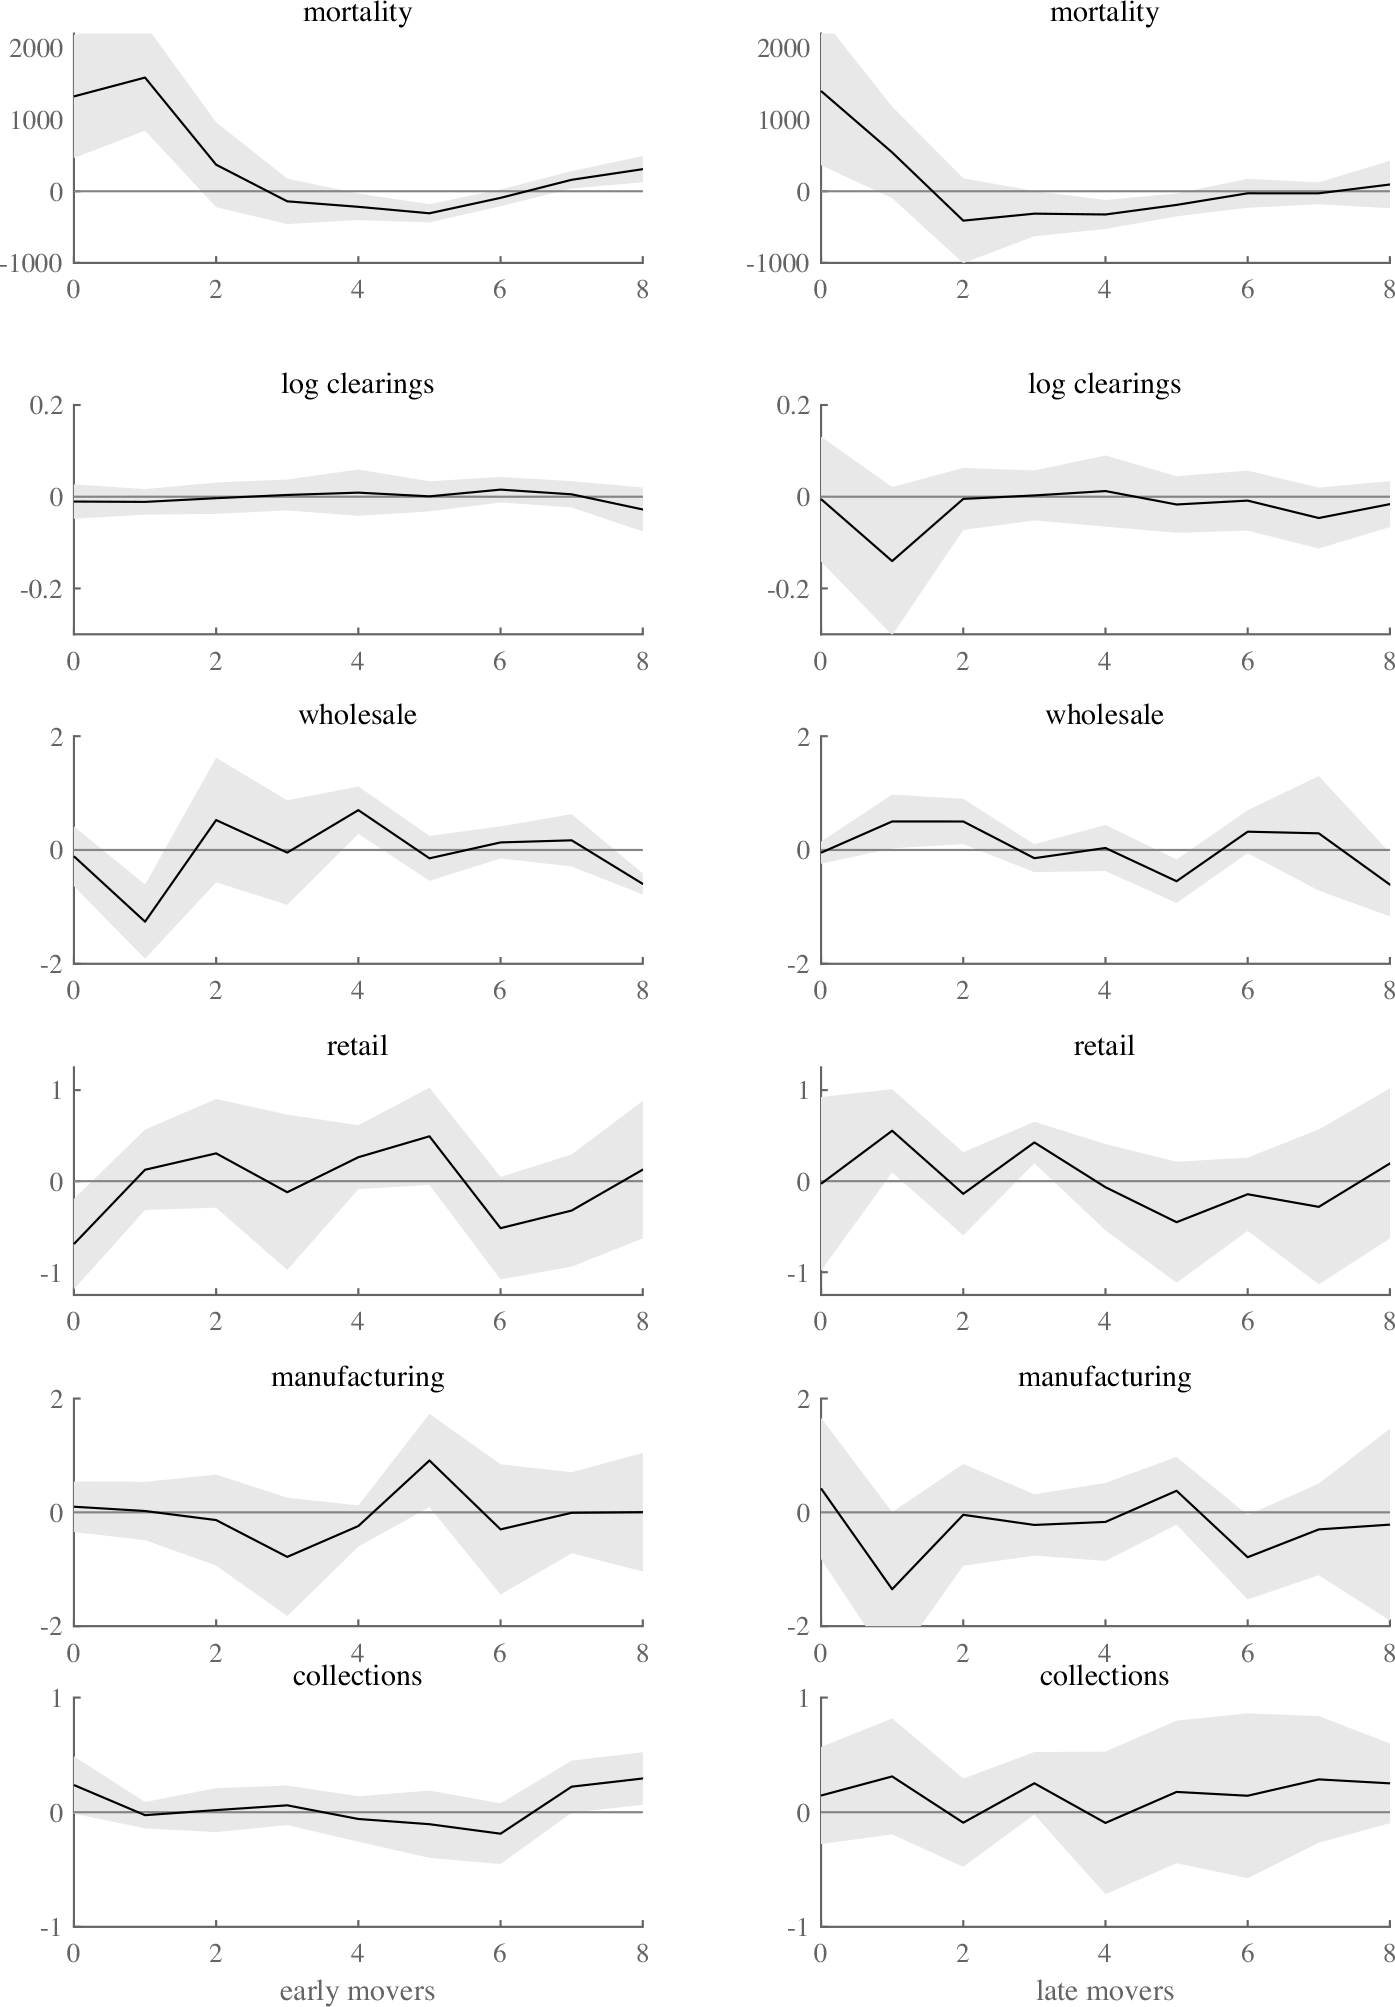
To evaluate the impact of the speed of intervention on economic outcomes, I split the sample of cities depending on the (possibly negative) time elapsed between reaching the threshold of the epidemic, as defined earlier, and the date of closing. Early movers are those for whom that elapsed time is below the median. Figures 16 and 17 compare early movers and late movers, first the response to the onset of the epidemic (Figure 16), then the response to closings (Figure 17).
IRFS FROM LOCAL PROJECTIONS, RESPONSE OF EARLY MOVERS (LEFT) AND LATE MOVERS (RIGHT) TO THE MORTALITY THRESHOLD (90 PERCENT CONFIDENCE BANDS)
Note: Time units are weeks, mortality is in deaths per 100,000 annualized, indices of business conditions range from 1 (worst) to 5 (best).
Source: Author’s calculations.

IRFS FROM LOCAL PROJECTIONS, RESPONSE OF EARLY MOVERS (LEFT) AND LATE MOVERS (RIGHT) TO CLOSINGS (90 PERCENT CONFIDENCE BANDS)
Notes: Time units are weeks, mortality is in deaths per 100,000 annualized, indices of business conditions range from 1 (worst) to 5 (best).
Source: Author’s calculations.

The response of mortality is similar in shape (peaking after three to four weeks) but larger for the early movers, suggesting that moving early or late was endogenous to the epidemic. The response of mortality to closings is also similar in shape but shifted by one week. The early movers suffer another week of high mortality before it comes down, suggesting that closings, per se, did not have a dramatic impact. Clearings do not seem to respond either to the epidemic shock or to the closing shock for early movers. By contrast, late movers have a sizeable contraction in payments five weeks after the epidemic shock and one week after the closing shock: the response that we noticed for the cities as a whole comes entirely from the later movers. The impact on wholesale and retail, on the other hand, is more pronounced for early movers: wholesale and retail decline in the second (resp. third) week of the epidemic, and in the second (resp. first) week of closings. The impact on the wholesale index (a downgrade of 2 on a scale of 1 to 5) is rather sizeable.
The local projection method uncovers sensible responses of mortality to the onset of the epidemic, to closings, and the speed of intervention. Noting as clear-cut emerges for economic variables. Moving early or late did not have an unambiguous impact on activity: the response of transactions and manufacturing to mortality was greater for the late movers, but that of trade greater for the early movers. In any event, the responses were transient, like the epidemic itself.
A Lightly Structural Estimation
The endogeneity of the closings to the epidemic is intuitively obvious, easily documented in contemporary sources, and strongly suggested by the results of the previous section. Dependence of the closings on other pre-determined variables that could be correlated with economic outcomes is also plausible. This creates identification problems when trying to measure the impact of closings on the epidemic and economic activity (Barro Reference Barro2020).
WeFootnote 10 do not tackle endogeneity head-on by modeling the decision to close. Instead, the approach in this section is “lightly” structural: we use to distinguish the dynamics within each regime and see how closings change them.
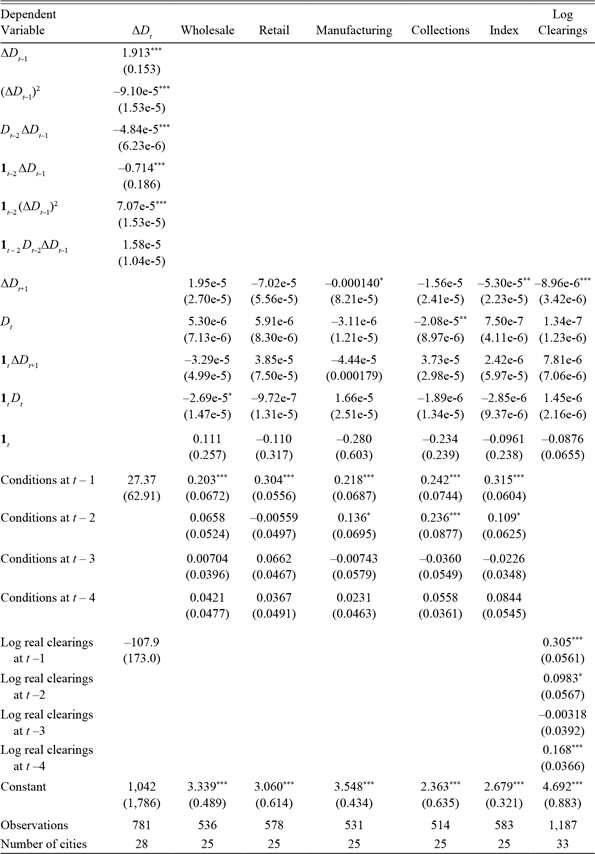
To this effect, we use the SIR (susceptible-infected-recovered) model of epidemiology as adapted by economists (Atkeson Reference Atkeson2020; Alvarez, Argente, and Lippi Reference Alvarez, Argente and Lippi2020; Eichenbaum, Rebelo, and Trabandt Reference Eichenbaum, Rebelo and Trabandt2020). Online Appendix 3 presents a very simple SIR model in which susceptible agents (S) are infected by infected agents (I) at a rate β, infected agents become “recovered” agents (R) at a rate γ, of which a fraction ϕ are in fact deaths. The cumulated deaths are Dt, current mortality is the change in Dt or ΔDt. In addition, economic activity is a linear function of both the number of susceptible and recovered (S + R) and of the infected I, the latter with possibly lower productivity. In the model, NPIs (closings) reduce the productivity of both types of agents, but also change the dynamics of the epidemic by reducing the rate at which susceptible agents are infected. Online Appendix 3 shows how to express mortality and economic activity and as a linear function of future, current, and past mortality, as follows:
 $${\rm{\Delta }}{D_t} = \left( {1 + {\beta _{t - 2}} - \gamma } \right){\rm{\Delta }}{D_{t - 1}} - {{{\beta _{t - 2}}} \over {\phi \gamma }}{\left( {{\rm{\Delta }}{D_{t - 1}}} \right)^2} - {{{\beta _{t - 2}}} \over \phi }{D_{t - 2}}{\rm{\Delta }}{D_{t - 1}}$$
 $${Y_t} = {w_t} - {w_t}{D_t} - \frac{{{w_t}w_t^i}}{{\phi \gamma }}{\Delta }{D_{t + 1}}$$
Equation (1) captures the dynamics of mortality, Equation (2) those of economic activity. The effect of NPIs appears in the time subscript on the infection rate β and the productivities w and wi of healthy and infected. NPIs affect deaths (which is what we measure, rather than infections) with a 2-period lag. Footnote 11 In the equation for activity, the lead of mortality appears as a regressor because the current number of infected It, which affects current output, translates into future mortality ΔDt+1. If the NPI affects infections today, it will affect output today and mortality next period.
The regression results are shown in Table 3. The dynamics of mortality conform well to the SIR model, with coefficients of the right sign and magnitude. Indeed, the values of the SIR model that one can back out are quite reasonable: the case fatality rate is somewhat high at 7 to 8 percent, but the rate at which infected recover per week (γ) is 0.5, in line with contemporary descriptions of the course of the disease (Brundage and Shanks 2008), the rate of infection (β) is about 1.3 to 1.5, yielding a value of R = β/γ ∼ 2.6 to 3.0, consistent with the findings of the modern epidemiological literature. Footnote 12 Closings affect mortality as predicted by reducing the effective R to 1.2–1.7, cutting it in half: a substantial impact but not enough to stop the epidemic.
PANEL REGRESSIONS OF MORTALITY (∆D, Per 100,000), BUSINESS CONDITIONS INDEX, AND LOG BANK CLEARINGS ON LEADS AND LAGS OF MORTALITY AND CUMULATIVE MORTALITY (D) AND A DUMMY 1 c,t = 1 IF BUSINESSES WERE CLOSED DURING WEEK t

Notes: Time and city fixed effects included; robust standard errors in parentheses. ∗∗∗ p < 0.01, ∗∗ p < 0.05, ∗ p < 0.1.
Source: See the text.
The regressions of economic outcomes are shown with and without lags, for the individual components (wholesale, retail, manufacturing, and collections) and for an unweighted index of the four components.Footnote 13 Looking at the right-most pairs of columns (unweighted index and bank clearings), we see that future mortality, which is a proxy of current infections, clearly affects current activity negatively: through the lens of the model, this means that the productivity of the infected is lower than the susceptible, because they either work less or not at all, as we saw in the coal mining data. From this coefficient, the constant, and the coefficients of the mortality equation one can back out a loss of productivity of the infected of 60 percent (using the business conditions equation), which seems plausible given the evidence on the labor supply effect of the epidemic. NPIs attenuate that channel, that is, reduce the coefficient on ∆D t+1 but the effect is not well estimated: for the index of business conditions, the point estimate of the effect is about 5 percent. Likewise, the direct effect of NPIs on economic activity, which should be picked up by the closings dummy 1 c,t , is of the right sign but small and insignificant, although taken at face value the point estimate on both clearings and business conditions would suggest an intensity of lockdown of about 5 percent.Footnote 14 The coefficients on the current cumulative mortality are not significant and of the wrong sign, suggesting that the (permanent) loss of workers is not the main channel through which activity is affected. Looking at the individual indices, the coefficients for wholesale are of the wrong sign but lose significance in the presence of lags. Most of the effects found for the aggregate index seem to come from manufacturing, which is strongly affected by current infections, and for which closings bring some mitigation (on the order of 10 percent).
In sum, the short-run dynamics of the epidemic allow us to measure the impact of the closings on the epidemic, which they slow but do not stop. The direct impact of the closings on economic activity is small if it exists, while the indirect impact through a reduction in incapacitated (infected) workers is notable. If we take the point estimates at face value, NPIs were not very costly and were compensated by the mitigation of the negative labor shock. This mitigation, of course, is peculiar to influenza, which affected prime-age workers disproportionately, and might not be expected in other epidemics.
CONCLUSION
A short and mild recession coincided with the 1918 epidemic, and what part can be ascribed to the epidemic lasted only as long as its cause. The recession might have been briefer or even unnoticed without the uncertainty brought by the armistice. This is a stark contrast with the deep and long recession of 1920/21, which looms in every time-series graph of this paper. The recession of 2020 was even shorter, indeed the shortest on the U.S. record at two months. It was not mild: output dropped by 10 percent in two quarters, and it has taken four quarters to return to the level of 2019:Q4.
Clearly, circumstances differ, but which explains the difference in the recessions? Without a proper model, I did not provide confident answers, but in a conclusion there is space for less confident ones.
The course of the epidemics has proven different. In 1918 the first deadly wave of the fall peaked in a matter of weeks and the later winter wave, where it occurred, was much less severe and equally rapid. The epidemiological fundamentals, however, were not that different: with a R0 between two and three and a case fatality rate of around 1 percent, the 1918 flu was similar to Covid-19. Policy responses have been vastly different. NPIs in 1918 were not costly, and the epidemiological literature has shown that they may well have been effective, but they were very mild and may not have been really binding. Supposing that they were effective, they may have picked “low-hanging fruit” by reigning in transmission relatively cheaply.
The restrictions adopted in 2020/21 have been much more stringent, with much larger economic consequences. Although the recovery has been faster than many initially expected, the worldwide shock has been considerable. Health officials in 1918 did not think that doing more than they did was worth the cost. They did not have the SIR model of Kermack and McKendrick (Reference Kermack and McKendrick1927) and did not expect to find a vaccine (though they tried), a prospect that can have a large quantitative impact on the optimal lock-down policy (Alvarez, Argente, and Lippi Reference Alvarez, Argente and Lippi2020). They may also have placed different weights on the tradeoff between reining the epidemic and maintaining economic activity, particularly in wartime. Those are questions for future research (with a model).