

1. Introduction
Pension systems follow two primary objectives: consumption smoothing over the life-course and poverty alleviation in retirement (Barr and Diamond, Reference Barr and Diamond2008). In today’s pension systems, earnings-related schemes aim mainly at consumption smoothing by redistributing income over a person’s life-course. Varying mechanisms of transferring consumption from working age to retirement apply depending on the design of the system. For persons with a continuous employment history and decent earnings over the life-course, earnings-related schemes normally grant not only a minimum income, but even adequate replacement of previous income while retired (Chybalski, Reference Chybalski2018). However, in cases of non-standard, intermittent and low-earning careers, accumulated pension rights may not be enough to secure a minimum livelihood at retirement. Minimum pension schemes, which are often residence-based and/or means-tested, then provide pension benefits for obtaining a minimum standard of living after retirement.
Although pension systems are maturing in many countries and thus ever more citizens receive pension income from full working history, old-age poverty remains a challenge and has even increased in many industrialized countries (European Commission, 2018). As a result of recent pension reforms motivated mainly by concerns about the financial sustainability in the face of demographic ageing and austerity, prospective replacement rates are lower than today’s pensioners’ replacement levels. Therefore, adequacy of old-age income has attracted more attention in recent years (OECD, 2013, 2019; European Commission, 2018; Grech, 2015). With this, the question of the role of the level of pension benefits in combatting old-age poverty has become increasingly pressing.
Despite the obvious relevance, there are very few comparative studies on the relationship between mandatory pension system generosity and old-age poverty (Lefèbvre, Reference Lefèbvre2007; Lefèbvre and Pestieau, Reference Lefèbvre and Pestieau2006; Zaidi et al., Reference Zaidi, Grech and Fuchs2006; Hussain and Kangas, Reference Hussain and Kangas2016; Jacques et al., Reference Jacques, Leroux and Stevanovic2018).
In this paper, we seek to address this gap in research by asking, what is the role of public pension benefit generosity in preventing and alleviating old-age poverty? This study provides a comparative empirical assessment of the impact exercised by levels of pension benefits of the public pension schemes and their redistributive elements on the prevalence and depth of old-age poverty in 14 advanced OECD welfare states annually observed in the 1980-2010 period. Certainly, estimating the causal effect of any public policy in a time-series-cross-section (TSCS) setting involves potentially serious endogeneity problems, such as reversal causality, variable omission, and measurement error. Our main remedy for these problems is an instrumental variable approach. In particular, we employ the dependency ratio observed in the 1960-1980 period as an instrument for the pension-generosity measures observed in 1980-2010.
With this empirical study, we contribute to the existing body of literature on pension system effects on old-age poverty in two ways. First, we extend the measurement of pension generosity by including not only the average replacement level of earnings-related schemes, usually calculated for an average employee with a standard employment history. We also consider the level of earnings-related pension benefits for low-earners as well as the level of minimum pensions and their impact on old-age poverty. Some earnings-related pension schemes redistribute incomes on a life-time basis by providing pensions to low-income earners at a higher ratio of their previous earnings (Barr and Diamond, Reference Barr and Diamond2008). Such redistributive elements in the pension system should lead to lower old-age poverty by lifting the lower end of pension incomes up. Furthermore, most countries provide minimum pensions for those who are not eligible for earnings-related pensions or whose earnings-related pensions remain very low. The level of minimum pension benefits is likely to be important for reducing old-age poverty, since many of the retirees living at risk of poverty rely on minimum pension benefits (Jiménez-Martín, Reference Jiménez-Martín2014). Our analysis thus provides more nuanced insights into the relevance of public pension benefits than previous studies.
Second, we apply a more comprehensive measure of old-age poverty by looking at both the poverty rate and the poverty gap of persons aged 65 and over (OECD, 2013; European Commission, 2018). While poverty rate indicates the prevalence of poverty among a given population, the poverty gap indicates the depth of poverty by representing the average distance between the incomes of the poor and the poverty line.
In the next section, we discuss how pension benefits’ level of income replacement relates to old-age poverty in different pension systems. Section three provides a description of our indicators, data and methods of analysis. In section four, we present and discuss our results. Section five concludes.
2. Pension generosity and old-age poverty
2.1 Poverty alleviation as an objective in different pension systems
The ultimate objective of pension systems is to provide income security in old-age. Different pension systems seek to achieve this overall aim through four objectives (Barr and Diamond, Reference Barr and Diamond2008): i) providing a mechanism of consumption smoothing over the life cycle, ii) functioning as insurance against longevity and protecting against the risk of outliving retirement savings, iii) aiming at poverty relief by providing minimum or basic pensions to those with insufficient resources, and iv) providing income redistribution. Pension systems can distribute either vertically (for example, by paying pensions to low earners with a progressive formula) or horizontally (for example, towards families by paying higher pensions to married couples than to single persons) or they can redistribute across generations (for example, by reducing the contribution rate of the present generation) (Barr and Diamond, Reference Barr and Diamond2008).
As pension systems have matured and ever more retirees are entitled to earnings-related pension benefits based on full working careers, pension benefits’ potential to alleviate poverty after retirement has increased and old-age poverty has declined remarkably in past decades (Bonoli, Reference Bonoli2000; Anderson, Reference Anderson, Obinger and Schmidt2019). However, great cross-country variation persists. Old-age poverty remains a challenge, and poverty has even deepened in many advanced welfare states in recent years (European Commission, 2018). Women suffer from old-age poverty more often than men due to lower labour market participation, career breaks during care work and persistent gender wage gaps (Smeeding and Sandström, Reference Smeeding and Sandström2005; Möhring, Reference Möhring2014; Betti et al., Reference Betti, Bettio, Georgiadis and Tinios2015). Given the continuing challenges of old-age poverty, international organisations have placed the adequacy of pensions more prominently on their political agenda lately (European Commission, 2018; OECD, 2013).
Considering the great variety of pension systems, it is reasonable to assume that different pension system properties explain at least some of the cross-country variation and the trends of old-age poverty. Some countries with Beveridgean pension systems aim mainly at poverty reduction by means of universal, often flat-rate and means-tested benefits at comparably low levels. Countries with a Bismarckian social insurance system, in contrast, provide benefits based on contributions and/or insured times during working life and aim mainly at status maintenance (Hinrichs and Lynch, Reference Hinrichs, Lynch, Castles, Leibfried, Lewis, Obinger and Pierson2010; Kuitto and Kuivalainen, Reference Kuitto, Kuivalainen, Ellison and Haux2020). In practice, especially Beveridgean systems are often multi-pillar systems, where public low flat-rate basic pensions are complemented by occupational and private schemes. Bismarckian systems, too, have moved towards multi-pillarization (Ebbinghaus, Reference Ebbinghaus2021). Recent pension reforms have, in general, reduced the generosity of public pensions and put more weight on occupational and private solutions in the pension provision mix (Zaidi et al., Reference Zaidi, Grech and Fuchs2006; Ebbinghaus, Reference Ebbinghaus2011, Reference Ebbinghaus2015; Benítez-Aurioles, Reference Benítez-Aurioles2018; Anderson, Reference Anderson, Obinger and Schmidt2019; Hinrichs, Reference Hinrichs2021). Private pension schemes are less redistributive, low-income workers’ capacities for pension saving are in many cases insufficient, and with retrenchment of public pensions, income inequality and poverty in old-age is likely to be more pronounced in countries where private pension provision obtains a greater role (Been et al., Reference Been, Caminada, Goudsward and van Vliet2017). Multi-pillarization blurs the lines of poverty alleviation and consumption smoothing, yet the role of public pensions, particularly for reducing old-age poverty remains essential. Well-targeted public pensions seem to be associated with less poverty and inequality among the elderly (Smeeding and Williamson, Reference Smeeding and Williamson2001; Ebbinghaus, Reference Ebbinghaus2021).
2.2 Public pensions’ role in old-age income security and poverty alleviation
Pensions make up the largest part of the income of older people and therefore play an important role in combatting poverty in old-age. In the OECD countries, pensions from mandatory public schemes account for 55 percent (considerably more in European countries) and occupational pensions for a further ten percent of older people’s income on average (OECD, 2019). The rest of the income package of retirees consists of private pensions, work income and capital income. Given the high relevance of public pensions in the income package of elderly, the role of public pension generosity for alleviating old-age poverty is particularly interesting.
The relationship of the generosity of public welfare programs and poverty alleviation in general is well established (among others Kenworthy, Reference Kenworthy1999; Brady, Reference Brady2005; Scruggs and Allan, Reference Scruggs and Allan2006). However, there are far fewer studies on the effect of pension benefits, and public pensions – in particular, on old-age poverty. One of the few studies with a cross-country comparative focus, by Jacques et al. (Reference Jacques, Leroux and Stevanovic2018), shows that first-pillar public pension spending is positively, although not linearly, associated with lower prevalence of old-age poverty. Generous public pension schemes seem to be particularly effective in helping older individuals in deeper poverty. On the other hand, in a study of 15 OECD countries in the late 2000s, Hussain and Kangas (Reference Hussain and Kangas2016) find that minimum and earnings-related pension schemes play differing roles in combatting poverty. However, these authors show that the association between these two schemes and old-age poverty varies in relation to the poverty threshold one considers.
Old-age poverty is also related to the overall income inequalities in a country and how pension systems cushion such inequalities (Korpi and Palme, Reference Korpi and Palme1998; Kuitto and Kuivalainen, Reference Kuitto, Kuivalainen, Ellison and Haux2020). Pension systems redistribute intrapersonally over the life-course (consumption smoothing), but multi-pillar systems, in particular, also redistribute interpersonally, equalizing income inequalities in working-age (Korpi and Palme, Reference Korpi and Palme1998; Lynch, Reference Lynch2006). Korpi and Palme have pointed to the ‘paradox of redistribution’: the more benefits are targeted at the poor and the system seeks to create equality via equal public transfers, the less likely the system is to reduce poverty and inequality (Korpi and Palme, Reference Korpi and Palme1998). In the domain of pensions, generous public pensions including also high-income earners crowd out the need for private pensions or other sources of income which tend to be even more unequal than public pensions; and that, in turn, leads to greater equality in old-age income. Pure targeted minimum pension schemes, in contrast, are likely to lead to greater inequalities in old-age income (ibid.).
2.3 Hypotheses
Existing literature on the role of public pensions for combatting old-age poverty thus not only points to the differing importance of earnings-related and minimum pension schemes, but also to the relevance of how redistributive the pension schemes are. In our analysis, focusing on the impact of public pension generosity on old-age poverty, we follow these findings. Furthermore, we consider not only the impact of replacement levels of public pension schemes on prevalence of poverty among persons aged 65 and more (i.e. old-age poverty rate), but also the impact on the depth of poverty among elderly people (i.e. old-age poverty gap).
The hypotheses guiding our empirical analysis about the impact of public pensions’ generosity on these two poverty indicators are based on the assumption that earnings-related schemes, minimum pension and redistributive programs allocate their respective recipients to different positions along national income distributions, i.e. above or below the poverty line or more or less far from it. Accordingly, a variation in the generosity of these pension arrangements involves distinct effects on the old-age poverty rate and gap. On the one hand, a higher level of pension replacement rate can reduce the number of older people at risk of poverty by bringing a certain number of retirees above the poverty line. On the other hand, an increase in pension replacement rate impacts the old-age poverty gap by affecting the income distribution of older people living below the poverty line. This is precisely because this second poverty outcome is calculated as the average per cent difference between the poverty line and the incomes of older people in poverty.
Most retirees in advanced welfare states today receive pensions from earnings-related pension schemes and, hence, enjoy adequate replacement of previous income. Accordingly, the relevance of such schemes for the prevalence of old-age poverty is likely to be high. Generous replacement levels of earnings-related pensions should prevent most of the pensioners with (nearly) standard working careers from falling below the poverty line. Furthermore, if the reduction in the number of pensioners at risk of poverty is accompanied by a significant increase in the income of the retirees receiving earnings-related pension below the poverty line, generous replacement levels of that scheme may also diminish depth of poverty. However, this simultaneous contraction is not necessarily warranted. A consequence of an increase in the replacement rate could be that the old-age poverty gap may even increase. This happens if the denominator of old-age poverty gap is decreased (i.e. a certain number of retirees is no longer at risk of poverty), while the numerator (i.e. the difference between the poverty line and the incomes of older people remained in poverty) is insufficiently diminished:
H1a: The higher the average earnings-related pension replacement rate, the lower the rate of persons over 65 years living at risk of poverty (prevalence).
H1b: The higher the average earnings-related pension replacement rate, the higher the old-age poverty gap (depth).
Minimum pension schemes targeted at poverty alleviation, in turn, are more important for persons with weak labour market attachment and disrupted careers – mainly women, disabled people (in some countries) and immigrants. They are also more relevant in countries relying mainly on encompassing public social pensions (Figari et al., Reference Figari, Matsaganis and Sutherland2013; Ebbinghaus, Reference Ebbinghaus2021). Even though minimum pension schemes’ main aim is to combat old-age poverty, the level of minimum pensions is usually low even compared to the national poverty threshold, and therefore their recipients may be placed quite far from that threshold. Accordingly, we expect their generosity to alleviate living conditions for the poorest of older people, reducing, as a result, the poverty gap, but not necessarily diminishing the prevalence of old-age poverty as such. In other words, the old-age poverty gap should, to some extent, decrease precisely because the income of a certain number of retirees at risk of poverty increases, but that increase may not be sufficient to bring enough pensioners above the poverty line to reduce the old-age poverty rate:
H2a: The level of the average minimum pension replacement rate has no significant effect on the rate of persons over 65 years living at risk of poverty (prevalence).
H2b: The higher the average minimum pension replacement rate, the lower the old-age poverty gap (depth).
Furthermore, both the prevalence and the depth of poverty in old-age may be, in principle, affected by the redistributive features built into the public pension system. Earnings-related schemes may provide persons with lower incomes during working life with relatively more generous pension benefits compared to persons with higher earnings and thus redistribute intrapersonally within a cohort. Therefore, if one assumes that retirees who had low earnings during working life have a higher risk of falling into poverty than retirees who had average earnings, more redistribution of pension benefits should reduce the income distance between pensioners with standard and non-standard working careers and, therefore, both the poverty rate and gap should be reduced:
H3a: The more redistributive the earnings-related pension scheme is with regard to the level of income replacement, the lower the old-age poverty rate (prevalence).
H3b: The more redistributive the earnings-related pension scheme is with regard to the level of income replacement, the lower the old-age poverty gap (depth).
3. Data and method
3.1 Main variables
Outcome variables
In accordance with the arguments developed in the previous section, the risk of poverty in old-age is measured by two different indicators: i) the old-age poverty rate, which captures the proportion of persons aged 65 years and over whose equivalised disposable income is below the poverty line, set at fifty per cent of the median equalized disposable income; and ii) the old-age poverty gap, which instead represents the average percentage difference between the poverty line and the incomes of those in poverty. One important aspect of these two indicators is that they should not necessarily point to the same empirical conclusion: in a certain year, a country may show a low poverty rate, but a high average poverty gap ratio and vice versa. In other words, the prevalence of old-age poverty may be low, but the old-age poverty of those below the poverty line may be deep and vice versa (Osberg and Xu, Reference Osberg and Xu2000; Kuchler and Goebel, Reference Kuchler and Goebel2003).
Currently, a few sources provide comparable statistical information on old-age poverty rate and gap. The most commonly known sources, i.e. the Luxembourg Income Study (LIS) and the European Union Statistics on Income and Living Conditions (EU-SILC), do not provide annual time series for a longer period of time. Therefore, we opted for a third source which constitutes a rational compromise between these two datasets: The Index of Economic Well-Being (IEWB) dataset (Osberg and Sharpe, Reference Osberg and Sharpe2016). By combining the information included in national surveys, LIS and EU-SILC datasets, IEWB dataset provides annual information for these two poverty outcomes for the period 1980-2014 in 14 OECD countries (for more details on these data, see the online appendix, section A, Supplementary Materials).
Over the 1980-2010 period, the old-age poverty rate (11.8%) in the sample is relatively lower than the poverty gap (19.2%). Australia and USA show the highest poverty rate but also a very high poverty gap, making them the poorest countries in terms of old age poverty in the sample. Yet, as previously discussed, low levels of poverty rate do not necessarily correspond with low levels of poverty gap. For example, the Netherlands and Germany have relatively low levels of poverty rate but high levels of poverty gap. This indicates that, within these two countries, there are not many pensioners at risk of poverty but those who fell below the poverty line are relatively much poorer than the rest of pensioners. This pattern is also denoted by the low panel correlation between the old-age poverty rate and gap (0.18). In terms of changes over time, there is a steadily decreasing trend in both the poverty rate and gap, denoting some improvement in the living conditions of retirees during the observed period.
Explanatory variables
We operationalize public pension generosity using data from the Comparative Welfare Entitlements Dataset (CWED2; Scruggs et al., Reference Scruggs, Jahn and Kuitto2018). We use theoretical replacement rates of pension benefits from i) mandatory public earnings-related pension schemes (“standard pensions”, SP) and ii) minimum or social pension schemes (“minimum pensions”, MP). Theoretical replacement rates indicate the level of pension benefits in relation to the level of the same retiree’s in-work earnings (both net of taxes) for a hypothetical “average” worker (cp. Esping-Andersen, Reference Esping-Andersen1990; Scruggs, Reference Scruggs, Siegel and Clasen2007; see also OECD Benefits and Wages indicators).
Our first variable, SP_MID, indicates the level of public earnings-related pensions – i.e. standard pensions for a “typical” or average worker, the Average Production Worker (APW) – as a percentage of the APW wage in each country and year. The second variable, SP_LOW, is the same replacement rate, but for employees with low earnings, thus indicating the level of earnings-related pensions for low income workers. The third variable, MP_MID, in turn, indicates the average level of minimum pensions as a percentage of the APW wage and is used to test hypotheses H2a and H2b. This variable shows the benefit generosity for someone without any earnings-related pension benefits from mandatory pension schemes, receiving the minimum pension according to the country’s minimum old-age income scheme. Fourthly, to measure the redistributive characteristics of the mandatory earnings-related scheme and testing hypotheses H3a and H3b, we calculate the difference between SP_LOW and SP_MID. A value of zero indicates no redistribution, while the redistributive effect grows with positive values of the indicator.
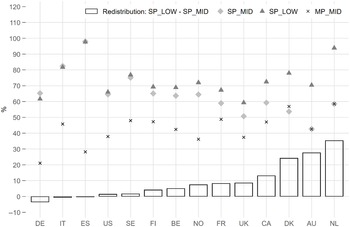
Figure 2 illustrates different replacement levels and redistributive effects of standard and minimum pension schemes in the period 1980-2010. Firstly, there is considerable variation in the level of both average standard (diamonds and triangles) and average minimum (crosses) pension replacement rates across the 14 countries of our study. Average standard pension replacement rates are highest in Spain and Italy and lowest in the United Kingdom and Australia. Minimum pension replacement levels are highest in the Netherlands and in Denmark, and lowest in Germany, where retirees without their own accumulated pension rights were entitled to means-tested social assistance. Secondly, Figure 2 also shows the equalizing effect of earnings-related pension systems. In many countries, there is no or barely any difference in replacement rates for average and low earners (bars). Yet in other countries such as the Netherlands, Denmark and Australia, low earners gain proportionally higher replacement levels. In other words, the pension calculation rules include redistributive elements. Such elements may include ceilings of earnings that are used for pension calculation, tax progression of pension benefits, or flat rate benefits, for example. In terms of redistribution, the pension system seems to be more generous in relative terms in the Netherlands, Australia and Denmark.
Old-age poverty rate and gap for each country, mean 1980-2010
Source: own calculations based on IEWB 2016. Note: the horizontal lines represent the sample means for the poverty rate (solid line, 11.8%) and gap (dash line, 19.2%).

Standard and minimum pension replacement rates for each country, mean of 1980-2010.
Source: our own calculations based on CWED2 Scruggs et al. Reference Scruggs, Jahn and Kuitto2018. Note: SP_MID = standard pensions; SP_LOW = standard pensions for low-income workers; MP_MID = minimum pensions.

3.2 Identification strategy
The compiled dataset comprises 14 OECD countries (namely, Australia, Belgium, Canada, Denmark, Finland, France, Germany, Italy, the Netherlands, Norway, Spain, Sweden, the United Kingdom, and the United States), annually observed in the period 1980-2010. These data allow us to test the hypotheses formulated in section 2 concerning the impact of pension generosity on the old-age poverty rate and gap. However, in testing those hypotheses, potential endogeneity problems must be addressed. As is well-recognised, endogeneity may arise as a consequence of reverse causality, variable omission, and measurement error (Wooldridge, Reference Wooldridge2012).
In our case, reverse causality would arise if old-age poverty affects pension generosity – for example, via pensioners preferences for higher redistribution and voting behaviour. However, it is hard to assume that the share of older people in poverty has the political resources necessary to alter pension benefits for themselves. Generally, distributive conflicts regarding pensions involve current employees and concern the generosity of future schemes (Moene and Wallerstein, Reference Moene and Wallerstein2003).
If reverse causality might not be a source of endogeneity, other potential problems cannot be neglected. That is, variable omission and measurement error may be more serious sources of endogeneity in our analysis. Even if we included a rich set of control variables in our models (see below), omitted variable bias is not necessarily averted. For instance, in addition to pension benefits, a certain percentage of retirees enjoy capital incomes for which data are not available. Furthermore, the risk of measurement errors may exist as well. It has been documented in the literature that aggregate data tend to be affected by this problem (e.g. Chang and Li, Reference Chang and Li2018).
Against this background, we developed a model specification which aims at tackling potential endogeneity from these issues. The first and simplest remedy is including a set of relevant control variables in the model. Namely, we include pension system (survivor pensions expenditure as share of total pension expenditure, public expenditure on pensions as share of GPD, statutory retirement age), labour market (share of over 65 employed, Gini index, GDP per capita, annual growth, average production worker wage), health system (public expenditure on health) and demographic factors (share of women in the elderly older population, dependency ratio, life expectancy) that potentially affect old-age poverty. For further details on these variables see table A.1 in the online appendix section, which provides a description of each indicator and its source (Supplementary Materials).
Regression estimates for poverty rate and gap

Notes: N varies due to gaps in the pension benefit time-series (for further details see the section C in the online appendix). The IV estimates are those obtained using the Lewbel approach (external instrument, the dependency ratio, complemented with an internal heteroskedasticity-based instrument). Each coefficient corresponds to a different regression model. Standard errors in parentheses. For OLS models, we use panel-corrected standard errors (PCSEs, Beck and Catz Reference Beck and Katz1995); for IVs models, we used Heteroskedasticity and Autocorrelation Consistent Standard Errors (HAC se); * p < 0.10, ** p < 0.05, *** p < 0.01.
As is often the case, however, the set of control variables included in the model does not ensure that all important confounding factors are controlled for. Accordingly, the second remedy that we applied is a country and year fixed-effect specification to tackle bias from unobserved variables that do not change across units and over time.
Finally, our third and more reliable remedy for addressing endogeneity is the instrumental variable (IV) approach. As well known, a valid instrument must satisfy two conditions. The first one is instrument relevance, i.e. there should be a strong correlation between the endogenous explanatory variable and the instrument. Secondly, the instrument must not affect the outcome directly, but exclusively via its effect on the endogenous variable, i.e. the exclusion restriction condition (Wooldridge, Reference Wooldridge2012).
We employed the dependency ratio, observed in the 1960-1980 period as an instrument for the pension generosity observed in 1980-2010. The relevance of this IV can be justified assuming that the current level of pension generosity is determined by past socio-demographic conditions. In fact, although public pensions of affluent democracies are financed through the pay-as-you-go system (i.e. pension benefits are paid directly from current workers’ contributions and taxes), most current retirees enjoy pension benefits established by reforms set up several years ago. These reforms established pension benefits that responded mainly to the socio-demographic conditions present at the moment of their formulation (Whiteford and Whitehouse, Reference Whiteford and Whitehouse2006). This means that the dependency ratio observed in the 1960-1980 may have influenced the level of the pension replacement rates observed in the 1980-2010 period. On the other hand, it is hard to posit that the dependency ratio observed in the 1960-1980 may have influenced the old-age poverty observed in the 1980-2010 period. If so, the exclusion restriction condition is satisfied too.
In addition, we complemented and improved our IV estimator following the Lewbel procedure (Lewbel, Reference Lewbel2012; Baum and Schaffer, Reference Baum and Schaffer2012; Baum and Lewbel, Reference Baum and Lewbel2019), which exploits heteroskedastic data to derive a second internal instrument in order to perform an overidentified IV (i.e. models with more instruments than endogenous variables). In the online appendix section we present a series of robustness checks to test the validity of our instruments (Supplementary Materials).
4. Empirical results
In this section, we discuss the results of our TSCS analyses. Table 1 displays the estimated coefficients of our pension generosity indicators on the old-age poverty rate (panel A) and gap (panel B). For each of these two outcomes, we reported the estimates of 24 different regression models. We did this for three different reasons. First, our four explanatory variables were included in each regression model separately to avoid collinearity issues and remain in line with each single hypothesis. Second, although OLS estimates are assumed to be biased, as is common practice they are reported in conjunction with the IV estimates for describing the magnitude and direction of this bias. Third, for each of these models, three different specifications were employed: (i) country fixed effects only; (ii) country and year fixed effects and (iii) country and year fixed effects together with a country-specific time trend.
Regarding old-age poverty rate, the coefficients computed for all four explanatory variables are in almost all cases correctly signed and, in many cases, statistically significant. More precisely, the old-age poverty rate is negatively related to SP_MID, SP_LOW, MP_MID. Therefore, we confirm our first hypothesis, H1a. In this case, results show a consistent reduction of the poverty rate across all pension benefits. However, in contrast to our assumption in H2a, we found that not only the income replacement level of the earnings-related scheme, but also the level of minimum pensions is important in reducing relative old-age poverty, though its effect seems to be smaller than those of the standard pensions. Finally, we cannot confirm our hypothesis regarding the effects of redistribution earnings-related pension schemes on poverty rate (H3a) due to the effect being close to null.
Further, in terms of model specification, we observe that IV estimates are systematically greater in value than OLS ones. This means that OLS coefficients are downward biased. This could be inconsistent with a potential bias due to variable omission. In fact, a candidate for omitted variables is the capital income enjoyed by the elderly. For example, in countries with low public retirement pensions, households are forced to make private provision for their old age. That is, they are forced to devote resources from early adulthood onwards to ensure levels of private savings so that personal capital can be accumulated to secure their old age (Kemeny, Reference Kemeny2005). In this scenario, there could be a negative correlation with pensions as well as poverty and, thus, OLS coefficients would be upwardly biased. Accordingly, the downward bias that occurred in our OLS estimates must necessarily be attributable to measurement error. In fact, it tends to diminish estimates toward zero. And this can happen even if variable omission implies an opposite bias (Becker, Reference Becker2016).
Moreover, the effects size of the standard pension on the poverty rate is not negligible. The IV estimates show on average an effect of -0.28 p.p. for each 1 percent increase in the replacement rate. In terms of policy, for example, with an average increase of 5 percent in the SP_MID replacement rate, we might be able to reduce the poverty rate by 1.4 p.p. Considering that the poverty rate in our sample is around 12 percent, this would imply a 11.6 percent reduction of the average poverty rate.
As mentioned above, a negative and, in some cases, strong relationship between pension levels and old-age poverty rate has also been highlighted by other recent studies. Our findings are, however, not strictly comparable with theirs. This is due, essentially, to the adoption of different econometric techniques, sets of data and variables. For instance, Jacques et al. (Reference Jacques, Leroux and Stevanovic2018) model a non-linear relationship between per capita pension expenditures and the poverty rate among the elderly. Hussain and Kangas (Reference Hussain and Kangas2016), in turn, plot poverty rates with differing thresholds against replacement levels and pension expenditure and compute simple correlation coefficients in order to see to what extent result are sensitive to the adopted poverty threshold.
Another element of incommensurability between these studies and ours is that we also use the old-age poverty gap as an outcome variable. The pertinent results denote a no clear impact. The coefficients estimated for our four explanatory variables show dissimilar and, in a few cases, contrasting signs across the different models. Nonetheless, these coefficients are in all cases associated with relatively large standard errors which in fact do not allow a rejection of the null hypothesis. That is, they are not statistically different from zero and, therefore, it is difficult to draw any conclusions beyond the null effect. Accordingly, we must reject H1b, H2b and H3b.
5. Conclusion
Public pensions make up the major part of incomes of older people in most advanced welfare states, but how do they fare in achieving the most essential goal of pension systems, alleviating old-age poverty? In this study, we examined the effect of income replacement level of public pension benefits and their redistributive features on the prevalence and depth of old-age poverty. The longitudinal comparative analysis of 14 advanced welfare states from 1980-2010 revealed that the generosity of public pensions indeed matters for reducing the share of older people living below the poverty threshold. In accordance with our assumption, a higher level of income replacement of the earnings-related standard pension scheme was related to a lower old-age poverty rate. Furthermore, a high generosity of minimum pension benefits was related to a lower overall old-age poverty rate, too. Although designed to secure old-age income for the least well-off retirees at some determined minimum level in most countries, minimum pensions’ replacement levels were important for reducing the prevalence of old-age poverty in the elderly population as a whole. The income protection and consumption smoothing function of pension systems thus seems to work, and with maturing pension systems granting pension benefits in full for ever more cohorts, the relative position of retirees compared to the working age population has improved over time (see also Ebbinghaus et al., Reference Ebbinghaus, Nelson, Nieuwenhuis and Greve2019).
However, our results also reveal that the generosity of income replacement by pension benefits does not have impact on the depth of old-age poverty. Neither generous standard pensions nor minimum pensions are enough to level out severe poverty of those who face relative poverty. Furthermore, redistributive instruments built into public pension systems do not seem to affect the prevalence or the depth of old-age poverty. Even if pension calculation rules grant low-income workers relatively higher pension accumulation compared to average or high-income workers, this is not enough to even out income inequalities during working careers and their impact on old-age income. Nor does it lift retirees above, or bring those retirees with the lowest pension income closer, to the poverty line. Inequalities in working age incomes throughout the life course are probably the most important factor causing old-age poverty and inequality in retirees’ incomes, and pension systems can only cushion this to a certain extent.
Our analysis has several implications for research and policy in the field of old-age income adequacy. First, we extended the usual assessment of old-age poverty by applying a more comprehensive measure of old-age poverty. In addition to the most common measure of relative poverty, the rate of people over 65 living below the poverty threshold of 50 per cent of median income (prevalence), we also utilized the poverty gap indicator, measuring the average per cent difference between the poverty line and the incomes of those in poverty (depth). Our results stress the need to study old-age poverty from different angles and using different measures. Looking only at the prevalence of relative poverty within a certain population gives a different picture compared to also observing the depth of poverty within this group, and public pension schemes seemingly only impact the prevalence of relative poverty. From the body of literature on retirees’ economic well-being, we also know that objective, aggregate level measures of old-age poverty do not necessarily coincide with subjective perceptions of poverty among the elderly. The relative poverty rate in part tells a different story from self-perceived material deprivation and economic well-being; these being additionally contextual to different societies (Walker, 1980; Palomäki, Reference Palomäki2016). Furthermore, there are several dimensions of deprivation besides income-related relative poverty – and studying different measures of poverty specifically among the elderly population has gained little empirical attention so far (cp. Alkire and Apablaza, Reference Alkire, Apablaza, Atkinson, Guio and Marlier2017).
Second, we applied a more fine-graded measure of pension generosity by including not only average replacement levels, but also replacement levels for low earners. Assessing the generosity of pension benefits for persons whose pension accrual remains limited due to fragmented careers and/or low income becomes ever more important because of the spread of atypical employment (Hinrichs and Jessoula, Reference Hinrichs and Jessoula2012). Comparing replacement levels for (future) retirees with different employment histories gives a more accurate picture of pension systems’ capabilities to grant adequate income in older age. So far, comparative time-series data for different income levels and household types for research purposes is available from the CWED2 dataset, but further data efforts are needed to enable more detailed analysis.
Third, as an important policy implication, the results of our study point to the need to assess economic wellbeing in old-age more holistically. Even comprehensive public pension systems are not capable of lifting retirees from living in relative poverty, and even more importantly, pension generosity does not alleviate the depth of old-age poverty. In many countries, a considerable share of older people has difficulties to make ends meet. In addition to monetary benefits, the livelihood of the most disadvantaged older people is dependent on the provision and cost of social services, health care, housing and consumables. Advanced welfare states differ to the great extent to which they provide their citizens (and older people, in particular) with affordable and/or public care services, health care, medication and housing (Vaalavuo, Reference Vaalavuo2020). This is an important, yet often neglected, dimension of retirees’ economic wellbeing that needs to be discussed in the context of pension adequacy.
Our analysis has some restrictions that also call for further research. First, our poverty measures are based on equivalized household income because we generally lack individual level data. Household composition affects not only the income that our relative poverty measures are based on, but also the means that are available for an individual – thus altering the subjective experience of old-age poverty. Although our analysis is at the macro level, the underlying assumption on the impact of pension benefit generosity is at the individual level, and we cannot clearly distinguish this by using poverty measures based on household level data (see also Alkire and Apablaza, Reference Alkire, Apablaza, Atkinson, Guio and Marlier2017). Second, including only public pension schemes’ generosity in the analysis does not reveal the whole story behind pension provisions’ potential effect on old-age poverty in advanced welfare states. In many countries, occupational and private pensions form important parts of pensioners’ income package and their role has even been strengthened by recent pension system reforms, but they are often more selectively available for retirees and may reinforce existing inequalities over the life course. In the case of private pension saving, the ability to save is strongly dependent on an individual’s ability to save during their working life and can easily be affected by periods of sickness, unemployment or disability (Barr and Diamond, Reference Barr and Diamond2008). The lack of comparative time series data on the generosity and coverage of non-mandatory, non-public pensions calls for more efforts on research and data collection.
Pension reforms of recent years reduce the strength of the poverty alleviation function, since full benefits are linked more strongly with full careers that are supposed to be longer than before. Disadvantages in the labour market, career interruptions and early exit are reproduced in levels of future pensions more distinctively than before (Grech, 2015). Income inequalities in working age are increasing in many countries (Atkinson, Reference Atkinson2015). Old-age poverty is therefore not likely to be on the decline in general, but rather there will be more inequalities among the older population, with specific risk groups such as migrants, the atypically employed and people who cannot continue working in later years to achieve full careers due to disability or sickness (Ebbinghaus, Reference Ebbinghaus2021). Despite possible increases in productivity growth and labour market participation, demographic and economic projections lead us to expect a further need to restrict the growth of public pension spending by adjusting pension systems further to maintain their sustainability (Benítez-Aurioles, Reference Benítez-Aurioles2018). In ageing societies, pension adequacy and old-age poverty remain pressing issues.
Supplementary Materials
To view supplementary material for this article, please visit https://doi.org/10.1017/S0047279421000544
Acknowledgements
We especially thank Olli Kangas, Susan Kuivalainen, Enrico Rettore, Brian Nolan, Christiaan Monden, Davide Azzolini, Claudio Gianesin as well as participants of the INET Oxford Martin School and the FBK-IRVAPP seminars for their valuable comments on earlier versions of this paper. We also thank two anonymous referees who kindly reviewed the earlier version of this manuscript and provided valuable suggestions and comments. All errors remain ours.
Competing Interests
The author(s) declare none.