Introduction
The relationship between alcohol and health in older adults is complex. Epidemiological studies show that both those who abstain and those who are heavy users of alcohol are at increased risk of mortality compared with moderate users (Thun et al., Reference Thun1997). The benefits of reduced mortality and morbidity appear to be related to improved cardiovascular health, with those consuming 1–6 drinks per day having a lower risk than those who either abstain or have a higher level of consumption (Mukamal et al., Reference Mukamal2003). In contrast, for some diseases (e.g. cancer of the mouth, larynx, or liver), there is an increase in mortality with no evidence of a U- or J-shaped function (Thun et al., Reference Thun1997).
The Australian Guidelines recommend that to minimize the risk of harm, adults should consume not more than two standard drinks per day with the risk increasing with increased quantity and frequency of consumption (National Health and Medical Research Council, 2009). The Guidelines no longer have different consumption recommendations for males and females. Older adults are considered to be at potentially greater risk from alcohol due to age-related changes in body composition, such as lower volume of body water and lean body mass (Vestal et al., Reference Vestal, McGuire, Tobin, Andres, Norris and Mezey1977), and the prevalence of concomitant use of medications capable of adverse interactions with alcohol (Aira et al., Reference Aira, Hartikainen and Sulkava2005). Therefore, the Guidelines recommend that older adults should consult a health professional in determining an appropriate level of alcohol consumption.
Falls are a particular cause of morbidity, hospitalization, and healthcare costs among older people. In 2005, fractures cost $17 billion in the USA among the over 50s population, with three quarters of these costs incurred by female patients (Burge et al., Reference Burge, Dawson-Hughes, Solomon, Wong, King and Tosteson2007). With the ageing population, a 50% increase in the number and cost of fractures is expected by 2025 (Burge et al., Reference Burge, Dawson-Hughes, Solomon, Wong, King and Tosteson2007). The use of alcohol appears likely to increase the risk of fatal falls, motor vehicle accidents, and suicide (Sorock et al., Reference Sorock, Chen, Gonzalgo and Baker2006), with one review of factors associated with emergency department visits for falls reporting that alcohol use was documented in almost 11% of patients, and was also associated with falls due to environmental hazards and with repeated falls (Bell et al., Reference Bell, Talbot-Stern and Hennessy2000). However, a prospective study of men aged 65 years and older found that light alcohol use (<14 drinks per week) was associated with lower risk of falling, although a history of problem drinking increased the risk (Cawthon et al., Reference Cawthon2006).
An additional complication is that those who abstain from alcohol may differ in important ways from those who consume alcohol (Naimi et al., Reference Naimi2005). In particular, non-drinkers are likely to have less education and income, to have limited access to healthcare or preventive services and more comorbid conditions including mental health problems, diabetes, and hypertension. This group may also contain former heavy drinkers, who although currently abstinent may have already incurred alcohol-related harm (Jackson et al., Reference Jackson, Broad, Conner and Wells2005; Naimi et al., Reference Naimi2005).
The objective of this study was to conduct secondary analyses of Australian data to compare markers of key health outcomes likely to be sensitive to the use of alcohol (hospital admissions and falls) across various levels of alcohol consumption in a large cohort of older adults and to relate these to current recommended levels of alcohol consumption. Given the potential differences between those who abstain and those who consume alcohol, and the probable within group heterogeneity, the reference group in the analyses will be those who consume less than two standard drinks per day but who do not abstain.
Methods
Sample
The Dynamic Analyses to Optimise Ageing (DYNOPTA) cohort consists of nine pooled longitudinal Australian datasets where key variables were harmonized to allow comparison on benchmark measures (Anstey et al., Reference Anstey2010). Nationally representative samples contributed 65% of the cohort at wave 1, with the remainder drawn from specific cities or areas. At baseline, collected in 1990–2002, there were 50,652 participants with 39,085 (77%) being female: this over representation was due to the inclusion of the female only Australian Longitudinal Study of Women's Health and the greater longevity of women (Anstey et al., Reference Anstey2010). DYNOPTA has an average of 4.4 waves of data with a mean of 9.4 years follow-up (Anstey et al., Reference Anstey2010).
Among the pooled studies, one did not assess alcohol consumption and three others did not include other key variables: these datasets were excluded. The eligible sample was those aged 65 years or above at wave 1 (n = 18,529) who had wave 1 alcohol consumption data (16,785, 91%). Mortality data were obtained from the National Death Index and from reports to the study centers up to 2008. The contributing datasets were: the Australian Longitudinal Study of Ageing (n = 2,064); the Australian Longitudinal Study of Women's Health (n = 11,878); the Australian Diabetes, Obesity and Lifestyle Study (n = 1,745); the Melbourne Longitudinal Studies on Healthy Ageing (n = 751), and the Sydney Older Persons Study (n = 347).
The individual studies each received appropriate institutional ethics approval as did the DYNOPTA project.
Measures
DYNOPTA data include health risk factors such as educational attainment, marital status, smoking status, and alcohol consumption based on estimates of standard (10 g alcohol) drinks from reported average quantity and frequency of use. This method is often used in population studies. Although this may underestimate consumption at the lowest and highest levels of use, a comparison of DYNOPTA alcohol data with national data showed similar proportions of risky/high-risk consumers (Burns et al., Reference Burns, Birrell, Steel, Mitchell and Anstey2012). All the studies used established screening tools to assess depression. As previously described in detail, these were used to create a binary “probable” depression variable (Burns et al., Reference Burns, Butterworth, Windsor, Luszcz, Ross and Anstey2011; Tait et al., Reference Tait, French, Burns and Anstey2012). All the studies asked about ever having a circulatory condition (from subsets of questions on hypertension, stroke, transient ischemic attack, angina, heart attack, thrombosis, other), these were summarized as never or ever having a circulatory condition. All studies asked about ever having a musculoskeletal or connective tissue condition (MSCT) (subsets of arthritis, osteoporosis, gout), these formed a binary variable of never or ever MSCT. The studies also collected data on diabetes, which was coded as never or ever present. The key outcomes were self-reports of admission to hospital (at least overnight) or incurring a fall (defined as “a fall to the ground, not including stumbles or trips”) in the last year. Both outcomes were analyzed as binary variables.
Analyses
We used generalized estimating equation models to assess the relationship for hospital admissions or falls in the last 12 months (Hanley et al., Reference Hanley, Negassa, Edwardes and Forrester2003). We used a logit link in analyzing the correlated data with an unstructured correlation structure as the working matrix. The regression parameters from these models have population-averaged interpretation and permit differences between subpopulations to be examined. The fixed predictors were: gender, age at baseline, education (left school at age ≤14 years vs. >14 years), and the three binary medical conditions: circulatory, MSCT, and diabetes (never vs. ever). The time-varying predictors were: years in study, partner status (not partnered vs. living with a partner), “probable” depression, smoking status (“never,” “former,” or “current” smoker). Alcohol consumption (based on standard drinks per day) using current Australian Guidelines was categorized as “abstinent,” “low-risk” (>0 − ≤2), “long-term risk” (>2 − ≤4), and “short-term risk” (>4) (National Health and Medical Research Council, 2009).
Given the likely gender differences in the effects of alcohol, the analyses were split by gender. The models were built in the sequence: (i) time in study and alcohol, (ii) other demographics and smoking variables, and (iii) medical conditions and depression variables. This process was followed for admissions and falls separately. Outcomes are reported as odds ratios (OR) with 95% confidence intervals (CI). Where alcohol and smoking variables were “missing” because they were not scheduled to be collected in the particular wave, they were replaced using a “last observation carried forward” approach as recommended by Singer and Willett (Singer and Willett, Reference Singer and Willett2003, p. 554). Where data were missing due to participant non-response, there was no substitution.
Results
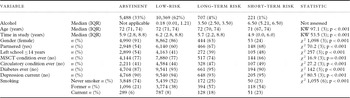
Table 1 shows the basic characteristics of the alcohol consumption groups. The majority was categorized as low-risk consumers (10,369, 62%), with abstinent the next category (5,488, 33%). Among those who used alcohol, the median consumption was 0.36 (inter-quartile range (IQR) 0.01, 1.3) with a maximum of 17 standard drinks per day. Those drinking more than the two standard drinks per day, guideline included 431 (18%) males and 497 (3.5%) females while the abstainers were comprised of 4,990 (35%) women and 498 (20%) men. There were significant differences between alcohol consumption groups on all baseline characteristics. Females were disproportionately represented in the abstinent and low-consumption categories. There was a significant difference in age, with the heavy consumers having the lowest median age. There was also a significant difference in smoking status, with the greatest proportion of never smokers being in the abstinent category.
Characteristics by alcohol consumption group at wave 1, DYNOPTA Study 1991–2008

IQR = inter-quartile range; KW = Kruskal Wallis; SD = standard deviation; MSCT = musculoskeletal or connective tissue condition.
Longitudinal models
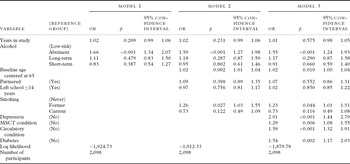
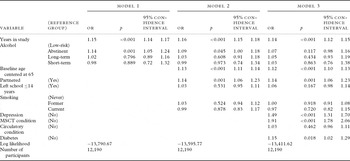
Table 2 shows the results for males in terms of hospital admissions. In all models, the abstinent group had greater odds of admissions than the low-risk drinkers. Increasing age at baseline was also associated with increased odds as were the odds for former compared with never smokers. All of the physical health conditions increased the odds of admission, but depression had the greatest impact (OR = 2.01).
Generalized estimating equations model split by gender: male hospital admissions including time-varying variables

OR and 95% CI rounded to two decimal places.
OR = odds ratios; MSCT = musculoskeletal or connective tissue condition.
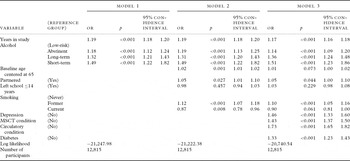
For the female participants, across all the models, each alcohol group had increased odds of admission compared with the low-risk consumers, for example in model 3, the odds for the short-term risk group were increased by 51%. The odds of admission were increased with years in the study (17%–19%), by increased age at baseline (1%–2%), and for women without a partner (Table 3). All the physical health conditions and depression also increased the odds of admission. Although the former smokers had increased odds compared to never smokers, in model 2 there was the paradoxical finding that current smokers had lower odds of admission than never smokers. This effect was not apparent after controlling for health variables (model 3).
Generalized estimating equations model split by gender: female hospital admissions including time-varying variables

Note. OR and 95% CI rounded to two decimal places.
OR = odds ratios; MSCT = musculoskeletal or connective tissue condition.
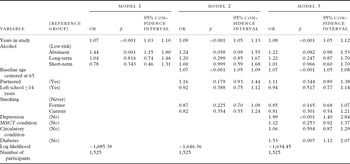
All the models showed increased odds of falls for men with increasing time in the study (about 8% per year). Model 1 shows increased odds of falls for men in the abstinent compared with the low-risk group, but this was not apparent in subsequent models. The odds of falls increased with baseline age, and in model 3 those with depression (OR = 1.99) or diabetes (OR = 1.53) also had increased odds of falls (Table 4). The pattern for women was similar to that shown by men. Increased time in the study (14%–16%) and increased baseline age (12%–13%) elevated the odds of falls as did being without a partner. In model 1, the abstinent group had increased odds compared with the low-risk group. Those with depression (OR = 1.49), MSCT (OR = 1.91), or diabetes (OR = 1.15), all had increased odds of falls in model 3 (Table 5).
Generalized estimating equations model split by gender: male falls including time-varying variables

Note. OR and 95% CI rounded to two decimal places. Australian Diabetes, Obesity and Lifestyle Study did not include falls data.
OR = odds ratios; MSCT = musculoskeletal or connective tissue condition.
Generalized estimating equations model split by gender: female falls including time-varying variables

Note. OR and 95% CI rounded to two decimal places. Australian Diabetes, Obesity and Lifestyle Study did not include falls data.
OR = odds ratios; MSCT = musculoskeletal or connective tissue condition.
Post hoc analyses
A post hoc analysis was conducted of deaths by alcohol and smoking groups. For the smoking groups, the number of deaths was: never smokers 2,349 deaths (25%), former smokers 1,834 (34%), and current smokers 528 (41%). There were 136 (21%) deaths in those missing smoking data at wave 1. In terms of alcohol risk group, the number of deaths was: low-risk 2,652 (26%), abstinent 1,869 (34%), long-term risk 248 (35%), and short-term risk 78 (35%). The patterns were similar for males and females except for male abstainers, where 350 men (70%) died compared with 1,519 (30%) women.
We also conducted a set of sensitivity analyses on the final models for both hospital admissions and falls to assess the impact of not substituting alcohol information, where it was “missing” (i.e. when it had not been asked for in a specific wave). None of the alcohol outcomes changed from significant to non-significant or vice versa when this was done. With respect to hospital use, for women age became positively related to admissions, and current smoking negatively related. With respect to falls, for males time in the study was no longer significantly related to falls.
Discussion
We evaluated the impact of alcohol on hospital admissions and falls in a large population-based dataset with reference to Australian adult guidelines for low-risk levels of drinking. In particular, differences between those drinking within the guidelines (<20 g ethanol per day) and those drinking more than the current guidelines were investigated. Among women, greater odds of admission were found for abstainers and both the higher risk consumption categories; while for men, it was only those who were abstinent that had increased odds. With respect to falls, compared to low-risk users of alcohol, in the unadjusted model, there was evidence that abstainers had greater odds of falls. None of the higher risk alcohol categories had increased odds of falling.
Hospital admissions
To date, there have been few studies that have evaluated the impact of alcohol on the use of health resources by elderly adults (Balsa et al., Reference Balsa, Homer, Fleming and French2008) even though hospitalization rates with alcohol-related diagnoses are similar to those for myocardial infarction (Adams et al., Reference Adams, Yuan, Barboriak and Rimm1993). Nevertheless, nationally representative data from the USA on those aged 65 years and older found that moderate alcohol use was associated with lower hospital admissions and presentations to emergency departments by women, but in men there were neither positive nor negative associations with the use of these services (Balsa et al., Reference Balsa, Homer, Fleming and French2008). Similarly in the current study, low-risk female drinkers were less likely to be admitted than either abstainers or riskier drinkers. However, in our male sample those who were abstinent were more likely to have been admitted to hospital in the last year. In the US sample (Balsa et al., Reference Balsa, Homer, Fleming and French2008), 45% of men were abstainers compared with less than 20% in the current sample, suggesting that the use of alcohol is more normative in Australia with the potential that a greater proportion of the Australian sample are abstaining for other health conditions.
Falls
Cross-sectional data from a community-based study of people aged 65 years and older found that alcohol consumption was inversely related to frequent falls, with abstainers having the greatest prevalence and those consuming more than 14 US drinks per week having the lowest. However, in analyzing the longitudinal patterns, the same study found that the heavy users had increased odds of self-reported falls compared with abstainers, with similar outcomes for abstainers and those consuming less than 14 drinks (Mukamal et al., Reference Mukamal, Mittleman, Longstreth, Newman, Fried and Siscovick2004). More than 14 US standard drinks equate to at least 196 g of ethanol per week, which corresponds to our long-term risk group (140–280 g). Neither the unadjusted model nor adjusted models showed increased risk of falls in this group or the short-term risk group (>280 g/week). Although the OR were in the direction predicted from the US data, there were few participants in these cells, and hence a low power to detect an effect. Nevertheless, the magnitude of the effect was small among women (about a 3% increase) and about 4%–22% for men. Potential explanations for this difference are that in the US study, the effect was only apparent after adjusting for a wide range of variables, they considered incident falls (excluding those with frequent falls at baseline), and the reference group was abstainers rather than low users of alcohol (Mukamal et al., Reference Mukamal, Mittleman, Longstreth, Newman, Fried and Siscovick2004).
The risk of injury due to falls increases with age and is markedly greater in women than men (Stevens and Sogolow, Reference Stevens and Sogolow2005) although men incur fatal falls at a greater rate (Stevens et al., Reference Stevens, Ryan and Kresnow2006). The current study found elevated odds of falls for abstainers compared to low-risk users and with increasing age. However, the magnitude of effects associated with other conditions, especially depression and musculoskeletal and connective tissue conditions, suggests that these might be more effective targets for intervention programs than alcohol use.
As noted earlier, those who abstain from alcohol may differ systematically from those who consume alcohol (Green and Polen, Reference Green and Polen2001; Jackson et al., Reference Jackson, Broad, Conner and Wells2005; Naimi et al., Reference Naimi2005), at least in Western countries where the use of alcohol is prevalent. Abstinence among older adults has been shown to be significantly related to adverse outcomes on measures of activity of daily living (ADL), instrumental activity of daily living (IADL), and with poor cognitive functioning (Lang et al., Reference Lang, Guralnik, Wallace and Melzer2007). Abstinence is also associated with poorer quality of life on measures of general health and physical functioning among older women (Byles et al., Reference Byles, Young, Furuya and Parkinson2006). Further, abstaining is associated with a higher risk of falls resulting in fractures compared with the use of alcohol at least once a week (Coutinho et al., Reference Coutinho, Fletcher, Bloch and Rodrigues2008). As noted above, on both the measures reported here, the abstinent group had poorer outcomes than those who were low users of alcohol.
Implications
The elevated odds of hospital admissions for women who consume alcohol at higher risk levels suggest that targeted interventions for this group are needed. In particular, existing health promotion messages may not be relevant to this population with, at least in the Australian context, a focus on either on young- to middle-aged men and “drinking and driving” or young people and social problems (e.g. fights, embarrassing behavior). With respect to falls, the major risks identified in these data were depression, diabetes and for women, musculoskeletal conditions such as arthritis. In an environment of limited health resources, these may be more appropriate targets for intervention or services than alcohol.
Limitations
First, the study reports on associations, so causality cannot be asserted and associations in observational studies of the effects of alcohol may be especially impacted by uncontrolled confounders (Jackson et al., Reference Jackson, Broad, Conner and Wells2005). Second, the validity of self-reported measures of alcohol use has been questioned (Midanik, Reference Midanik1988), but “objective” biochemical measures have poor sensitivity and specificity, particularly in those without established dependence (Conigrave et al., Reference Conigrave, Saunders and Whitfield1995). Similarly, the hospital admission data were from self-report: it would not be possible to now obtain retrospective permission to link these with administrative health data. Third, in order to combine data from five studies, some important measures had to be dropped that would have provided greater precision, such as assessing eye conditions as a risk factor for falls. Fourth, even with this substantial sample, the cell sizes were small in the higher risk alcohol groups particularly for women and in some smoking categories. This meant that there was low power to detect effects. Five, those in the abstinent category are likely to include some people who were previously heavy drinkers who have ceased drinking for health-related problems or differ on other key factors (Jackson et al., Reference Jackson, Broad, Conner and Wells2005; Naimi et al., Reference Naimi2005). Using the low-risk category as the reference means that comparisons with the higher risk consumption groups are not confounded by this issue. Sixth, we focused on a narrow range of potential adverse outcomes. As noted earlier, for some conditions, notably cancers, there is no evidence of beneficial outcomes with low levels of alcohol consumption (Thun et al., Reference Thun1997). The sample will also be subject to survivor bias, in that many potential participants will have died prior to reaching the age threshold. At the individual level, alcohol interacts with many medications (Aira et al., Reference Aira, Hartikainen and Sulkava2005), an issue that was not addressed in the current study. A further important consideration in making international comparisons is the wide difference in standard drinking measures. For example, a standard drink contains 19.75 g of ethanol in Japan, 14 g in the USA, 10 g in Australia, and 8 g in the United Kingdom (International Center for Alcohol Policies, 2010).
A paradoxical finding was noted in the female hospital admissions data where in model 2, current smokers had lower odds of hospital admission than never smokers. This effect was removed by the inclusion of other health conditions (e.g. diabetes, circulatory conditions), all of which are likely to be elevated in smokers (Scollo and Winstanley, Reference Scollo and Winstanley2008). In addition, a crude measure of mortality showed a greater proportion of current smokers than former or never smokers had died. The “time in study” variable would control for this, we therefore speculate that current smokers are either reluctant or less able to access healthcare.
Conclusions
In the USA, it is recommended that those aged 65 years or over should not exceed one standard drink per day (Dufour, Reference Dufour1992). However, a recent assessment based on a large US and UK older cohort found no statistically significant increases in adverse outcomes between those drinking at more than one to two drinks compared with those drinking at recommended levels (none to one standard drinks per day). The authors warned that over-restrictive guidelines may meet with consumer resistance and waste therapeutic resources (Lang et al., Reference Lang, Guralnik, Wallace and Melzer2007). Current Australian guidelines suggest that older adults should drink less than 20 g of alcohol per day with the exact figure based on individual circumstances (National Health and Medical Research Council, 2009), with the US guidelines recommending 14 g or less (Dufour, Reference Dufour1992). On the limited range of outcome measures evaluated in this present study, the data do not suggest the need for a lower recommended level than currently applicable to other adults. However, the differences in hospital admissions for men and women suggest that gender-based guidelines may need to be recommended for older adults as is current the case in the United Kingdom.
Conflict of interest
None.
Description of authors’ roles
R. J. Tait conducted the initial analysis and wrote the initial draft. D. J. French and R. A. Burns developed the initial topic area and contributed to subsequent statistical analyses. K. J. Anstey and J. E. Byles supervised the DYNOPTA data harmonization and pooling, were involved in collection of original datasets, and provided critical interpretation of the data. All the authors contributed to the final version of the manuscript and provided editorial input.
Acknowledgments
The data on which this research is based were drawn from several Australian longitudinal studies including: the Australian Longitudinal Study of Ageing, the Australian Longitudinal Study of Women's Health, the Australian Diabetes, Obesity and Lifestyle Study, the Blue Mountain Eye Study, the Canberra Longitudinal Study of Ageing, the Household, Income and Labour Dynamics in Australia study, the Melbourne Longitudinal Studies on Healthy Ageing (MELSHA), the Personality and Total Health Through Life Study, and the Sydney Older Persons Study. These studies were pooled and harmonized for the Dynamic Analyses to Optimise Ageing (DYNOPTA) project. DYNOPTA was funded by a National Health and Medical Research Council (grant no. 410215). All studies would like to thank the participants for volunteering their time to be involved in the respective studies. Details of all studies contributing data to DYNOPTA, including individual study leaders and funding sources, are available on the DYNOPTA Web site (http://dynopta.anu.edu.au). The findings and views reported in this paper are those of the author(s) and not those of the original studies or their respective funding agencies.