


I. INTRODUCTION
Accurate modeling of waveguide discontinuities is critical to build radio frequency (RF)/microwave components. Although, it is possible to model those discontinuities using techniques based on meshed configuration like finite-element method (FEM) or finite-difference time-domain method, they require quite expensive resources and time. Thus, it becomes inappropriate to use those techniques and/or commercial softwares as design tools. The scattering parameters of waveguide discontinuities and structures composed of the cascade of these discontinuities are better characterized based on the full-wave mode matching technique (MMT). MMT is a fast-rigorous technique in which electromagnetic fields on each side of a discontinuity are expressed in terms of a complete set of orthogonal functions. The field components on both sides of the discontinuity obey the appropriate boundary conditions. The computation of scattering parameters is straightforward when the material filling the structure is known. However, to find the complex permittivity of unknown material from measured scattering parameters becomes solving an inverse problem which requires much iteration and hence the computation is time consuming. For this purpose, MMT promptly characterizes the different discontinuities and gives their corresponding scattering. An iterative optimization gradient method is used in conjunction with MMT to compare the simulated and measured scattering parameters to extract the unknown complex permittivity. This technique has been successfully implemented and validated by extracting the complex permittivity of water and pulverized materials at room temperature over a broadband of frequencies [Reference Decrossas, EL Sabbagh, Fouad Hanna and El-Ghazaly1, Reference Decrossas, EL Sabbagh, Naseem, Fouad Hanna and El-Ghazaly2]. Different material characterization techniques used to extract complex permittivity are presented in [Reference Chen, Ong, Neo, Varadan and Varadan3]. Resonant methods usually offer a better accuracy yet a narrow frequency band of characterization, whereas non-resonant methods give results over a broadband. Single-port-based measurements allow the extraction of either the complex permittivity or the permeability. On the other hand, both complex permittivity and permeability can be extracted with two-port network measurements. Open-ended coaxial probe [4] is considered the easiest implementation of non-destructive measurements but the accuracy of extracted permittivity is limited to the surface roughness and the skin depth of material under test (MUT). Adding a shorted circular waveguide filled with MUT at the end of a coaxial line allows electromagnetic waves to propagate inside the material and also provides a better control on packing density and temperature. In [Reference Whinnery, Jamieson and Robbins5, Reference Belhadj-Tahar and Fourrier-Lamer6], coaxial discontinuities are analyzed based on the computation of the admittance of dominant mode in addition to the summation of contributions from higher-order modes. The computed admittance is compared to measured data from impedance analyzer and complex permittivity is extracted using an iterative method. The extraction method was limited to 18 GHz due to the usage of APC-7 mm connector. Increasing the size of the circular waveguide improves the accuracy of the method at low frequencies but puts a limit on the upper end of frequency measurement band. Published papers based on coaxial discontinuity referred to the same formulas described in [Reference Whinnery, Jamieson and Robbins5, Reference Belhadj-Tahar and Fourrier-Lamer6] based on impedance measurement. In this work, each discontinuity is described by its generalized scattering matrix (GSM) [Reference Itoh7–Reference EL Sabbagh9] obtained from full-wave MMT and compared to microwave scattering parameters measured using performance network analyzer (PNA). The accuracy of analysis comes from the consideration of all higher-order modes propagating and evanescent excited by a discontinuity. The analytical derivations of the self-inner and mutual-inner products of the coaxial-to-coaxial and coaxial-to-circular discontinuities are presented. Cascading of all discontinuities is carried out to compute the reflection coefficient of the entire structure. To simplify modeling, yet without lack of accuracy, waveguide metallization is assumed to be perfect conducting and to have negligible surface roughness. Reflection coefficient computed based on mode matching is compared to those obtained based on FEM using HFSS software [10] as well as microwave measurements.
II. GEOMETRICAL DESCRIPTION OF SETUP
The test structure is presented in Fig. 1. It consists of a cylindrical waveguide shorted at one end and connected to a 1.85 mm (female (F)) to 2.4 mm (male (M)) precision adapter at the other end. For modeling purposes, the test structure is divided into three main regions. Region I, shown in Fig. 1(a), is the 2.4 mm (M) part of the precision adapter. The other side of the adapter is the 1.85 mm (F) part attached to 50-Ω coaxial cable connected to PNA at the other end. Region II is defined by the overlap volume between the 2.4 mm connector and cylindrical cell as the inner conductor of adapter protrudes inside the cell.
(a) Schematic of the test structure. Dimensions of design parameters are: r 1(1) = 1.2 mm, r 2(1) = 0.52 mm, r 1(2) = 1.26 mm, r 2(2) = 0.254 mm, L 1 = 1.1 mm, and L 2 = 5 mm. (b) Microwave circuit model of test structure based on GSMs building blocks.

This region is modeled as a coaxial transmission line. Region III is the circular waveguide terminated by a short circuit. Regions II and III define the volume of cell where the MUT is inserted. The microwave circuit model of the test structure based on GSMs building blocks is given in Fig. 1(b). The model consists of the two main discontinuities: (i) coaxial 1 to coaxial 2 represented by the GSM Scoax–coax and (ii) coaxial 2 to circular waveguide represented by Scoax–coax. The connection between the two discontinuities is a coaxial transmission line (region II) of length L 1 and characteristic impedance Z coax2. The circular waveguide (region III) has a length L 2, its characteristic impedance is Z circ, and it is shorted at its end. The discontinuity interface between coaxial 1 to coaxial 2 coincides with the calibration plane, i.e., the calibration plane is right at the surface of MUT to remove any phase ambiguity related to measured reflection coefficient.
MMT is applied to find the GSMs corresponding to the different discontinuities, transmission lines are added to account for the phase delay between discontinuities, and all blocks are cascaded to obtain the final model of the testing structure. The first step to perform MMT is to find the appropriate eigenmodes and field components in each waveguide section.
III. FULL-WAVE MODELING OF TEST STRUCTURE
A) Eigenmodes
Coaxial transmission line supports TEM, TM, and TE modes whereas circular waveguides supports only TM and TE modes. The expressions of field components inside circular waveguides and field expressions of TEM mode in coaxial waveguides are given in [Reference Pozar11]. Expressions for TM and TE higher-order modes in coaxial waveguides are similar to those for TM and TE modes in circular waveguide with additional term including Bessel function of second kind, also called Neumann functions, to describe the fields close to the inner conductor of coaxial waveguide. The expressions of electric and magnetic field components in coaxial line for the different modes are given in the appendix. Within the context of this paper, the superscript numbers in parentheses refer to the respective waveguide region shown in Fig. 1 or Fig. 2.
Cross section of a general discontinuity: S 1 is the input smaller cross section of region 1 and S 2 represents the output larger cross section of region 2. (a i(k), b i(k)) represent the incident and reflected field coefficients in k th region with k ∈ {1, 2}.

B) Generalized scattering matrices
Once all field components and eigenmodes are derived for coaxial and circular waveguides, field matching is applied at each discontinuity. Figure 2 represents a general discontinuity between two waveguide regions with different cross sections. The incident and reflected waves in each region are defined in the figure where wave propagation is assumed to be along z-axis.
On each side of discontinuity, total transverse electric and magnetic fields are expressed as the summation of incident and reflected field components. Matching the total magnetic and electric fields on both sides of the discontinuity according to appropriate boundary conditions gives a set of equations that are solved based on the orthogonality properties of the fields.
• Continuity of tangential electric field at z = 0:
(1)
• Continuity of tangential magnetic field at z = 0:
(2)
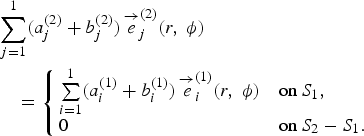
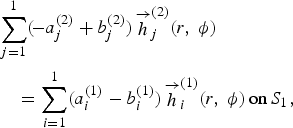
where  are the tangential electric and magnetic fields of the ith mode in kth region with k ∈ {1, 2} and (a i(k), b i(k)) represents the corresponding field coefficients of incident and reflected waves. S 1 refers to the cross section area of region 1 whereas S 2 represents the cross section area of region 2 as shown in Fig. 2. Theoretically, the fields in each region should be described as the summation of infinite number of modes; however, practically it is necessary to truncate the number of modes in each region. J modes are considered for region 2 and I modes for region 1. Equations (1) and (2) are solved by using the orthogonality properties of the electric and magnetic fields. The electric field continuity equation is tested on both sides by the magnetic field intensity of the larger cross section of region 2. The magnetic field continuity equation is tested on both sides by the electric field intensity of region 1. Hence, the incident and reflected coefficients of fields in regions I and II are related through the following two matrix equations:


where vectors a(1) and b(1) ∈ ℂI×1, a(2) and b(2) ∈ ℂJ×1 represent the incident and reflected field coefficients in regions I and II shown in Fig. 2. The matrix λ(2) ∈ ℂJ×J represents the matrix of self-inner products for region 2 and its elements are given as

where j ∈ {1,2, … , J} and â z is the unit vector. M ∈ ℂJ×I is the matrix of mutual inner products between regions 1 and 2

The matrix Mt ∈ ℂI×J, the superscript “t” denotes the transpose of matrix. The diagonal matrix λ(1) ∈ ℂI×I is the self inner product of region 1 and its elements are given as

where i ∈ {1, 2, … , I} .
The GSM modeling the discontinuity between regions 1 and 2 in Fig. 2 is obtained by rearranging (1) and (2):

where

R ∈ ℂI×J, T ∈ ℂJ×I are defined as R = λ(1)−1Mt and T = λ(2)−1M. U is the identity matrix.
It is noted that this is a general formulation describing a discontinuity between any two waveguides with different cross sections.
C) Coaxial-to-coaxial discontinuity
Hence, the problem is resumed to perform the self and mutual inner products in each region, respectively. Region 1 is a coaxial 50-Ω filled with air whereas region 2 corresponding to the probe of the 2.4 mm male part of the adapter which can also be approximated by a coaxial waveguide filled with dielectric material and different dimensions.
Self-inner product
The analytical calculations can speed up if the recurrence relations of Bessel functions are used. Self-inner products for a coaxial waveguide are given below:

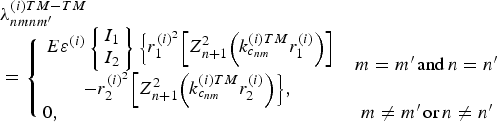
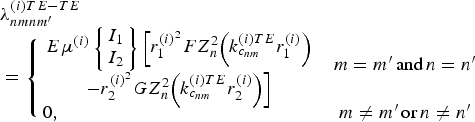


ɛ(i) and μ(i) are permittivity and permeability, respectively, in region i. It should be noted that there is no coupling between modes due to the assumption of perfect conducting boundary conditions and the orthogonality properties of the Bessel, sine, and cosine functions. The outer and inner radii of the coaxial in region i are, respectively, denoted as r 1(i) and r 2(i), where i ∈ {1, 2} refers to region 1 or 2, respectively as shown in Fig. 1. The cutoff constants are expressed as k c nm(i)TM for TM nm modes, k c nm(i)TE for TE nm modes, and k (i) for TEM modes as derived in the appendix. Similarly, the propagation constant for the TM nm and TE nm are expressed as γnm(i)TM and γnm(i)TE.
Mutual inner product
The mutual inner product computation follows exactly the same procedure applied for the calculation of the self-inner product. All possible combinations between the three existing modes in coaxial waveguides are studied. However, the orthogonality properties in addition to the boundary conditions have considerably simplified the calculation and only four cases are possible. Here is the summary of the results for the derivation of the mutual inner product concerning the coaxial-to-coaxial discontinuity. Analytical analysis shows that the incident TEM fundamental mode in region 1 only couples with TEM fundamental mode and TM 0m higher-order modes in region 2:

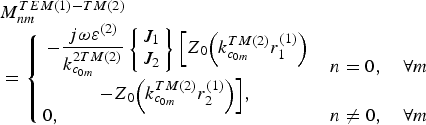
Finally, the mutual inner products of higher order modes are expressed as follows:
![\eqalign{&{M}_{nm\comma n^{\prime} m^{\prime}}^{TM\lpar 1\rpar - TM\lpar 2\rpar } \cr &= \left\{\matrix{\matrix{- {j}\omega \varepsilon^{\lpar 2\rpar } \displaystyle{\gamma_{nm}^{TM\lpar 1\rpar }\over k_{c_{nm}}^{TM\lpar 1\rpar }} \left\{\matrix{{I}_1\cr {I}_2}\right\}H \, Z_{n}\cr \Big (k_{c_{n^\prime m^\prime}}^{TM\lpar 2\rpar }r_2^{\lpar 1\rpar }\Big) \ Z_{n+1}\Big( k_{c_{nm}}^{TM\lpar 1\rpar }r_2^{\lpar 1\rpar }\Big) \Big] \comma \;} & n = n^\prime\comma \quad \forall m\comma \; m^\prime \cr 0\comma \; & n \ne n^\prime\comma \quad \forall m\comma \; m^\prime \cr }\right.}](https://static.cambridge.org/binary/version/id/urn:cambridge.org:id:binary:20151022080925720-0026:S1759078711000808_eqn15.gif?pub-status=live)

where

and

Concerning the TM and TE higher-order modes only coupling with same order n can be possible due to the orthogonality properties of the sine and cosine functions, independently of the order m. The derivation of the mutual and self-inner products gives the GSMs which describe the coaxial to coaxial discontinuity. By following the same process, the rigorous calculation of the self and mutual inner product of the coaxial to circular discontinuity is performed.
D) Coaxial-to-circular discontinuity
The results are similar to the previous derived solutions because the first kind and the second kind of the Bessel functions have same properties. As explained in the previous section, the difference between fields in a coaxial waveguide and circular waveguides is the added term of Bessel function second kind that describes the field around the inner conductor of coaxial line.
1) Self Inner product
Self-inner products for a circular waveguide are given below:


2) Mutual inner product


where

and r 1(2) and r 2(2) describe, respectively, the radius of the outer and inner conductors of the coaxial line in region 2 shown in Fig. 1(a). TM and TE higher-order modes only couple with the same order n and m due to the approximation on the perfect conducting wall and the orthogonality properties of the Bessel, sine, and cosine functions. This derivation concludes the calculation of the coaxial–coaxial and coaxial–circular discontinuities. By matching the modes at the interface between the different transitions, we have modeled and computed the corresponding GSMs: Scoax−coax from coaxial 1 to coaxial 2 and Scoax−circ from coaxial 2 to circular waveguide as indicating in Fig. 1. So, the next step is to cascade the building blocks by introducing the coaxial transmission line of length L 1 and the circular transmission line of length L 2 to model the entire testing structure.
E) Cascading GSMs
As shown in Fig. 3, the problem can be seen as cascaded matrices separated by transmission lines. The following derivation is a general formulation and can be easily applied for any number of discontinuities.
Cascade of two GSMs.

As presented in Section B, vectors a and b represent the amplitude of the respective incident and reflected fields according to their modes. One important fact is that the order of the modes inside each GSM block should be consistent all along the calculation as follows:
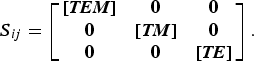
The block scattering matrices can be expressed as:

Reflected field coefficients are related to the incident field coefficients as follows:

In the region between the two discontinuities, transmitted and reflected fields are continuous which allows us to write the following equalities:

At the plane of short circuit at the end of the structure:

By substituting and rearranging the previous system of equation, we have:

where U is the identity matrix. Transmission lines are introduced in between the discontinuities to account for the proper phase shift. The first transmission line between the two discontinuities is described by the diagonal matrix:
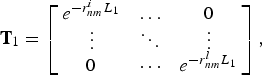
where r nmi is the propagation constant corresponding to the ith mode and L 1 is the distance between the two discontinuities as presented in Fig. 1. The second transmission line between the second discontinuity and the short circuit is described by the following diagonal matrix:
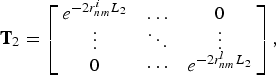
where L 2 is the length between the short circuit and discontinuity plane between coaxial 2 and circular waveguide.
The submatrices of the resultant cascaded matrices are:

The reflection coefficient of shorted structure is given as:

The general formulation of these cascaded matrices is applied to all the discontinuities existing in the structure. The number of modes selected to model each discontinuity has to be sufficient to ensure numerical convergence meanwhile minimizing computational time.
IV. NUMERICAL RESULTS
From the theoretical formulation of mode matching in previous section, it is observed that the theoretical required number of modes is infinite; however, for practical numerical computations, the number of modes is truncated. To determine the appropriate number of modes to be used in calculation, it is important to investigate the numerical convergence of scattering parameters versus the number of modes in each waveguide region. It is noted that the derivation carried out in the previous section show that TM om modes are only excited through the different regions. In-house program code is developed in Matlab [14] to carry out all computations presented in this work.
The convergence of the scattering parameters of the discontinuity from coaxial 1 to coaxial 2 is given in Fig. 4. The number of modes in each region is the same and the modes considered are the fundamental TEM and TM 0m higher-order modes. The convergence results are reported at the highest frequency of 40 GHz. In this case, coaxial 1 is a 50-Ω air-filled coaxial line, representing the 2.4 mm male part of the adapter. Coaxial 2 corresponds to a coaxial line with a larger cross section and filled with a fictive dielectric material of relative complex permittivity ɛ r = 17 −j1.7. It is observed that 15 modes result in satisfactory convergence for the studied case. We choose to use a fictive relative high complex permittivity to verify the validity of the code for lossy materials and to compare our results with a commercial software HFSS using the FEM. Figure 5 shows the comparison of the reflection and transmission coefficients for the coaxial 1 to coaxial 2 discontinuity with 15 modes used in modeling.
Convergence of the reflection and transmission scattering parameters of a coaxial–coaxial discontinuity versus the number of modes in each side at 40 GHz: (a) magnitude S 11 and S 12 in dB and (b) phase S 11 and S 12 in degree. Dimensions of design parameters shown in Fig. 1(a) are: r 1(1) = 1.2 mm, r 2(1) = 0.52 mm, r 1(2) = 1.26 mm, r 2(2) = 0.254 mm, and ɛ r = 17 −j1.7.

Scattering parameters of the coaxial-to-coaxial discontinuity: (a) magnitude S ij in dB and (b) phase S ij in degree. Dimensions of design parameters shown in Fig. 1(a)r 1(1) = 1.2 mm, r 2(1) = 0.52 mm, r 1(2) = 1.26 mm, r 2(2) = 0.254 mm, and ɛ r = 17 −j1.7.

Figure 5 shows clearly that the results of scattering parameters obtained from MMT and HFSS are in very good agreement. The convergence studies at 40 GHz of the discontinuity between coaxial 2 and circular waveguide are presented in Fig. 6. In this case, coaxial 2 is also filled with the dielectric material of complex permittivity ɛ r = 17 −j1.7. The circular waveguide has the same radius as the outer radius of coaxial 2 as shown in Fig. 1(a) and it is filled with the same dielectric material. It is observed that 15 modes are enough to assure that the scattering parameters are within acceptable error.
Convergence of the reflection and transmission scattering parameters of a coaxial–circular discontinuity versus the number of modes in each side: (a) magnitude of S 11 and S 12 in dB and (b) phase of S 11 and S 12 in degree. Dimensions of design parameters shown in Fig, 1(a) are: r 1(2) = 1.26 mm, r 2(2) = 0.254 mm, and ɛ r = 17 −j1.7.

Figure 7 presents the model used for HFSS simulation [10]. Using the appropriate planes of symmetry, it is possible to simulate only one-fourth of the structure which allows increasing the number of iterations to achieve required accuracy without increasing significantly the computational time.
HFSS model for the test structure shown in Fig. 1 (a).

The HFSS and MMT simulations are carried out on a 64-bit operating system windows 7 enterprise PC with Intel® Core™2 Quad CPU Q9550 @2.84 GHz and 4 GB RAM memory. In HFSS, simulations are set with a convergence criteria delta S of 0.001, only one excitation port TEM mode is defined sufficiently far enough from the discontinuity to avoid misinterpretation due to evanescent modes excited by the discontinuities. The number of mesh elements of the structure is 37 201 and the HFSS ComEngine memory is 66.7 M. About 12 min are sufficient to solve the model with a step frequency of 100 MHz from 10 MHz to 40 GHz.
Using the same frequency steps and limiting the number of modes based on the convergence criteria presented in Fig. 6 to 15 modes in each region, the MMT solves the same problem in 2 min on the same computer. The number of modes needs to be carefully chosen to achieve a compromise between computational time and desired accuracy. Figure 8 presents a comparison between HFSS and MMT results for the complex reflection coefficient of the actual test structure shown in Fig. 1.
Comparison of the reflection coefficient simulated with the MMT and HFSS of the testing structure shown in Fig. 1(a): (a) magnitude of S 11 in dB and (b) phase of S 11 in degree. Dimensions of design parameters shown in Fig. 1(a) are: r 1(1) = 1.2 mm, r 2(1) = 0.52 mm, r 1(2)= 1.26 mm, r 2(2) = 0.254 mm, ɛ r = 17 −j1.7, L 1 = 1.1 mm, and L 2 = 5 mm.

From the reflection coefficient obtained from HFSS with the fictive relative complex permittivity as presented in Fig. 8, an optimized gradient method has been implemented where both the real and imaginary parts of complex permittivity are varied until the reflection coefficient calculated from MMT comes to the one obtained from HFSS simulations. We observed a standard deviation less than 2% on the real and imaginary parts of the fictive material simulated with HFSS as shown in Fig. 9. It should be noted that the obtained reflection coefficient from HFSS plays the same role as doing microwave measurements using PNA. This step was necessary to validate the developed approach before starting real measurements.
Relative complex permittivity extracted using MMT based on numerical results obtained from HFSS for a fictive material (ɛ r = 17 −j1.7). The corresponding reflection coefficients are shown in Fig. 8.

V. EXPERIMENTAL RESULTS
The extraction of complex permittivity from measured complex reflection coefficient (S 11) requires the implementation of an iterative technique such as the gradient optimization method explained in [Reference Walsh13]. The gradient technique is a general method to solve inverse problem by iteration. This technique is based on the knowledge of the distance and the direction of the minimum from an initial value. Hence, the criteria of convergence to the actual permittivity are adjusted based on the accuracy of results extracted from PNA. Figure 10 presents the comparison between measurements and MMT results for reflection coefficient when the cell is air filled. Figure 11 shows the extracted permittivity from the measured reflection coefficient presented Fig. 10. The results are in good agreement with the theoretical value of air (ɛ r = 1 −j0). The fact is with such lossless material like air, the method of extraction is limited to the calibration precision related to phase measurement, specifically at low frequencies. To achieve accurate measurements over a broadband of frequencies, the calibration of the PNA is carried out over two frequency ranges: (i) from 10 MHz to 20 GHz and (ii) from 20 GHz to 40 GHz. The SOLT (short, open, load, and thru) calibration is adopted and 201 frequency points are considered in each frequency range. The intermediate frequency bandwidth is set to 70 Hz to ensure reduction of calibration errors and minimization of random noise. The reference plane is in direct contact with the MUT as shown in Fig. 1 to avoid phase ambiguity. The minor phase fluctuations observed in Fig. 10(b) are due to the surface roughness of metallization which has been neglected in our modeling, tolerance of manufactured structure that degrades the extraction of the complex permittivity. However, we have proven that with this method we can extract the relative permittivity with sufficient accuracy for lossless and lossy material over wide frequency range using only a single test structure based on the numerical and experimental results [Reference Decrossas, EL Sabbagh, Fouad Hanna and El-Ghazaly1].
Comparison of the reflection coefficient obtained from MMT and microwave measurements of the testing structure shown in Fig. 1(a) when the cell is air filled (ɛ r = 1 −j0): (a) magnitude S 11 in dB and (b) phase S 11 in degree. Dimensions of design parameters as shown in Fig. 1(a)r 1(1) = 1.2 mm, r 2(1) = 0.52 mm, r 1(2)= 1.26 mm, r 2(2) = 0.254 mm, L 1 = 1.1 mm, and L 2 = 5 mm.

Extraction of the relative complex permittivity of air when the cell is empty (ɛ r = 1 −j0) computed from the measured reflection coefficient presented Fig. 10.

To validate the technique presented in this paper, the extraction of the complex permittivity of deionized (DI) water at room temperature is shown in Fig. 12.
Relative complex permittivity of water extracted by applying the described process in this paper and compared with data found in [Reference Kaatze15] for distilled water at 25°C.

The frequency dependence of water complex permittivity can be modeled by Debye function:

where the parameters of Debye relaxation spectral function for water at 25°C are given in [Reference Kaatze15]. Static dielectric constant ɛ(0) = 78.36 ± 0.05, permittivity at high frequency ɛ(∞) = 5.2 ± 0.1, relaxation time τ = 8.27 ± 0.02 ps, and ω is the angular frequency. The Debye relation represented by the Argand diagram (solid line) is presented in the inset and compared to our extracted measurements (black cross marker).
VI. CONCLUSIONS
The approach proposed in this paper combines accurate modeling based on full-wave technique and microwave measurements of scattering parameters. The full-wave approach that is based on MMT is implemented to derive the GSMs of all discontinuities existing in the test structure. Very good agreement between MMT simulation and measurement results is obtained. We have shown that by using the inverse problem based on the gradient optimization method concurrently with MMT, we are able to extract the complex permittivity from the measured and accurately calculated reflection coefficient. Finally, the accuracy of MMT is experimentally validated by comparing the measured refection coefficient and the extracted complex permittivity in case of air and DI water at room temperature.
APPENDIX
The expressions of field components in a coaxial transmission line are given as follows:
TEM mode:

where the TEM wave impedance is

TM nmmodes:
The solution of the Helmholtz equation gives:

where Z n(k cr) = J n(k cr) + G nY n(k cr) and the constant G n is found by applying the boundary conditions: e z n(r, ϕ) = 0 at r = r 1(1) and r = r 2(1). PEW and PMW denote perfect electric wall and perfect magnetic wall, respectively:

In addition, the solution of the transcendental equation allowed us to find the roots of the equation. If the mth roots of

is designated by p nmTM, the allowed values of k c are 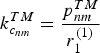 where n = 0, 1, 2, 3, … , N and m = 0, 1, 2, 3, … , M. Therefore the propagation constant can be described as

where k Reference Decrossas, EL Sabbagh, Naseem, Fouad Hanna and El-Ghazaly2 = ωReference Decrossas, EL Sabbagh, Naseem, Fouad Hanna and El-Ghazaly2μɛ.
Finally, the field components for TM nm higher-order modes are:


where the wave impedance for the TM nmth mode is

TE nmmodes:
Similarly, the solution of the Helmholtz equation gives

where Z n(k cr) = J n(k cr) + g nY n(k cr) and the constant g n is found by applying the boundary conditions. Therefore the longitudinal component of the magnetic field must vanish at the surface conductors. Hence,

and we get the constant

Similarly, if the mth roots of the transcendental equation

is designated by p nmTE, we find that the allowed values of k c are  , where n = 0, 1, 2, 3… , N and m = 0, 1, 2, 3… , M.
Finally, the field components for TE nm higher-order modes can be expressed as


where the wave impedance for TE nmth mode is

 Emmanuel Decrossas (S'10) received the B.S. and M.S with honors in engineering science and electrical engineering from the Université Pierre et Marie Curie Paris-6, Paris, France in 2004 and 2006, respectively. He is actually pursuing his Ph.D. in electrical engineering in the University of Arkansas, Fayetteville, AR, USA. He was an intern in Laboratoire de Génie Électrique de Paris (LGEP) in 2005. Mr. Decrossas was a visiting scholar student in 2006 in the University of Tennessee to initiate an international student exchange program and performed his M.S thesis research on reconfigurable MEMS antennas for wireless applications. His research interests include dielectric characterization, computer-aided design of microwave devices, micro/nano-fabrication, and nanotechnology applied to high-frequency devices. Mr. Decrossas is member of the electrical engineering honor society Eta Kappa Nu and has been cited in the Who's Who among students in American universities and colleges in recognition of outstanding merit and accomplishment in 2011.
 Mahmoud A. EL Sabbagh (S'93–M'02–SM'06) received the B.S. (with honors) and M.S. degrees in electrical engineering from Ain Shams University, Cairo, Egypt, in 1994 and 1997, respectively, and the Ph.D. degree from the University of Maryland, College Park (UMCP), in 2002. Dr. Sabbagh is holding the position of Professor of Practice in the EECS Department, Syracuse University and also working with Anaren Microwave, Inc. He is cofounder of EMWaveDev where he is involved in the design of ultra-wideband microwave components. Dr. EL Sabbagh is a senior member of IEEE and worked at several academic and governmental institutes in Cairo, Canada, and US. His research interests include computer-aided design of microwave devices, microwave filter modeling and design for radar and satellites applications, dielectric characterization, metamaterial, EM theory, and RF Nanotechnology. Prof. EL Sabbagh is a member of Sigma Xi and he was cited in the 2008–2009 edition of “Who's Who in Science and Engineering.”
 Victor Fouad Hanna (F'96) received the B.Sc degree (honors) in electronics engineering from Cairo University, Cairo, Egypt in 1965, and the M.Sc. degree in microwave engineering from Alexandria University, Egypt in 1969. He received his Ph.D degree from Institut National Polytechnique (I.N.P.), Toulouse, France in 1975. Since 1997, he is a professor at the University Pierre et Marie Curie (University of Paris 6) in the EE Department. His current research interests deal with electromagnetic theory, numerical methods, millimeter-wave transmission lines, and bio-electromagnetism. Prof. Fouad Hanna was selected as recipient of the IEEE third Millenium medal. He was the president of the IEEE France Section during the period 2002–2005. He is a member of the Region 8 IEEE Educational Activities Committee since January 2003 and a chair of this committee in 2004–2006. He is chair of the region 8 Awards and Recognition Committee since 2007.
 Samir M. El-Ghazaly (S'84–M'86–SM'91–F'01) received the B.S and M.S with honors in electronics and communications engineering from Cairo University in 1981 and 1984, respectively and the Ph.D. degree in electrical engineering from the University of Texas at Austin, in 1988. He is currently the department head of the University of Arkansas, Fayetteville, since 2007. His research interests include RF and microwave circuits and components, microwave and millimeter-wave semiconductor devices, and numerical techniques applied to MMICs radio-frequency nanotechnology devices. Prof. El-Ghazaly is a member of Tau Beta Pi, Sigma Xi, and Eta Kappa Nu. He is an elected member of Commissions A and D, URSI. He is a member of the Technical Program Committee for the IEEE Microwave Theory and Techniques Society (IEEE MTT-S) International Microwave Symposium (IMS) since 1991. Prof. El-Ghazaly was the president of the IEEE's MTT-S in 2010.



