


1. Introduction
Snow depth, HS, and its spatial distribution is a key parameter in cold region sciences such as avalanche formation/dynamics (e.g. Reference McClung and SchaererMcClung and Schaerer, 1993), snow climatology (e.g. Reference MartyMarty, 2008) and snow hydrology (e.g. Reference DeWalle and RangoDeWalle and Rango, 2008). Particularly in snow hydrology, HS data can be used with a parameterization of the snow bulk density (Reference Jonas, Marty and MagnussonJonas and others, 2009) to monitor the seasonal development of mountain water resources (e.g. in the Swiss Alps). Particularly for flat-field HS measurements, the reliability of the simple parameterization of SWE with HS has been shown (Reference Egli, Jonas and MeisterEgli and others, 2009). Therefore, the scale analysis in this study focuses exclusively on snow-depth readings. If an area of homogeneous snow distribution can be found, a single point HS measurement is needed to capture the total amount of snow in that area. However, the snow cover is spatially highly variable (e.g. Reference Shook and GrayShook and Gray, 1996). This makes it difficult to provide reliable estimates of the mean HS in a given region by HS point measurements exclusively or by different interpolation schemes (e.g. Reference Erxleben and DavisErxleben and others, 2002). It also complicates validation of the estimates of remote-sensing techniques (Reference Seidel and MartinecSeidel and Martinec, 2004) or spatially distributed snow models (e.g. Reference Luce, Tarboton and CooleyLuce and others, 1999; Reference ListonListon 2004; Reference Lehning, Völksch, Gustafsson, Nguyen, Stähli and ZappaLehning and others, 2006).
Reference Egli and JonasEgli and Jonas (2009) reported that the spatial distribution of HS measured on high-Alpine flat sites exhibits a considerable heterogeneity at the scale of the entire Swiss Alps. In fact, it was shown that the variability of HS, quantified by the standard deviation, increases with increasing mean during the accumulation period. This dependency was characterized by the parameter β (see Equation (2)) which was found to be similar for six seasons (β ~ 0.84). The study thus implies that the point measurements capture the mean of HS less reliably when snow is accumulated in the Swiss Alps. It is further assumed that the observed development of the spatial distribution of HS is generated by the precipitation patterns from the Alpine microclimatological regions (Reference LaternserLaternser, 2002; Reference Scherrer and AppenzellerScherrer and Appenzeller, 2006). Therefore, we hypothesize that at smaller scales, within the micrometeorological regions, the parameter β might exhibit a smaller value due to a higher spatial homogeneity of precipitation originating from the Alpine meteorology.
In this study, we perform a scale analysis of β during the accumulation period at scales between 10 and 300 km over the Swiss Alps, including a wider range of altitudes than in previous studies. The analysis is restricted to flat measuring sites without the use of spatially distributed modeling of the snow cover on complex Alpine topography. For a comparable quantification, we use two independent datasets representing flat-field HS estimations: (1) manual and automatic snow-depth point measurements from the operational snow-measuring network in the Swiss Alps, IMIS (Intercantonal Measurement and Information System; Reference Rhyner and StevensRhyner and others, 2002), and (2) the snow precipitation output of the COSMO-7 (Consortium for Small-Scale Modelling) weather prediction model (see http://www.cosmo-model.org/) with a mesh size of 7 km.
A further objective of our scale analysis is to quantify the dependency between the number of point measurements at a given scale and the accuracy of estimating the total snow amount (e.g. Reference Famiglietti, Ryu, Berg, Rodell and JacksonFamiglietti and others, 2008; Reference Brocca, Melone, Moramarco and MorbidelliBrocca and others, 2010). This relationship can help to validate spatially distributed snow models, different remote-sensing techniques or rain/snow precipitation radar, particularly with limited point measurement availability.
2. Data
2.1. Automatic and manual point measurements
For the following scale analysis, 141 automatic and manual HS point measurement stations were used (Fig. 1, triangles), collecting data during seven winter periods from 2001/02 to 2007/08. The stations are located on flat open terrain with minimal wind influence, defined as the standard for the Swiss operational snow-measuring network, IMIS (Reference Rhyner and StevensRhyner and others, 2002). The sites are considered representative of snow conditions within a region around the point measurements (Reference EgliEgli, 2008) and cover the Swiss Alpine region evenly, in both the vertical (800–2990ma.s.l.) and the horizontal direction (about 100 km~300 km).
Map of Switzerland with the locations of the 141 snow-depth measurement stations (triangles) covering the Swiss Alps. The squares indicate possible boxes of the sampling procedure for the scale analysis. Box a: 50 km; box b: 25 km; box c (Davos): 2.5 km.

The HS data were recorded at 30 min intervals and were aggregated to daily measurements by selecting the HS values at midnight. Manual snow-depth readings are read on a daily schedule (~0800 h) from a snow stake at a flat measuring site located at lower altitudes in the vicinity of housing (Reference MartyMarty, 2008). All 141 snow-depth estimations were merged into a continuous dataset of daily HS measurement, while missing or erroneous values were carefully checked for plausibility and then interpolated and corrected manually.
2.2. COSMO-7 model output data
The numerical weather prediction model COSMO-7, operated by MeteoSwiss (http://www.meteoschweiz.admin.ch/web/en/research/consortia/cosmo.html), is a primitive equation model with nonhydrostatic, fully compressible dynamics. Among other meteorological parameters, COSMO-7 provides predictions of rain and snow precipitation on a regular grid of 7 km mesh size. It has been shown that generally the COSMO-7 model is able to represent daily snow precipitation (Reference Egli, Jonas and BettemsEgli and others, 2010). We used snow precipitation derived from the assimilation mode (www.cosmo-model.org), representing the best current stage of the atmosphere of the model. From each COSMO-7 gridcell next to the locations of the 141 snow-depth measurements, daily snow precipitation output was extracted for the winter periods 2004/05, 2005/06 and 2006/07. The daily snow precipitation was cumulated from 1 November to 30 April. This period can generally be considered as the accumulation period of snow at high elevations in the Swiss Alps, but is not appropriate for lower elevations. The implications of this assumption are discussed further below. The summation of snow precipitation should reproduce the accumulation period of snow water equivalent as suggested by Reference Egli, Jonas and MeisterEgli and others (2009). Possible implications of this procedure are also discussed further below. Notably, the COSMO-7 output provided a different and independent dataset, where snow-depth point measurements on the ground were neither implicitly nor explicitly included.
3. Methods
3.1. Parameter β
This study focuses on the development of the spatial variability of HS during the accumulation period only. The accumulation period was defined from the beginning of winter, where no snow is observed at all measuring sites, to the date when the mean of HS reached its seasonal maximum. We characterized the spatial variability of HS as the standard deviation:

where x(t) is a HS reading for day t, and  displays the spatial mean of x over a sample of stations at a given date for measurements at the 141 stations and COSMO-7 gridpoints (in analogy to Reference Egli and JonasEgli and Jonas, 2009). Consequently, we also determined the relationship of the HS variability to the mean HS analogous to Reference Egli and JonasEgli and Jonas (2009):

where β was determined by a least-squares fit to the exponential function. In the following, the relationship between mean and standard deviation of HS is characterized by the parameter β, indicating the development of the spatial variability of HS.
3.2. Scale analysis and sampling procedure
When analyzing smaller regions in the Swiss Alps, the number of available stations decreases with decreasing scale. Before implementing a sampling procedure for the scale analysis of β, we examined the number of stations sufficient to represent the standard deviation, σ, assuming no spatial structure of the snow-depth distribution. The closed circles in Figure 2 show the dependency of σ on the number of samples calculated from a generated gamma distribution with a mean of 1 and a standard deviation of 1. The gamma distribution of snow depths corresponds roughly to the distribution observed over the entire Swiss Alps at the winter maximum. The open circles in Figure 2 display the same relationship calculated from the 141 existing HS measurements. Both curves show that the standard deviation is a biased estimator depending on the number of samples. In order to cover as small a scale as possible, ten sampling points (vertical dashed line in Fig. 2) were considered a good compromise to sample σ sufficiently.
Standard deviation as a biased estimator depending on the number of sampling points: simulated gamma distribution (closed circles) and 141 HS measurements (open circles). Circles indicate the mean over 5000 realizations, where the error bars denote the deviation from the mean. The curve displays an approximation of the curve following Equation (4).

For the scale analysis of β, the following procedure was chosen: A scale L is represented here by a spatial domain, from which station data are analyzed to calculate β. Such a domain can be centered around any of the snow stations and comprises a quadratic box of side length L. The following procedure was used to determine β(L).
-
1. For a given scale, and a given snow station used as reference station, randomly select ten (different) stations located within the search domain centered around the reference station. This selection may or may not include the reference station.
-
2. Calculate β based on Equation (2) and data from the ten stations selected above. If a search domain contains fewer than ten stations (which may happen at small scales), continue without calculating β.
-
3. Replicate steps 1 and 2 ten times for each of the 141 stations.
-
4. From these maximum 1410 β values, randomly select five (different) β values and calculate the average.
-
5. Replicate step 4 a hundred times and calculate the mean of the averaged beta resulting in β(L). The above averaging procedure (steps 4 and 5) has been set up to mitigate the scale-dependent number of β values available after step 3.
-
6. Replicate steps 1–5 for each scale L between 10 and 300 km.
4. Results and Discussion
4.1. Scale analysis of β
One objective here is to evaluate the initial hypothesis of decreasing β with smaller scales. Figure 3 shows curves of standard deviation of HS over the mean of HS for four exemplary regions at different scales. Each point represents 1 day of the accumulation period during winter 2006/07 (Fig. 3a–c). The points are used to calculate β following Equation (2), and to determine its regression (black lines). The values of β in Figure 3 are almost equal, ranging from 0.836 to 0.907, while their maximum mean snow depths differ depending on the sampled region. Note that Figure 3d displays a trajectory based on measurements captured in the region of Davos (Fig. 1, box c) during winter 2008/09. During this period, five stations were available in an area of about 1.2 km×2.6 km, including stations from the Wannengrat test site (Reference Grünewald, Schirmer, Mott and LehningGrünewald and others, 2010). Although only five stations are included, the graph is additionally shown to demonstrate that the trajectory at a very small scale reflects behavior similar to the curves calculated from larger scales using ten stations (Fig. 3a–c).
Trajectories of standard deviation over mean of HS at different scales in the Swiss Alps. The lines indicate the least-squares fit of Equation (2). (a–c) include ten stations from (a) the entire Swiss Alps, (b) a box of 50 km side length and (c) a 25 km box. (d) the trajectory based on measurements in the Davos region.

Figure 4 displays β as a function of scale for different examinations:
Scale analysis of β for two data sources (point measurements and COSMO-7), for an elevation band between 1660 and 2990 ma.s.l. and for different numbers of stations (three and ten) used for the scale analysis. The star denotes β determined by five stations located in the Davos region at a scale of 2.5 km.

-
1. Point measurements using three stations (β 3, circles) and ten stations per box (β 10, points).
-
2. Point measurements restricted to an elevation band between 1660 and 2990ma.s.l. and ten samples per box (β High, crosses).
-
3. COSMO-7 data with ten samples per box (β COSMO, triangles).
Each point represents the mean values of the sampling procedure over the analyzed seasons, where the single values deviate about ±0.03 (β 10, β COSMO, β High) and ±0.06 (β 3) from the mean. Figure 4 reveals that β exhibits similar values for scales down to 25, 10 or even 2.5 km as is observed at the scale of the entire Swiss Alps (300 km). Note that the scale-invariant behavior of β is similar when analyzing each season separately (data not shown). This effect is rather astonishing as it is assumed (Reference Egli and JonasEgli and Jonas, 2009) that β for the entire Swiss Alps is formed by the Alpine microclimatological precipitation pattern (Reference LaternserLaternser, 2002). The results of an analysis of β for each individual climatological region proposed by Reference LaternserLaternser (2002) reveal that β Clim.Region did not substantially deviate from the β of the entire Swiss Alps (specific table not shown). This finding, and especially the results in Figures 3 and 4, may suggest that the spatial variability of HS is not only formed by the large-scale precipitation patterns but also perhaps mainly by other processes at smaller scales, even smaller than those analyzed in this study. These processes may include various snow distribution processes on smaller scales (Reference Balk and ElderBalk and Elder, 2000), such as preferential deposition of snow (Reference Lehning, Löwe, Ryser and RadeschallLehning and others 2008) and wind drift (e.g. Reference Liston and SturmListon and Sturm, 1998). At these smaller scales, the roughness of the terrain surface becomes an increasingly dominating factor. For this reason, it could be assumed that the effect of increasing snow-depth variability with increasing mean snow cover observed at very large scales may be affected exclusively by the small-scale processes. This would imply that the snow-depth point measurements represent the snow cover exclusively very locally and do not represent a larger region around the measuring site as assumed (see section 2; Reference EgliEgli, 2008).
To evaluate whether the scaling invariance of β is caused by small-scale processes or by the large-scale precipitation patterns, we analyzed the independent dataset of COSMO-7. Note that COSMO-7 estimates the snow precipitation on a mesh of 7 km and does not account for small-scale processes below that size. Moreover, the physical processes of the model may be more appropriately reproduced by a couple of points of the regular mesh (e.g. scale of ~35 km), rather than a single gridpoint. The results in Figure 4 reveal that this additional dataset shows an almost constant scaling behavior of β COSMO at scales from 300 to 50 km, as well as, for example, β 10. However, β COSMO exhibits a smaller value than β 10. This deviation can be explained by the fact that COSMO-7 represents cumulated snow precipitation and does not account for the processes of melting or sublimation during the accumulation period. Particularly at lower altitudes, the accumulation period is affected by melting cycles, resulting in a generally smaller snow depth (Reference LaternserLaternser, 2002). This suggests that the assumption of a strict accumulation period between 1 November and 30 April is not appropriate for lower elevations. However, when the analysis of β is restricted to high-Alpine regions, where only snow accumulation can be assumed, β High reaches scale-invariant values of β High~0.83, which is close to β COSMO~0.84 (see Fig. 4). At the scale of 300 km β High~0.83 is comparable to β ~ 0.84 reported by Reference Egli and JonasEgli and Jonas (2009), who analyzed snow depths in the same elevation bands for that scale. The study further stated that, at high-Alpine elevations, melting or sublimation is insignificant for the mass balance during the accumulation phase. Therefore, cumulated COSMO-7 snow precipitation data reflect the total amount of snow water equivalent (SWE) during the accumulation period. The similar values of β COSMO and β High suggest that the scale analysis obtained here for snow depths may also be applied for SWE, at least for high-Alpine sites. This is in line with the findings of Reference Sturm, Taras, Liston, Derksen, Jonas and LeaSturm and others (2010) where 90% of the variance of SWE can be explained by the variance of HS.
When analyzing the parameter β for different elevation bands separately, the same scale invariance can be found. However, the absolute value of β restricted to an elevation band differs slightly from β including the entire range of elevation. At the lowest elevation band, 800–1100ma.s.l., β ~ 0.87 exhibits the highest increase in snow-depth variability with increasing mean due to overlapping melting and accumulation cycles. However, in higher elevation bands (e.g. 1600–2100ma.s.l.), β decreases, reaching its lowest value, and increases again when restricted to high-Alpine elevations, β High, which can also be found with β COSMO. Because β COSMO does not include the process of melting, the difference of altitudinal bands cannot be observed in the analysis of β COSMO.
We conclude that at high-Alpine sites, the spatial variability of HS at scales between 50 and 300 km stems from the precipitation pattern of the Alpine microclimatological regions. At scales between 25 and 50 km, β COSMO decays rapidly, which may be attributed to technical aspects of the model itself, where neighboring gridcells may not deviate as much as observed on the ground and only a couple of gridpoints may be able to represent the physical processes adequately. However, for the point measurements, β 3 and β 10 remain scale-invariant until 25 and 10km (or even 2.5 km; Fig. 3d), which may stem from small-scale precipitation patterns or from small-scale processes near the snow surface. At these scales, we cannot determine from which processes the increasing variability with increasing mean may stem. Nevertheless, the quantification of β determined here and its scale-invariant behavior may help to provide a small-scale subpixel parameterization of a distributed snow model. Particularly for a stochastic model approach, where the mean and the standard deviation of the probability density function (PDF) are needed (e.g. Reference Luce, Tarboton and CooleyLuce and others, 1999; Reference ListonListon, 2004; Reference Perona, Porporato and RidolfiPerona and others, 2007), the quantitative evaluation of β for different scales may be helpful.
4.2. Accuracy of estimating the mean of snow cover
The second objective of this study addresses the question: how accurately can we estimate the total snow amount at a given scale using a small number of flat-field snow-depth measurements? the results in Figures 3 and 4 show that the standard deviation increases with increasing mean quantitatively similarly for scales between 10 and 300 km with an exponent β ~ 0.9 considering sites at 800–2990ma.s.l. This means that the uncertainty of estimating the mean snow depths is increasing if the number of stations is constant during the accumulation period. Conversely, to obtain absolute accuracy in the capture of mean snow depths, more HS point measurements are needed the more snow is accumulated in a given region. Generally, the absolute accuracy of a measurement depends on the number of sampling points, N, and the standard deviation,
σ, given by

The standard deviation of snow depths in the Swiss Alps depends on the mean following Equation (2). Therefore the absolute accuracy is given by
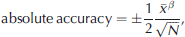
where β is scale-invariant at scales from 10 to 300 km. The results in Figure 4 can now be applied using Equation (3) to evaluate the minimum number of sampling points required to obtain a certain confidence interval (Reference Brocca, Melone, Moramarco and MorbidelliBrocca and others, 2010) for the estimate of the total snow amount in a considered area. Figure 5 shows the absolute accuracy for various numbers of samples following Equation (3) (β ~ 0.9). The relationship in Figure 5 is of practical importance for ground truth verifications of remote-sensing techniques and for the validation of spatially distributed snow models, particularly when limited data are available (Reference Famiglietti, Ryu, Berg, Rodell and JacksonFamiglietti and others, 2008).
Absolute accuracy of mean snow-depth estimations depending on the number of point measurements.

Figure 4 shows β calculated from 141 point measurements but with only three samples per scale (β 3). Due to this smaller number of samples, a scale analysis can be provided down to 10 km. However, as the standard deviation is a biased estimator (Fig. 2), β 3 is smaller (~0.85) than β 10. The bias of the standard deviation can be approximately quantified by (Reference Kenney, Kenney and KeepingKenney and Keeping, 1951; http://mathworld.wolfram.com/StandardDeviationDistribution.html):

where N is the number of sampling points. The curve in Figure 2 shows Equation (4) and indicates that this approximation fits the observed relationship well. The results of β (Fig. 4) and its relationship in Equation (2) may be used to analyze fewer point measurements for plausibility and to correct the obtained standard deviation to a value closer to the expected real value. This correction has further practical implications in snow hydrology, where the development of the snow-covered area during the ablation period is strongly linked to the spatial distribution of snow cover at the end of the accumulation period (see Reference Egli and JonasEgli and Jonas, 2009). In particular, the development of the fractional snow-covered area during melt is determined by the PDF of the snow distribution and its standard deviation before melt starts (e.g. Reference Luce, Tarboton and CooleyLuce and others, 1999; Reference Essery and PomeroyEssery and Pomeroy, 2004).
5. Conclusions and Outlook
The relationship between the total amount of snow and its variability during the accumulation period is observed to be similar at scales between 10 and 300 km in the Swiss Alps. The variability of snow depth is quantified in terms of standard deviation over mean of snow depth. This scale-invariant relationship can be applied for a subpixel parameterization of distributed snow models and for a stochastic modeling approach of snow distribution, where the mean and standard deviation of the PDF are needed.
The absolute accuracy of the total snow content depends on the averaged snow depths and on the sampling scheme, i.e. numbers of stations available to estimate the mean of accumulated snow. We quantified the absolute accuracy at different scales, which can be applied to validate different spatially distributed snow models or remote-sensing techniques.
We also showed that the numerical weather prediction model COSMO-7 reproduced the same scale invariance of the relationship of mean cumulated snow precipitation and its standard deviation for scales between 50 and 300 km. This suggests that the variability of snow depths at these scales stems from the meteorological precipitation patterns in the Swiss Alps. However, at scales between 10 and 50 km the observed variability may either originate from small-scale precipitation patterns or from other small-scale processes influencing the snow cover on the ground. Future work may investigate the development of snow depth or cumulated precipitation variability at these scales. Tools such as high-resolution precipitation radar or physically based snow-cover models could be used.
Acknowledgements
We thank J.M. Bettems and F. Schubiger of MeteoSwiss for their support for the COSMO-7 data acquisition and processing, and two anonymous reviewers and A. Ohmura for constructive suggestions that helped to improve the manuscript.



