Introduction
Sensors have many applications in industrial sectors and are cost effective and with enhanced execution speed. The high precision and accuracy of sensors and easy to handle have made them useful in various fields such as food [Reference Raveendran and Raman1] and pharmaceutical [Reference Mohammadi, Mohammadi, Demir and Kara2] industries. Sensors can be combined with applications such as the internet of things [Reference Nishio, Kaburagi, Hamada, Matsumoto, Kumagai and Kurihara3, Reference Kiani, Rezaei and Fakhr4] and metrology [Reference Ramella, Pirola and Corbellini5]. Sensors have several interesting applications, for example, when snow falls on antennas of base stations, they can detect snow and its quantity and then they can activate a system for melting snow [Reference Tariq, Ye, Zhao, Zhang, Cao and He6]. Also [Reference Raveendran and Raman1] mentions a sensor that could detect adulteration.
One of the important applications of microwave sensors is determining the dielectric constant of various materials [Reference Yashchyshyn, Derzakowski, Wu and Cywiński7–Reference Navaei, Rezaei and Kiani12]. By determining the dielectric properties of materials, the type of material can be determined, and one of these methods is the use of bandpass [Reference Zheng, Pan and Jiang13] and bandstop filters [Reference Xuemei and Jiang14, Reference Kiani, Rezaei, Karami and Sadeghzadeh15] and antenna [Reference Gharbi, Estrada, Garcia and Gil16–Reference Kiani, Rezaei and Fakhr18] structures. Sensors can be used to determine the amount of pressure [Reference Zhu, Tang, Guo, Gerald and Huang19], distance [Reference Baskakova and Hoffmann20], or strain [Reference Molina, Giraldo and Vera17] and acoustic waves [Reference Bao, Zhou and Wang21]. These tools are used to determine the type of solid [Reference Kiani, Rezaei, Navaei and Abrishamian22] and liquid [Reference Velez, Enano, Ebrahimi, Herrojo, Paredes, Scott, Ghorbani and Martin11] materials.
Sensors have many advantages, they can perform sensing in one frequency band (single-band) [Reference Kiani, Rezaei, Navaei and Abrishamian22] and can also perform in several frequency bands (multi-band) simultaneously [Reference Mohammadi, Teimouri, Mohammadi, Demir and Kara23, Reference Kiani, Rezaei and Fakhr24]. The use of multiband sensors makes it possible to measure several samples simultaneously, so multi-sensing sensors are one of the functionalities of sensors in the industry [Reference Kiani, Rezaei and Navaei25]. Also, the sensors can have the ability to test only one sample [Reference Kiani, Rezaei and Navaei25] (single-sample) or several samples [Reference Kiani, Rezaei, Navaei and Abrishamian22] (multi-samples) as needed. This feature can affect their quality factor (Q-factor) and sensitivity, however, increasing the number of samples at the same time can reduce the value of the Q-factor and the sensitivity. The methods of measuring samples by microwave sensors are different for different kinds of sensors. In many sensors, the sample placed on the sensor are called the sensing location and some sensors are designed using a method for implementing the sample by creating a set-up structure such as channeling in order to increase the sensitivity [Reference Mohammadi, Adhikari, Jain and Zarifi26].
Since the sensors can detect the type of material by determining the dielectric constant of the material, therefore different types of substances can be measured, for example, the amount of brine [Reference Baghelani, Hosseini and Daneshmand27], blood glucose [Reference Baskakova and Hoffmann28–Reference Abdolrazzaghi, Katchinskiy, Elezzabi, Light and Daneshmand30], methanol [Reference Piekarz, Wincza, Gruszczynski and Sorocki31, Reference Dalgac, Akdogan, Kiris, Incesu, Akgol, Unal, Basar and Karaaslan32], milk [Reference Jain, Tiwari and Akhtar33], moisture [Reference Nguyen and Tseng34–Reference Cheng, Hu, Zhu and Zhao37], oil in food [Reference Zhang, Ruan, Wang and Cao38], amount of salt and sugar in water [Reference Gharbi, Estrada, Garcia and Gil16], type of tissue [Reference Maenhout, Markovic and Nauwelaers39], determining the amount of phosphate and nitrate [Reference Harnsoongnoen40], and most importantly determining the type of solid or liquid [Reference Velez, Enano, Ebrahimi, Herrojo, Paredes, Scott, Ghorbani and Martin11] material are among the tasks carried out by sensors. One of the most important features of sensors in today's industry is that they are non-contact [Reference Baghelani, Hosseini and Daneshmand27, Reference Jain, Tiwari and Akhtar33] and non-invasive [Reference Mohammadi, Mohammadi, Demir and Kara2, Reference Kiani, Rezaei, Karami and Sadeghzadeh15, Reference Kiani, Rezaei and Fakhr24, Reference Abdolrazzaghi, Katchinskiy, Elezzabi, Light and Daneshmand30]. To achieve such factors, different techniques have been used to design them which includes parallel coupled [Reference Kiani, Rezaei, Karami and Sadeghzadeh41], phase variation [Reference Su, Enano, Velez, Casacuberta, Gil and Martin42], rat race coupled [Reference Herrojo, Velez, Enano, Su, Casacuberta, Gil and Martin43], spiral bandgap [Reference Nguyen and Tseng34], and near-field self-injection-locked [Reference Nguyen and Tseng34]. Almost all these methods seek to design sensors that can increase their sensitivity within a desired permittivity range. This is because a sensor that can detect liquids may not be able to detect solids and vice versa, but a sensor may be able to detect both types of matter [Reference Velez, Enano, Ebrahimi, Herrojo, Paredes, Scott, Ghorbani and Martin11] but usually such sensors have low sensitivity. Sensors that are able to detect fluid samples can only detect fluids within a certain range of permittivity. Sensors can be used in structures with other techniques including coplanar waveguide fed wearable antenna [Reference Kiani, Rezaei and Fakhr18] and GaAs monolithic microwave integrated circuit [Reference Cai, Wei, Wu and Wang44]. These combinations increase the applicability of using sensors.
One of the techniques used in the design of sensors is aperture coupled [Reference Gugliandolo, Naishadham, Neri, Fernicola and Donato36]. In this structure, an interdigitated capacitor in aperture coupled patch somewhat increases sensitivity. According to the needs of the industry, the use of material detection sensors using permittivity is widely used in the food industry, for example, the cavity technique is a method of interest to researchers in the petroleum industry, therefore, the sensors used in this industry are usually made by the cavity method [Reference Kiani, Rezaei, Karami and Sadeghzadeh15, Reference Yang, Xu, Yuan, Wang, Wu and Zhang45] or the amount of impurities and fat in milk was determined using the substrate integrated waveguide (SIW) technique. In this method, a combination of circular SIW with cavity was used and cow and buffalo milk were used as samples [Reference Jain, Tiwari and Akhtar33]. In [Reference Fu, Huang, Xiang, Chen, Gu and Wu46] two SIW re-entrant cavity resonators integrate longitudinally for determination of relative dielectric liquid samples for high Q-factor.
One of the prominent features of sensors is their ease of use; hence, in [Reference Omer, Shaker and Naeini29] a sensor of metamaterial-inspired for detection of the liquid samples was designed. The structure of the sensor consists of a simple microstrip line and a split ring. When the sensing location on the sensor is placed on the skin layer, it can measure the blood glucose level. It can be said that the most important feature of sensors is their sensitivity. There are different ways to increase the sensitivity of the sensor. One of the methods is to cascade the cells. This method is used in both microwave sensors [Reference Baghelani47, Reference Sorocki, Wincza, Gruszczynski and Piekarz48] and optical sensors [Reference Cheng, Hu, Zhu and Zhao37, Reference Tian, Li, Chew, Gunawan, Nguyen and Yi49]. For example, in [Reference Baghelani47] a microwave sensor with the method of single wire was designed and then in [Reference Cheng, Hu, Zhu and Zhao37] two structures of single wire were cascaded and increased its sensitivity. The use of high-frequency structures has a high Q-factor and increases the resolution, so the use of structures such as optical and millimeter wave helps to increase the Q-factor in the sensors [Reference Jung, Lim, Kim and Lee50].
In recent years, new techniques that are different from past works have been rapidly published to increase the important parameters of sensors including sensitivity and Q-factor, reduce their dimensions and cost, and be applicable to a wider range of permittivity. These methods include deep learning [Reference Hui, Zhou, Sharma, Conroy, Zhang and Kan51], image processing [Reference Guo, Wu, Liu, Wei, Yang, Yang, He and Zhang52], numerical method [Reference Molina, Giraldo and Vera17], orbital angular momentum [Reference Lin, Pan, Yao, Wu, Wang, Zhang, Ye, Xu, Yang and Wang53], and plasmon-based sensor [Reference Wang, Yang, Su, Wang, Peng, Gu and Zhou54]. Among all these techniques, the most widely used was the split-ring resonator (SRR) [Reference Abdolrazzaghi, Katchinskiy, Elezzabi, Light and Daneshmand30]. Resonators can create different frequency bands and by forming the field intensity, they can engage the samples, and by changing the distribution and field intensity on the resonance, frequency changes [Reference Guo, Wu, Liu, Wei, Yang, Yang, He and Zhang52, Reference Tu, Hu and Ding55]. Resonators can appear in different forms in the sensor structure. They can be coupled [Reference Sepulveda, Cervantes and Saavedra9, Reference Gugliandolo, Naishadham, Neri, Fernicola and Donato36, Reference Kiani, Rezaei, Karami and Sadeghzadeh41], open loop [Reference Navaei, Rezaei and Kiani12], or circular [Reference Gharbi, Estrada, Garcia and Gil16], T and L-shaped [Reference Zheng, Pan and Jiang13]. One of the most important types of resonators used in SRR is complementary split-ring resonator (CSRR) [Reference Wang, Liu, Xiong and Zou56]. These types of resonators are widely used in the field of sensors.
For sensors, features can be added based on their needs and applications, for example, flexible sensors [Reference Maenhout, Markovic and Nauwelaers39] can be used in certain spaces or sensors can be made by exposure to high temperatures [Reference Zhu, Tang, Guo, Gerald and Huang19, Reference Baghelani47]. The sensors with high sensitivity can be used for adjustable cancellation [Reference Cui and Ge57]. The important issue is what methods and techniques are needed to increase the sensitivity of sensors [Reference Cui and Ge58–Reference Navaei, Rezaei and Kiani61].
In this paper, a sensor with a Q-factor of 3544 and a sensitivity of 2.2% has been designed. The proposed sensor can be used for a variety of fluidics. The proposed sensor was simulated by the CST software by using samples with a dielectric constant in the range of 10–70, and then the fabricated sensor with samples having a combination of water and vinegar whose permittivity value varied from 59 to 77 was measured. The dimensions of the proposed sensor are 32 × 16 mm2 and it is low cost and it is able to sense small samples.
In the present paper, first, the sensor design method is mentioned and, in this section, the dimensions of the designed sensor with the simulated and measured results along with its equivalent circuit are examined. In the second part, the results of simulation and measurement of samples are investigated, and toward the end, a comparison between the research study carried out in this paper and earlier studies are tabulated.
Sensor design
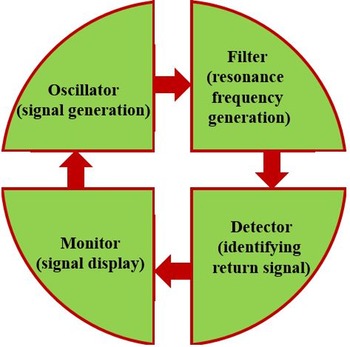
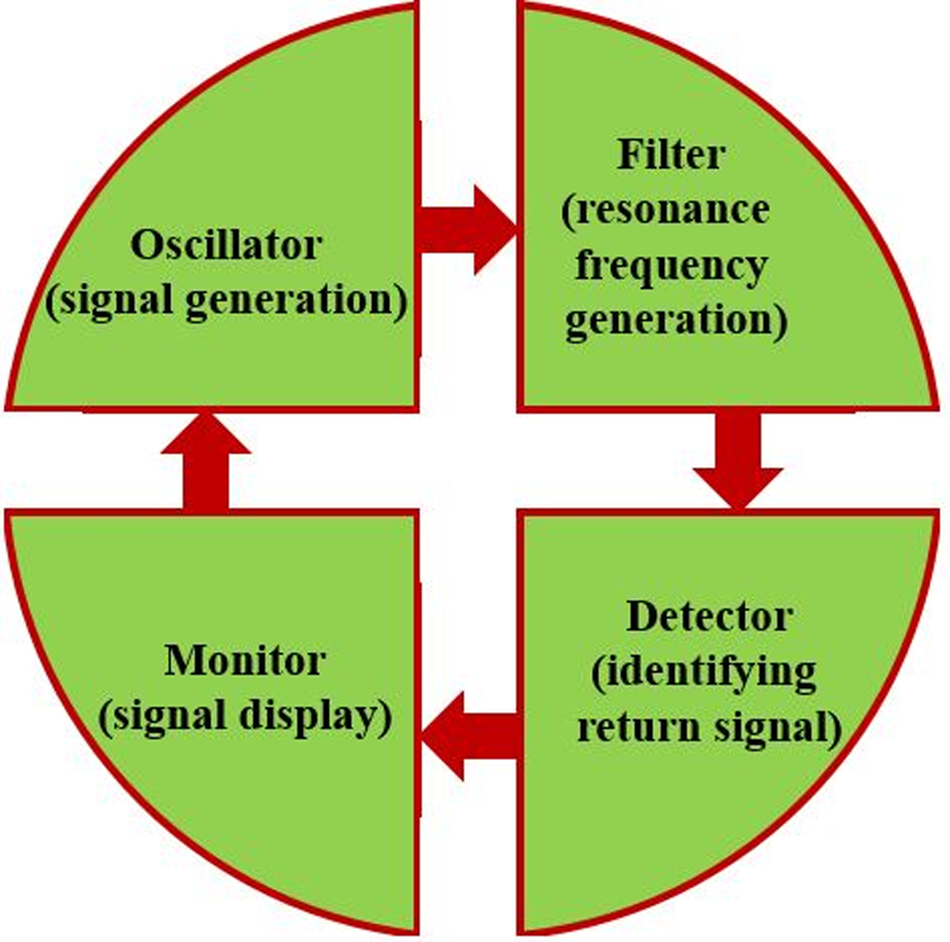
The block diagram of a sensor is indicated in Fig. 1. The schematics shown include an oscillator for creating a wave, a filter to create a resonance frequency, a detector to identify and investigate the return signal and monitor systems that are required for the system of measurement [Reference Velez, Enano, Ebrahimi, Herrojo, Paredes, Scott, Ghorbani and Martin11]. This type of architecture is presented as a sensor. For designing circuits of these four sections, there are many different structures that should be used for different needs and applications. In this paper, a sensor is designed that includes the signal generation section to generate resonance frequency and a detector.
Block diagram of a sensor.
The field of application of microwave sensors is very wide and they can be used in various food and medical industries. In the present case, a new method using a combination of two structures to increase the field strength and enhance the sensitivity in the proposed sensor design was used. In [Reference Ebrahimi, Withayachumnankul, Al-Sarawi and Abbott62] a square ring microstrip structure was used to create a bandstop filter. Therefore, in the proposed sensor, rectangular loop microstrip (RLM) can play this role. Also, in [Reference Othman, Sinnappa, Husain and Ismail63], parallel stubs were used and they were able to create more field intensity due to the coupling, and its symmetric bar chart-shape (SBCS) plays such a role for the proposed sensor. Eventually, the proposed sensor consists of an SBCS and an RLM. The SBCS is implemented by etch of special slot patterns in the microstrip line structure or it is created using a bar chart-shape structure. It indicates the properties of slow wave and rejection of microwaves in special frequencies which are similar to the structure of defected ground but no change has been made to the ground plane [Reference Zheng, Pan and Jiang13, Reference Liu and Yang64, Reference Kiani, Rezaei and Fakhr65].
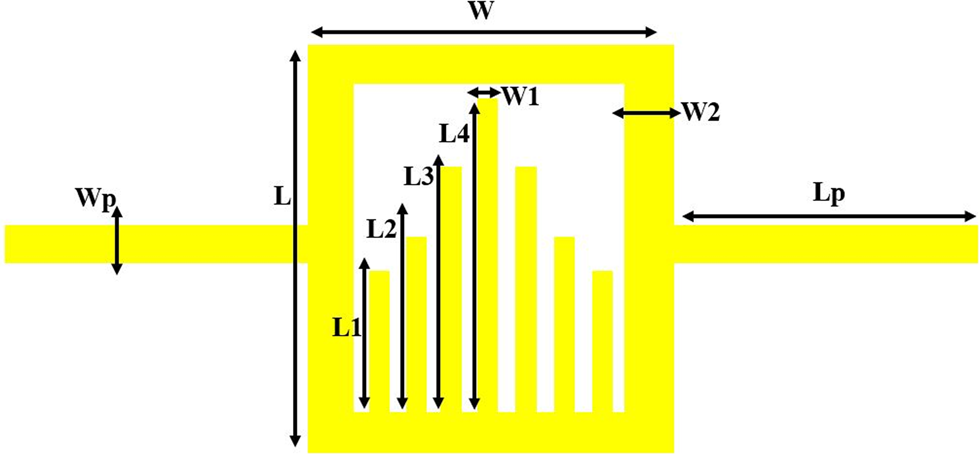
The SBCS of the proposed sensor includes stubs with different lengths, which are parallel to each other. The interaction between the stubs creates a field intensity and increases the sensitivity. For SBCS structures, the input impedance for odd and even modes is obtained using equations (1) and (2). The parameters θ 1 and θ 0 are the length of electrical short-circuit and the open-circuit stubs, respectively [Reference Zheng, Pan and Jiang13]. When a sample is placed on the sensing location of the sensor, the value of the impedance varies and the values of the capacitors of stubs change, as a result the field intensity is varied. The intensity depends on the change in the resonance frequency.
The sensitivity of the proposed sensor for types of fluidic samples is acceptable. The proposed sensor can be used for the samples with low and high relative dielectric values and indicates acceptable sensitivity.


The layout of the constructed sensor is demonstrated in Fig. 2 and the dimensions of the sensor parameters are seen in Table 1. The size of the designed sensor is 32 × 16 mm2. The RLM in the sensor creates a sharp insertion loss similar to that of a bandpass filter. The proposed structure shows a surface plasmon-based sensor and its effects on the intensity field [Reference Wang, Yang, Su, Wang, Peng, Gu and Zhou54].
Layout of the proposed sensor.
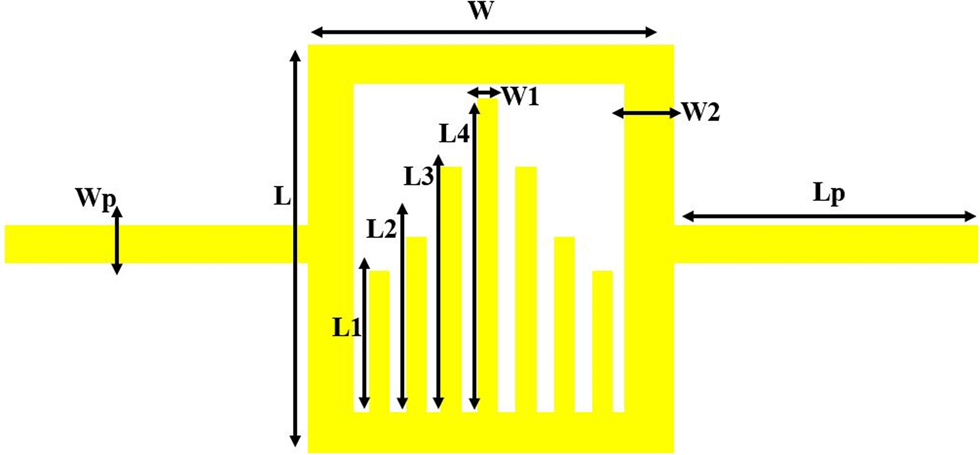
Dimension of the proposed sensor

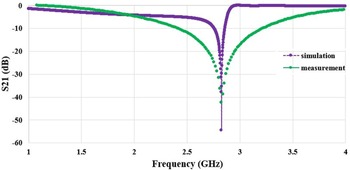
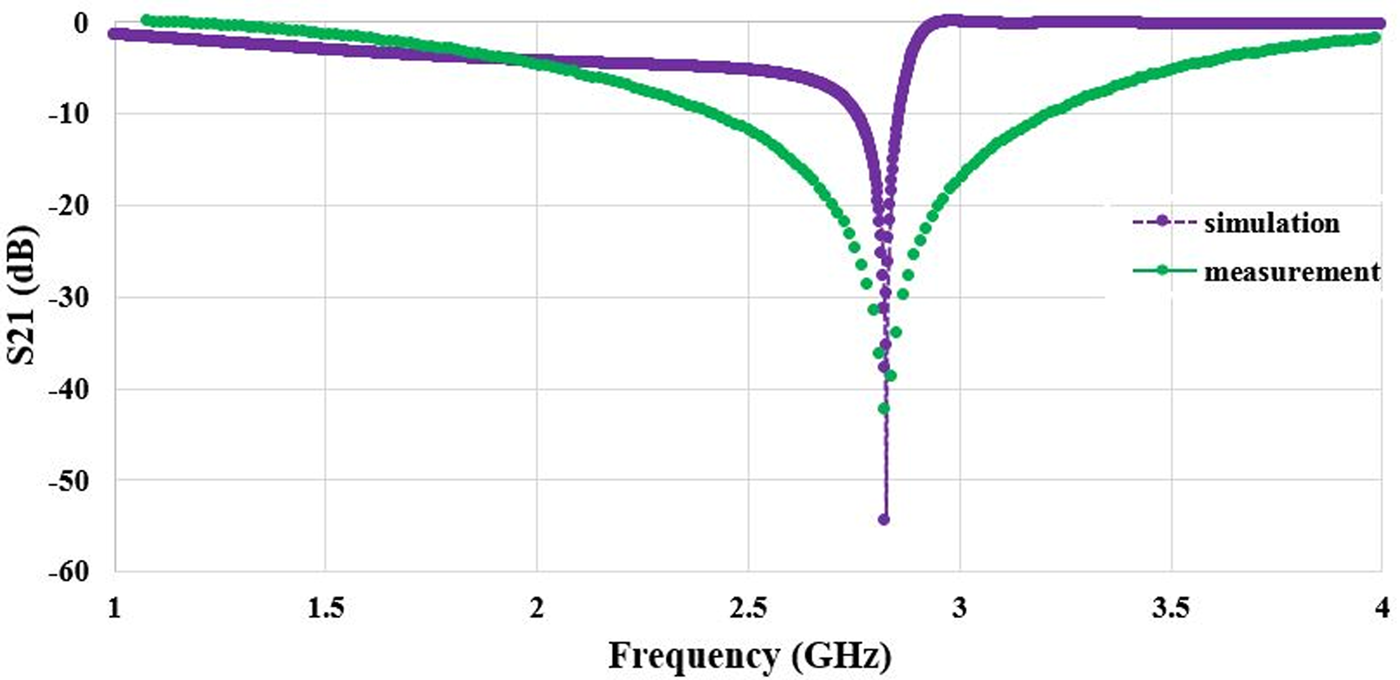
The proposed sensor is fabricated on an RO4003C substrate with a dielectric constant of 3.38 and a thickness of 32 mil and the results of the simulation and the measurement are shown in Fig. 3. The results indicate that insertion loss of the simulation and the measurement of the proposed sensor match with each other and the resonance frequency is 2.8 GHz. The designed sensor is a combination of the SBCS and the RLM. These parts increase the field intensity and interact with each other. Mismatch of simulation and results of measurement charts can be influenced by different factors, including soldering of connectors, measurement conditions, calibration, etc.
Insertion loss of the simulation and measurement of the proposed sensor.
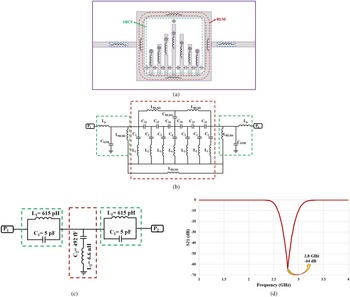
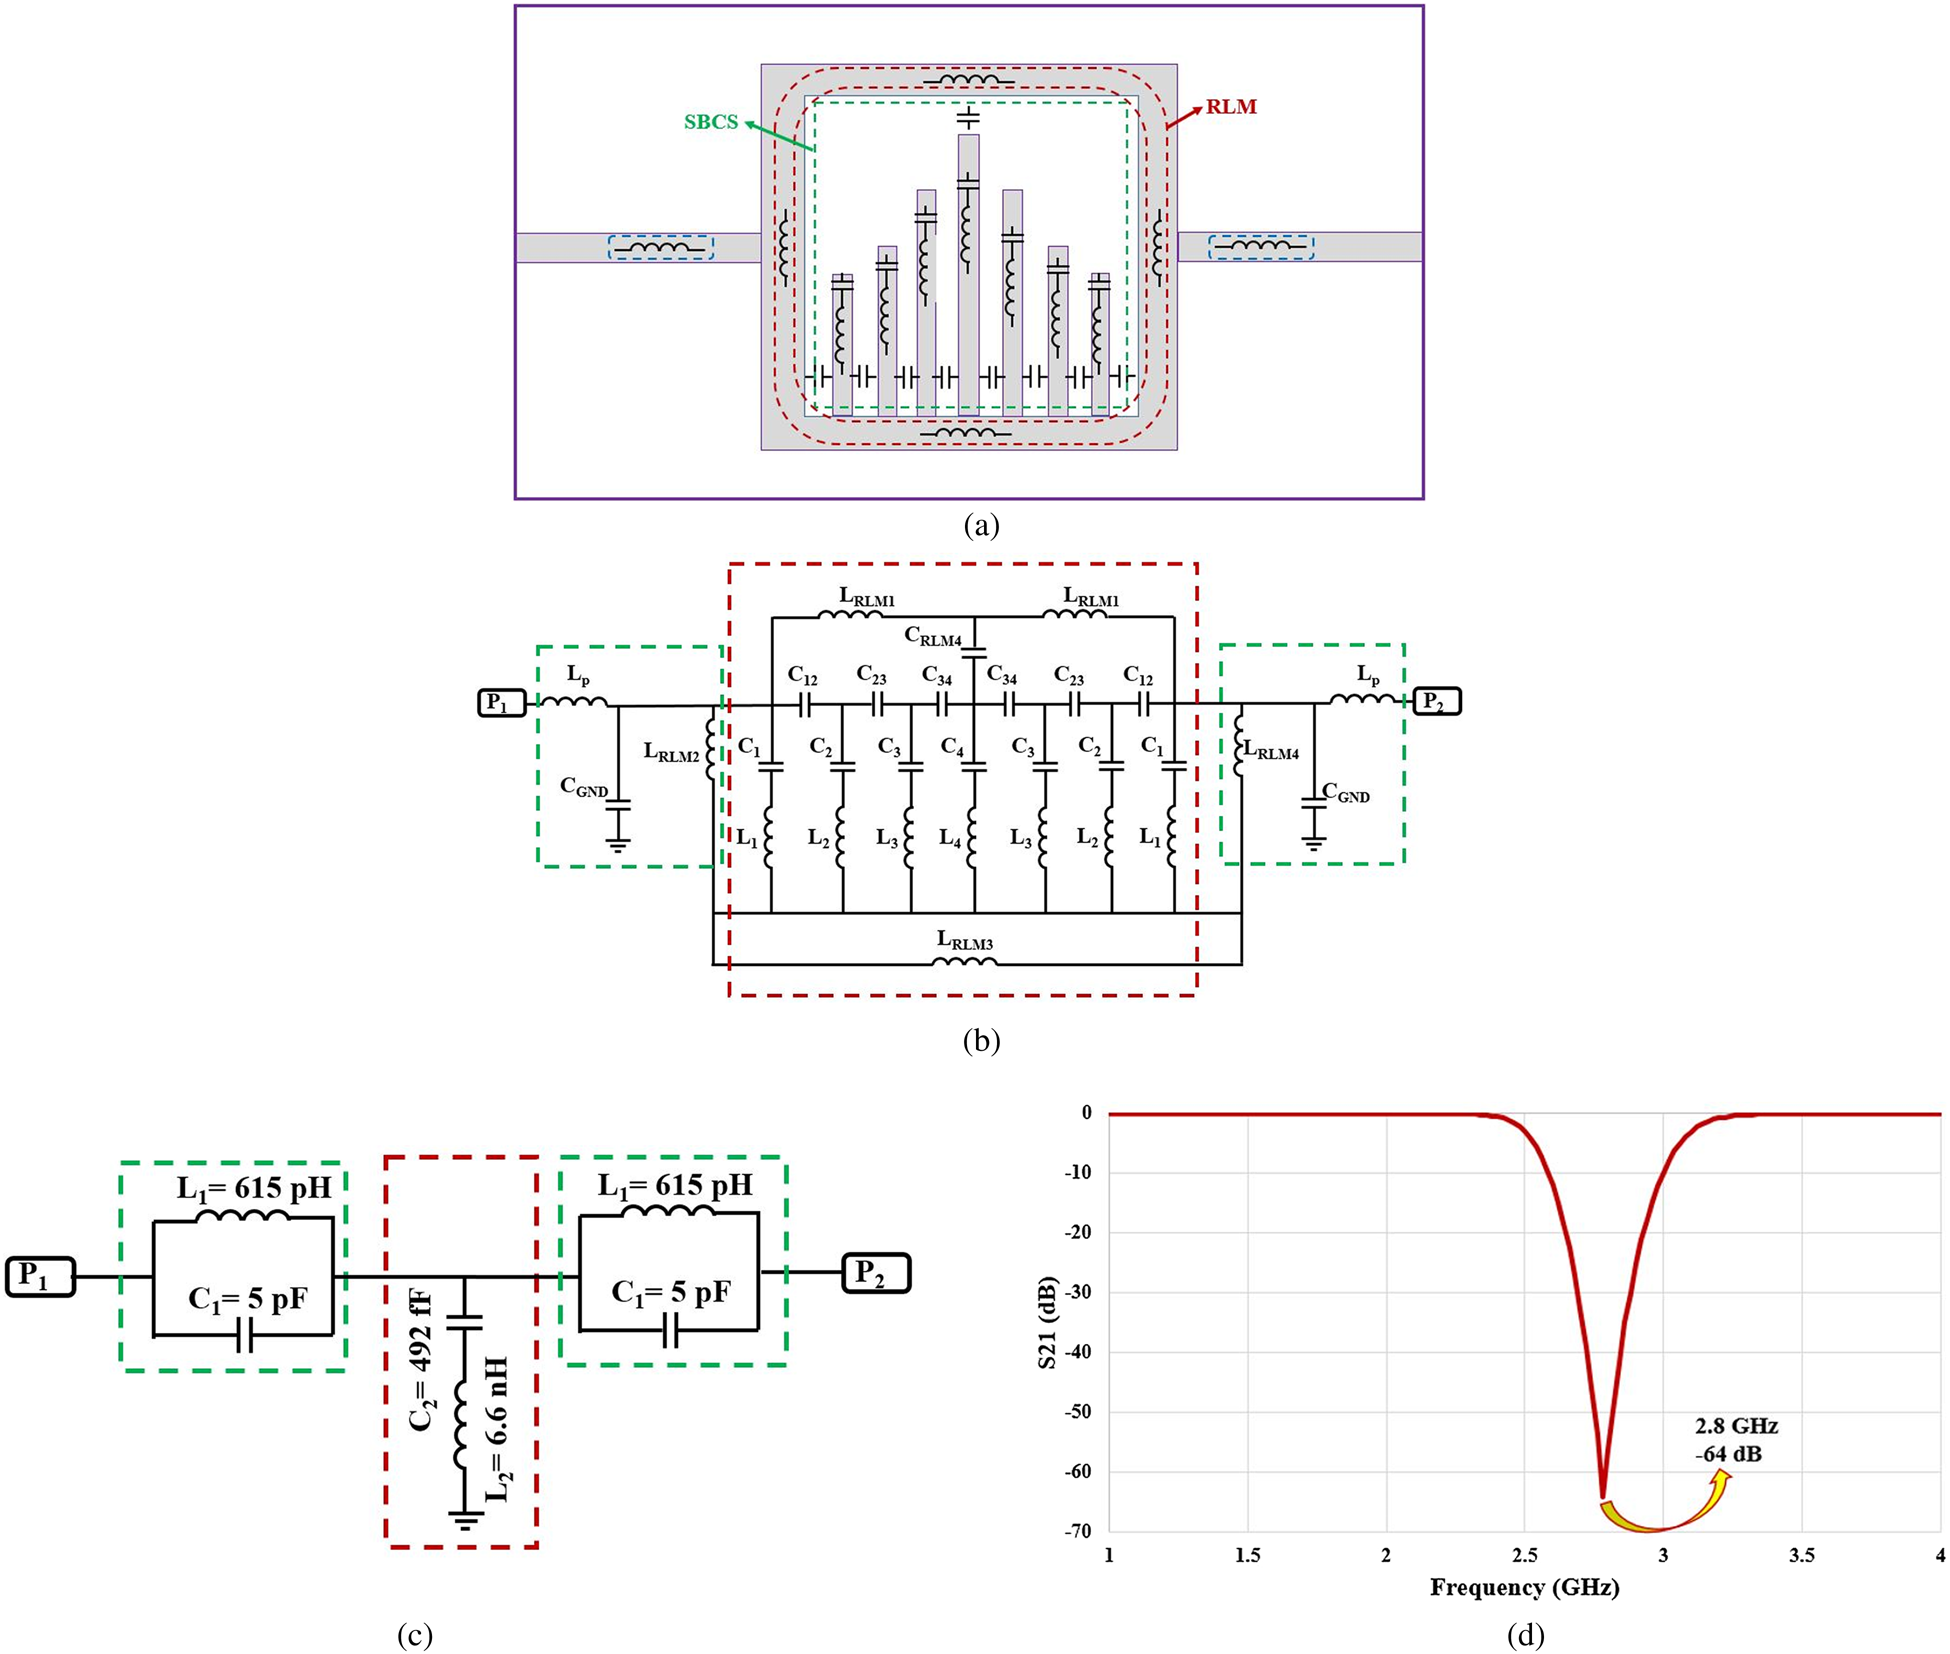
The SBCS part has a series capacitor and an inductor structure, while the RLM part has an inductor. Also, the middle stub in the SBCS has a communication capacitor with the RLM; it enhances the interaction between two structures so the field intensity increases. The equivalent circuit of the designed sensor is shown in Fig. 4. In this figure, the equivalent of the compact element of each part of the microstrip structure is shown, then its integrated circuit is indicated, then its equivalent circuit is summarized and quantified, and finally its insertion loss is drawn, and it can be seen that its resonance frequency matches with the simulation and measurement resonances. The proposed equivalent circuit is symmetrical so it can be halved in the middle. The new circuit can be divided into three sections. The first and third parts consist of C 1 and L 1, which are on both sides of the circuit that is used as a series tank circuit. The second part is the other elements in the circuit that can be used as a parallel tank circuit. Finally, the two series tank circuits and a parallel tank circuit that connect together can be summarized as a series tank circuit. In the other part of the circuit, the LRLM, LP, and also CGND can be considered as a parallel tank circuit, and the final composition will be structured. The final circuit was from the third order and was implemented using response type of the maximally flat method in the ADS software and its inductors and capacitors were obtained. When a sample is placed on the sensor, the field intensity varies, and as a result the values of the capacitor and inductor of the SBCS and the RLM change. As a result, the resonance frequency varies. Due to the large number of capacitors, the sensitivity of the sensor also increases.
Equivalent circuit of the designed sensor. (a) Equivalent circuit of different parts of the sensor. (b) The final equivalent circuit of the sensor. (c) Abbreviated equivalent circuit of the sensor. (d) Insertion loss of the equivalent circuit.
Simulation and measurement results
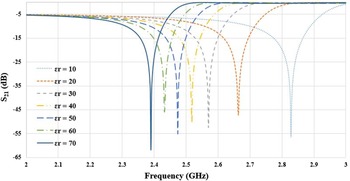
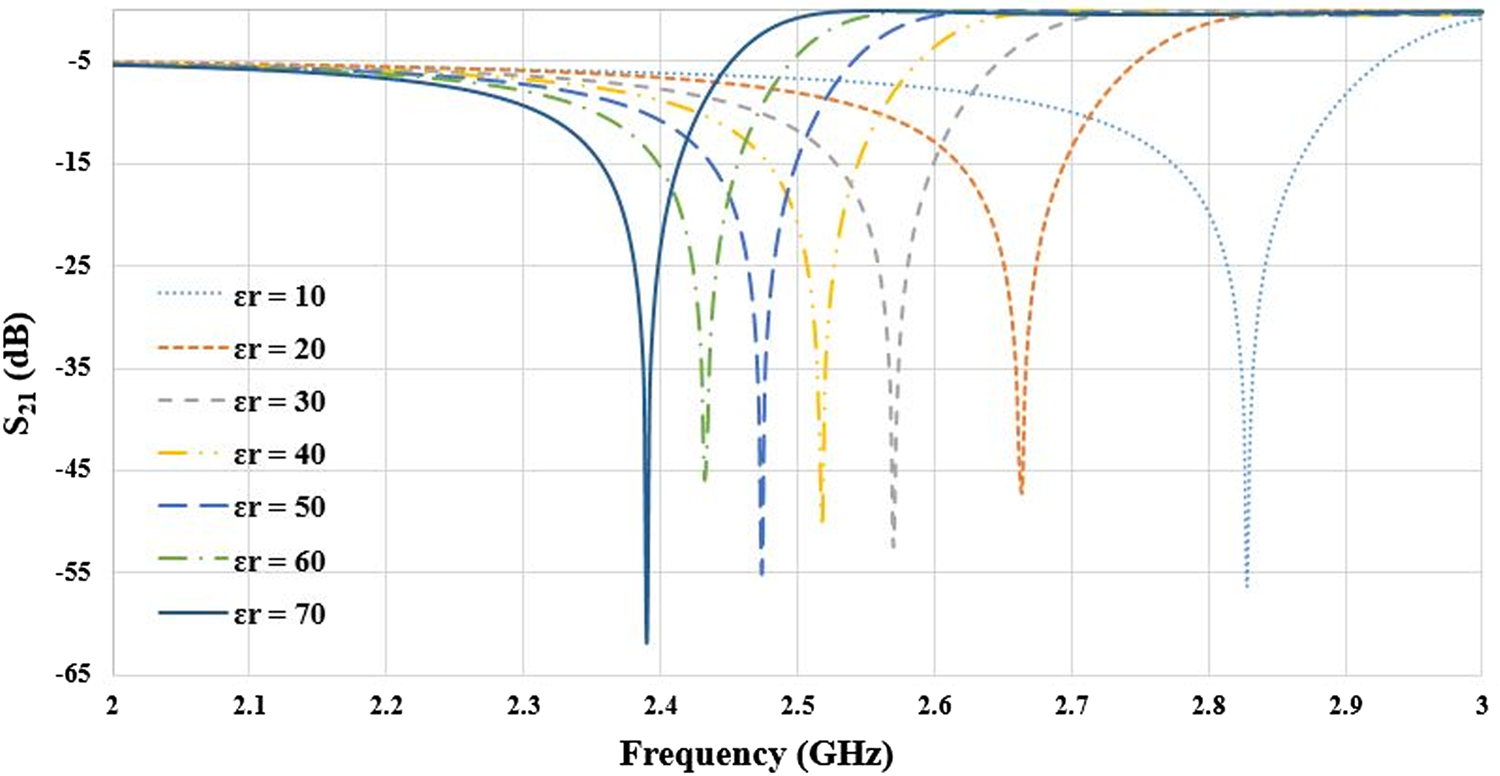
The designed sensor is simulated with seven samples with permittivity from 10 to 70. The permittivity range covers the fluidics. The insertion loss of simulation is seen in Fig. 5 and is indicated with changing permittivity from 10 to 70; the resonance frequency varies from 2.66 to 2.22 GHz, therefore, there is an acceptable sensitivity. To measure laboratory conditions, samples of vinegar–water solution were selected. The value of 40 cc of water was considered as the base value and then an amount of 3 cm3 of vinegar was added and a drop was used for measurement. Next, each time vinegar was added, the solution was measured, and the process continued until the volume reached 21 cm3. Then the prepared samples were measured by the field probe and their relative dielectric value was obtained. As a result of this experiment, the relative dielectric value of the samples is obtained from 59 to 77.
Insertion loss of seven samples in simulation.
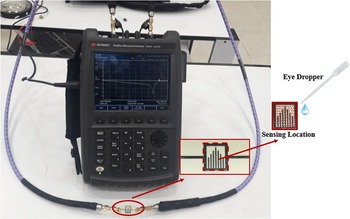
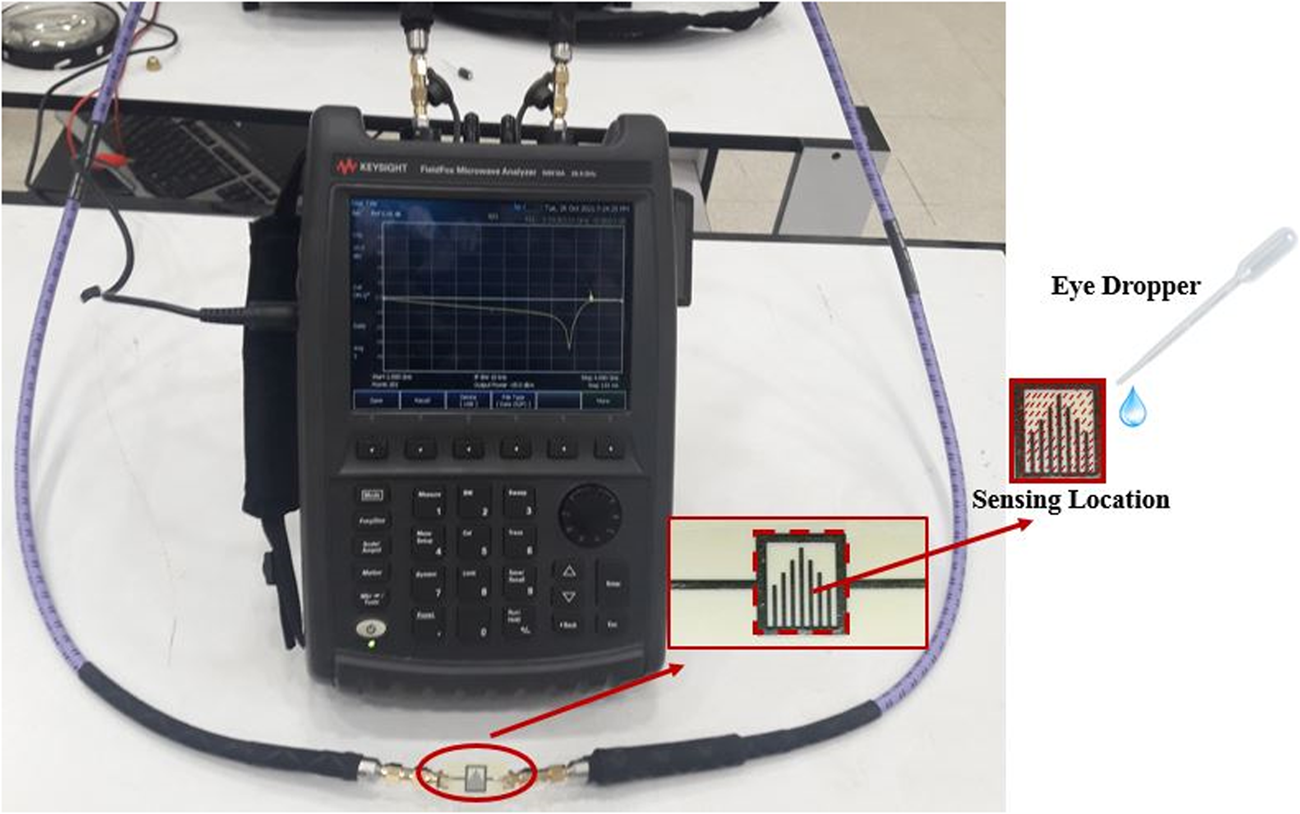
When the samples are placed on the sensor, the measured insertion loss causes the resonance frequency to shift to lower values. In other words, when the permittivity value increases, the resonance frequency shifts to a lower value. Fig. 6 shows the FieldFox Microwave Analyzer N9918A that performs the measurements. To measure under laboratory conditions, first the sensor is completely cleaned and then a drop of sample is placed on the sensing location using a syringe and the measurement is carried out. Next, the sensor is cleaned with a disinfectant solution. After the sensing location dries, the resonance frequency of the sensor after cleaning is measured in a state without a sample on it to ensure that its resonance frequency shows the same value of 2.8 GHz, then the next sample is placed on the sensor. This feature is one of the advantages of the proposed sensor, which does not require a holder or container for testing samples, and the sensor maintains its stability.
Setup test of fabricated prototype.
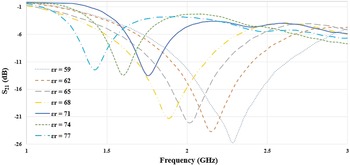
The results of measurement of seven samples of vinegar and when permittivity of the samples changes from 59 to 77 are shown in Fig. 7; the resonance frequencies varied from 2.3 to 1.4 GHz.
Resonance frequency of seven samples by placing on the fabricated sensor.
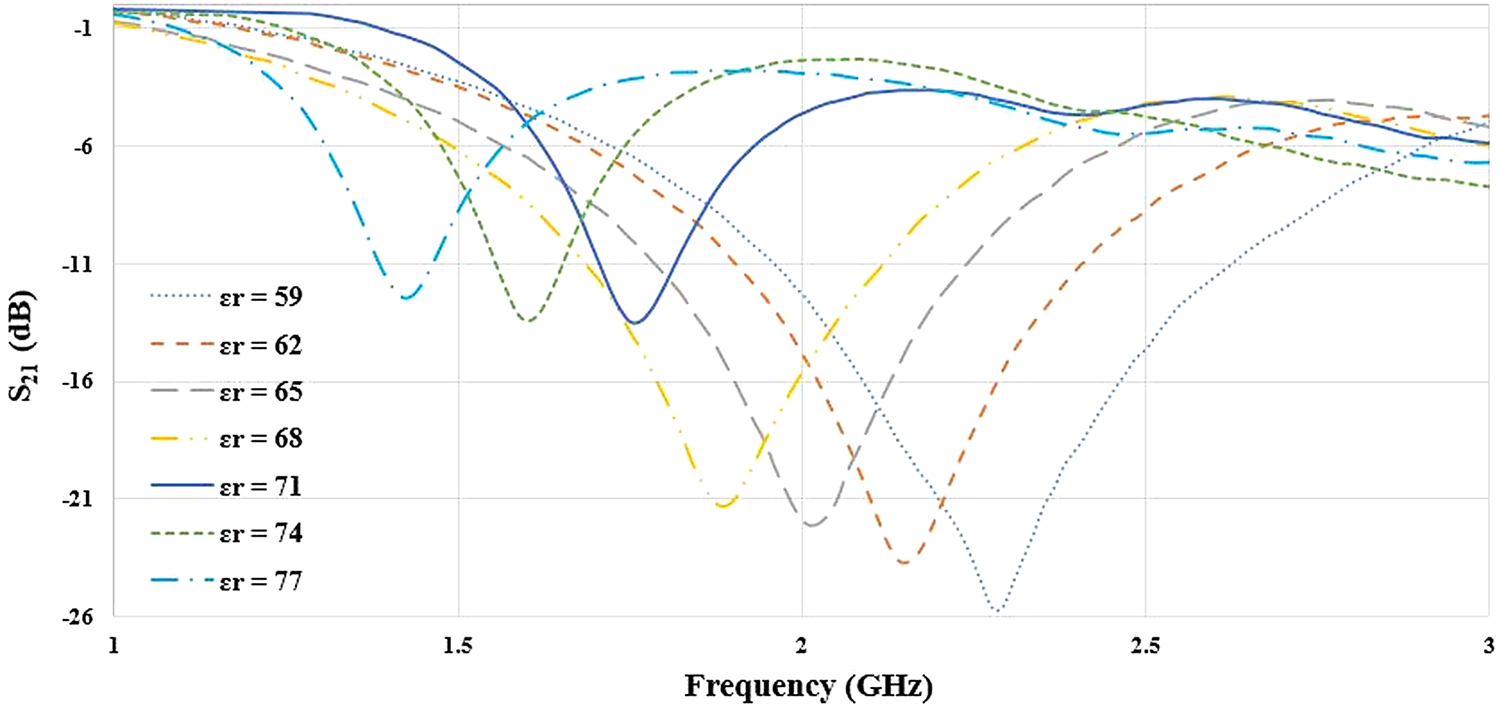
The reason for the difference between the results of Figs 5 and 7 is that the conditions of the simulation and measurement environment in the laboratory are different; in other words, the simulation environment is close to ideal conditions, while the laboratory conditions for measurement are far from the ideal conditions. However it should be noted that despite this difference between the simulation environment and the measurement environment, basic labor laws have not been violated, that is, with the increase of the relative dielectric value, the resonance frequency decreases.
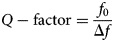
The Q-factor and the sensitivity are calculated using equations (3) and (4). As regards the resonance frequency of the free load sensor is 2.8 GHz and the 3 dB bandwidth is about 0.79 MHz, Q-factor is 3544 and the sensitivity is 2.2%.

In the proposed structure, due to different conditions between the simulation environment and the measurement, their results in Figs 5 and 7 did not match exactly. For example, the dielectric constant of 70 in Fig. 5 and 71 in Fig. 7, respectively, in the simulation and measurement diagrams, their resonance frequencies did not coincide with each other, which is due to the difference between the ideal simulation conditions and the laboratory environment for measurement. But despite this difference, both graphs did not violate the rules of the sensor, and as the dielectric constant value of the samples increased, their resonance frequency moved to lower values.
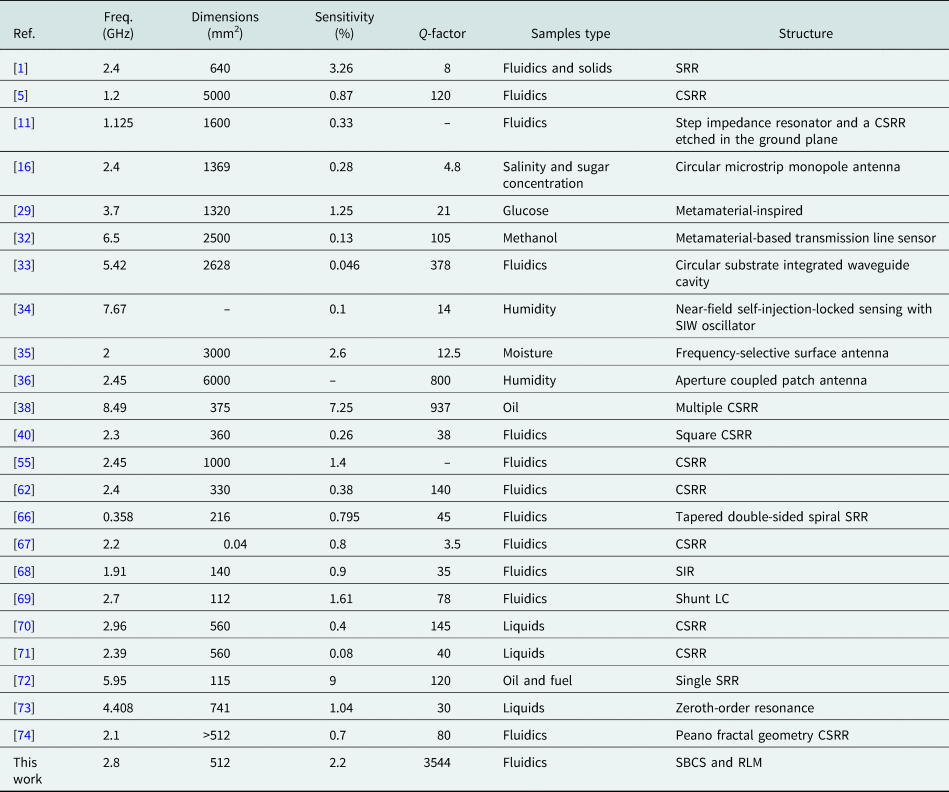
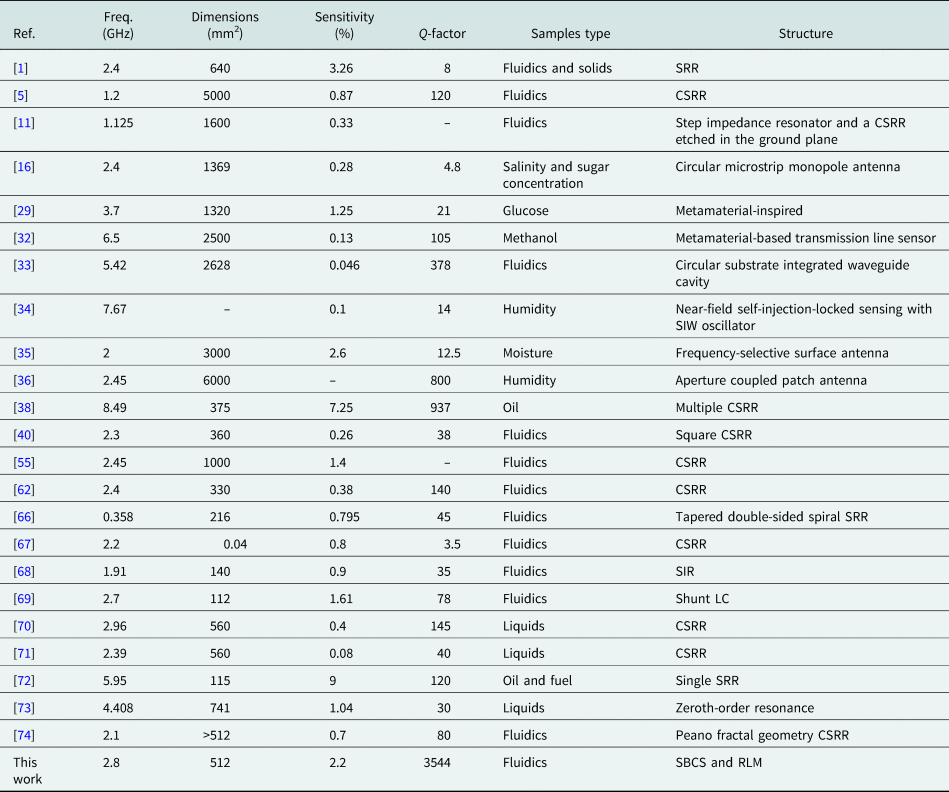
Table 2 shows a comparison between earlier studies and this research study. The results indicate that all parameters conducted on the proposed sensor are better than the earlier studies.
Comparison between the previous works and the proposed sensor
Conclusion
In this paper, a microstrip structure has been implemented which can sense fluidic samples. The designed sensor consists of an SBCS and an RLM. The interaction between the two structures increases the field intensity. When a sample is placed on the sensor, the distribution and the intensity of field vary, therefore, the resonance frequency is changed. The resonance frequency is 2.8 GHz and the dimension of the sensor is 32 × 16 mm2. The Q-factor is 3544 and the sensitivity is 2.2%. The samples used are vinegar combined with water. The results indicate that because of the change in the relative dielectric value to 18, the resonance frequency varies to 0.9 GHz. As the sensitivity of the proposed sensor is high it can be used for different types of fluids and even solids. In practice, the proposed sensor can sense the samples with low and high permittivity and shows acceptable sensitivity.
Acknowledgements
The authors acknowledge the Semnan University staff for their beneficial and professional help. The authors thank Amir Habibi for providing laboratory facilities for measurement. The authors also thank the esteemed editor and the reviewers for positive comments.
 Moein Navaei was born in Amol, Iran, in 1988. He obtained an M.S. in communications engineering from K.N. Toosi University, Tehran, Iran, in 2014. Currently, he is pursuing a Ph.D. in communications engineering from Semnan University. His research interests include invasive and non-invasive biomedical sensors, electromagnetics theory, antenna and RF passive components, biomedical engineering, wave propagation, microstrip filters and ultra-wideband bandpass filters, SIW, and microwave.
 Pejman Rezaei was born in Tehran, Iran, in 1977. He obtained a B.S. in electrical and communications engineering from Communication Faculty, Tehran, in 2000, and an M.S. and Ph.D. from Tarbiat Modares University, Tehran, in 2002 and 2007, respectively. He is currently a professor in Semnan University, Semnan, Iran. His current research interests are electromagnetics theory, theory and design of antenna, biosensor, metamaterial structure, reconfigurable antennas, and satellite communication.
 Sina Kiani was born in Isfahan, Iran, in 1991. He obtained an M.S. in communications engineering from Semnan University, Semnan, Iran, in 2018. Currently, he is pursuing a Ph.D. in communications engineering from Semnan University. His current research interests include invasive and non-invasive biomedical sensors, microwave measurement, complex media, antenna and microwave engineering, metamaterials, and bioelectromagnetics.