Introduction
Public investment represents a vital component of the state's effort to provide collective goods enhancing public welfare. This rationale was already well articulated by Adam Smith, who emphasized the need to provide public goods serving the interests of the community as a whole (see: Galbraith Reference Galbraith1967; Adelman and Taft Reference Adelman and Taft1988; Keman Reference Keman, Eliassen and Kooiman1993). Under the aegis of Keynesianism these ideas had strong support after the Second World War, particularly in Europe. Both the lost decade of the Great Depression and the need for post war reconstruction made state intervention in infrastructure renewal (roads, rails, airports, ports, water works, etc.) imperative and it became a lasting concern. Another factor was the emergence of the welfare state. The development and extension of educational, health care, housing and social welfare programs and the growth of the governmental apparatus itself occurred widely, if not quite evenly, across the OECD world (see: Flora and Heidenheimer Reference Flora and Heidenheimer1981) and gave the idea of public investment a new dimension.
In the process public investment came to be seen as crucial not only for the development of the domestic economy, but also in a more political definition of public investment (Castles Reference Castles1998: 27–32). Left-to-Centre party governments originally embraced this new policy trajectory by the promotion of public ownership in housing, transport and public works and infrastructure and public works facilities. In short, in most countries public investment became a core policy of the modern democratic state and an important component of the public budgets in most OECD democracies (Mullard Reference Mullard1987; Sturm Reference Sturm1998; Castles Reference Castles2007). For example, during the 1970s the average level of public investment grew to 4.5 per cent of GDP or 12.9 per cent of total government outlays by the measure used in this paper: Public Investment as a per cent of Total Outlays of General Government measured in constant $. However, economic developments during the 1970s – oil crises, the dissolution of Bretton Woods, the emergence of stagflation (see: Rose and Peters Reference Rose and Peters1978; Scharpf Reference Scharpf1991) – led to new ideas regarding the role of the public economy: a farewell to Keynesianism and the emergence of Reagonomics and Thatcherism urging for a smaller state and monetarist policies meaning less interventionism and less public spending (Maddison Reference Maddison1991).
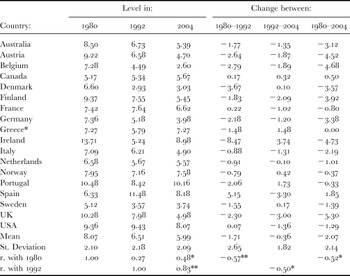
Since the 1980s, public investment spending across the OECD-world has dropped 25 per cent, with change roughly twice as rapid in the first half of this period as in the second. Table 1 shows that the change in the cross-national distribution of spending levels has been considerable too. The correlation coefficient between expenditure levels between 1970 and 1980 is only 0.38 and between 1970 and 1992 is 0.16. In other words, someone observing the expenditures on public investment in 1970 would scarcely have recognized the expenditure landscape of the 1990s and later. Moreover, the bi-variate relation between the level of public investment in 1980 and subsequent change in respectively 1980–1992 and 1980–2004 is −0.57 and −0.52, indicative of a contagious disease seemingly spreading across the OECD world (see also: Sturm Reference Sturm1998: 30ff). In Table 1 the levels and change of public investment are reported for the countries included in the analysis.Footnote 1 The major questions to be explored in this paper are therefore: How and why has public investment expenditure declined over the final decades of the twentieth Century? What factors can account for the cross-national variation in public investment?
Public Investment in 18 OECD democracies 1980–2004

Explanation: Level of Public Investment as percentage of Total Outlays of General Government. Δ = Change is absolute difference between t – [t-1]. Correlations are Pearson Product Moment Coefficients (*/** significant at 0.05/0.01) Source: OECD 2005 (National Accounts; Volume 1) and 2006. Greece*: 2004 is 2002.
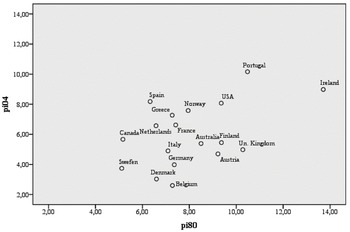
The pattern of convergence, that is becoming more similar in spending on public investment expenditures, can be illustrated by inspecting the measures of dispersion: Table 1 demonstrates that both the mean and the standard deviation of the levels in 1980 and 1992 and subsequent change become less over time. The convergent pattern is a mix of temporarily ‘catching-up’ by so-called laggards in economic development such as Portugal and Spain, and strong reduction by originally bigger spenders in this policy area such as Austria, Finland, Ireland, and Great Britain. Yet, as Figure 1 demonstrates there remains considerable cross-national variation among the countries as to how expenditures on public investment developed (the coefficient of variation in 1992 and 2004 is 0.33 and 0.35 whereas in 1980 it was 0.25). Canada, Greece and the Netherlands experience little change although their 1980 levels were already comparatively low. Conversely a number of countries with lower expenditure levels in 1980 also show higher rates of change than others. What drove these developments in public investment?
Comparing Levels of Public Investment: 1980–2004
Based on data from Table 1. pi80 and pi04 representing Public Investment in per cent of Total Outlays of Government in 1980 and 2004. Scatterplot represents Pearson Product Moment Correlation: r = 0. 48* (significant at 0.05).

2. Rates of public investment: Trends and developments 1980–2004
It is surprising to note that there are few comparative studies that analyse public investment as a public policy function of the state in the developed (OECD) world. This is particularly the case for comparative studies over time which analyse public expenditures on investing in society (but see: Aschauer Reference Aschauer1993; Sturm Reference Sturm1998: Chapter 3). Public investment is simple to define but complex to measure. International agencies – like OECD – list under public investment expenditures the costs to acquire and to replace productive equipment by the state. This aspect, the replacement of capital goods, is often overlooked. Yet, renewal of, for instance, the physical infrastructure is an essential part of public investment (Bannister and Berechman Reference Banister and Berechman2000). It should also be noticed that some of these expenditures do not always show up under the heading ‘Gross Fixed Capital Investment by Government’ (i.e. the definition used by OECD following SNA1993; recall Note 1). In addition it should be noted that public investment programmes are more flexible in terms of political decision-making since it often concerns stand-alone projects more often than not fixed in time (unlike welfare benefits and education or other types of so-called human resource investments).
Public investment concerns thus direct gross capital expenditures by public authorities for both maintenance and new projects (see the definitions used in the annual National Accounts of OECD 2006: Volume 2). These expenditures do not cover specific investments by state agencies nor earmarked transfers within the so-called functional categories as defined by means of the COFOG classification (see also: Fraser and Norris Reference Fraser, Norris and Castles2007: 50). Hence, whether or not the capital expenditure is used by private economic actors or spent by so-called Public/Private Partnerships (see: OECD 2003) is irrelevant. Our focus is on what the state spends on investments as a separate public activity (see also: Sturm Reference Sturm1998). Hence, in this paper the dependent variable: public investment is measured as the level and change of public sector expenditures on investment as per cent of Total Outlays by General Government as reported in OECD National Accounts. This measure allows for comparing rates of public investment cross-nationally as well as across time and is collected by one agency: OECDFootnote 2.
On average the levels of public investment have decreased by 2.1 per cent since 1980. In a few countries the downward trend is limited and tends to become stationary (like in Canada, Greece, Norway and Portugal). However, in most cases the levels in 2004 are considerably lower than before (except for Spain). This is especially the case for Austria, Belgium, Finland, Ireland, and Great Britain. In these countries the growth of public investment peaked during the 1970s whereas in other cases this occurred earlier. Ireland can be seen as an economic laggard like some South European countries, however catching up earlier and also decreasing its rate of public investment earlier. Overall Table 1 shows that public investment has been decreasing ever since the 1980s: the sharpest decline taking place during the 1980s (−1.71 per cent) and the level 2004 is on average 25 per cent lower than it was in 1980. Hence, it appears that investing in society is presently less a policy priority than it used to be in the OECD world (Armingeon and Beyeler Reference Armingeon and Beyeler2004: 226ff).
In particular the big spenders on the European continent and to some extent Anglo-Saxon nations with a tradition of a strong focus on providing collective goods by means of public investment display this downward development. The cross-national differences are further illustrated in Figure 1 and demonstrate that the convergence in public spending on investment has a varied pattern: one group appears to reduce public investment in conjunction with the development towards smaller government, another group (mainly Southern Europe) is still on its way to expand on public investment, and a number of cases is in between the two: neither decreasing nor growing strongly. Ireland is different in this respect: it shows the strongest decline, but also had the highest levels of public investment in 1980.
In this paper two explanations as to what drove this development in public investment will be elaborated and scrutinized:
The perceived need for fiscal stringency is potentially reinforced by the EMU requirements in the 11 member states after 1992 (e.g. Clarida and Findlay Reference Clarida and Findlay1994), on the one hand, and in view of the emerging policy legacies of higher levels of Total Outlays of Government before 1980 mainly due to developing welfare states, on the other hand. Both factors will be examined, since they appear important for explaining not only the lower levels of public investment, but also the converging trend towards 2004 (Budge et al. Reference Budge, Keman, McDonald, Pennings and Keman2002; Castles Reference Castles2007).
The second explanation concerns the argument that since the 1980s an ideological swing in many party systems has emerged demanding budgetary cut-backs within the context of an overall wish for smaller government. This has induced differential responses by party government – depending on the relative strength of the Left and Right in government – and may well have affected the level of public investment (see for example Roubini and Sachs Reference Roubini and Sachs1989; King and Wood Reference King, Wood, Kitschelt, Lange, Marks and Stephens1999; Self Reference Self2000). The first explanation is driven by ideas embedded in fiscal politics (see also: Rose and Davies Reference Rose and Davies1994) including the EMU factor, whereas the second one is close to the ‘Politics Matter’ approach (e.g. Sturm Reference Sturm1998: 36; Keman Reference Budge, Keman, McDonald, Pennings and Keman2002). Both explanations will be examined to account for the change in public investment expenditure. First we will look into the budgetary politics within the OECD democracies.
3. Big Government and Fiscal Policy-making
A major theme that has emerged since the 1980s is the political and ideological drive for a smaller state, on the one hand, and the fiscal pressures that were viewed as detrimental to sound public finances within a mixed economy, on the other hand (see for example: Saunders and Klau Reference Saunders and Klau1985; Lybeck and Henrekson Reference Lybeck and Henrekson1988; Mullard Reference Mullard1987; Keman 1993; Pierson Reference Pierson and Pierson2001; Castles Reference Castles2004). It is important to note that – contrary to what many hold – the ideas underlying the concern regarding big government is not to reduce the welfare state only, but rather the thrust of this literature is to reduce the overall level of government outlays in favour of revitalizing the market economy. Does this argument also imply that by cutting back public investment is victimized in the process?
Fiscal policy formation within the advanced democratic world is increasingly discussed in terms of the fiscal size of the public sector and its ramifications for economic development. At present this type of political discourse promotes less state intervention, smaller government and increased outsourcing of its functional assignments through the market. This view on the state appears popular in Europe of late. Public investment is then an easy target for reduction of its expenditures or minimizing it as a public policy: It is politically less visible for the electorate and the effects of downsizing expenditures are more diffuse than is the case for welfare entitlements (Freeman and Alt Reference Freeman, Alt, Janoski and Hicks1994; Sturm Reference Sturm1998). Another strand of thought points at the limits of the tax state and the related effects in terms of rise of public debt (Rose and Karran Reference Rose and Karran1987; Oxley and Martin Reference Oxley and Martin1991). Both arguments point in one direction: less fiscal pressure by the state is better for society in general and the market economy in particular. In other words: less government and more public/private co-governance would be beneficial for society (OECD 2003). The thrust of these arguments is that the changing pattern of public investment and its present level can be understood as a consequence of fiscal constraints due to policy-making that is aiming at a smaller state in order to remedy the growing imbalance between the public and the private sector of the economy (see: Maddison Reference Maddison1991: 185–190; OECD 2005).
At the same time, another dimension has entered this debate: the growing role of trans-national modes of regulation of economic activity. The European Union has become a salient factor for policy-making in most European countries (Zürn, Reference Zűrn2000; Hooghe and Marks Reference Hooghe and Marks2004). The creation of the single market in 1986 and the Maastricht criteria for membership of the European Monetary Union (EMU) had the effect of higher mobility of labour and capital (thereby influencing the national tax base), on the one hand, and of limiting the option of deficit spending and debt financing by the (national) states, on the other hand (Apel, Reference Apel2002: 147ff).Footnote 3 In fact a ‘trilemma’ developed since the 1980s between the simultaneous pursuit of policy goals of income equality, employment and a balanced budget (Iversen and Wren Reference Iversen and Wren1998). This socio-economic policy profile used to be a cornerstone of, in particular, social democratic parties in government in Scandinavia and the European continent (Scharpf Reference Scharpf1991). Hence, the EMU requirements can be considered as a new political datum affecting this trilemma in the 11 polities in our data set (and also to some extent Denmark, Great Britain and Sweden being members of the EU). It seems plausible to expect that this supra-national arrangement is relevant for understanding developments of the fiscal room for manoeuvre of these member states (Beach Reference Beach2005).
In sum: both the political debate on big government and the economic rationale for less public spending and concomitant size of public sector appear to have altered since the 1980s. An additional factor for change appears to be the introduction of the EMU requirements in the early 1990s (see Footnote 3). If correct then it can be expected that the changing fiscal performance has subsequently affected the reduction of public investment after 1980 and reinforced it after 1992. Three variables are used to examine this development towards smaller government: one, total outlays of government – representing the size of government (i.e. public sector); two, gross public debt – indicating the long term burden of the state (and conducive to a policy legacy); and, three, deficit spending – showing the short term effects of changed policy priorities (for example to match rising financial demands due to higher rates of unemployment). In addition, both the inflation rates (being part of the EMU requirements) and total expenditures on social welfare – as a possible cause of crowding out other, less politically sensitive and easier to alter public expenditures – will be examined.
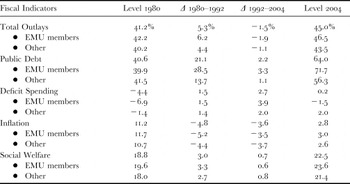
In Table 2 we have presented these fiscal indicators measured as change (in per cent GDP) during the 1980s and after 1992 (N = 18) and also separately for the group EMU-member states (N = 11) and the non-members (N = 7). This allows for comparing the shifts over time and between the EMU members and others. According to the debate on the fiscal state and the role of the EMU it is expected that the changes will become visible for all countries and for the EMU group in particular during the 1990s.
Parameters of Fiscal Policy Performance in 18 OECD democracies 1980–2004

Note: Data are derived from Economic Outlook Data Base and from Armingeon et al. Reference Armingeon, Leimgruber, Beyeler and Menegale2006. Δ = Change as absolute difference between first and last year mentioned in per cent of GDP.
Table 2 shows that there is indeed a difference between the 1980s and 1990s in terms of fiscal performance: the average growth in total outlays of government has been arrested or is decreasing but less so in Southern European countries. Public debt shows an opposite development: it has grown by 21 per cent of GDP during the 1980s and this continued into the 1990s albeit at a much slower pace than before. The South European countries are to some extent different from the other EMU members: on average public debt is 87.1 per cent in these four countries of which Greece and Italy are most culpable. Yet, deficit spending is almost reduced to a balanced budget in most countries in 2004, in particular in the EMU-area. Social welfare expenditures, however, kept growing everywhere but for Ireland and the Netherlands (Castles Reference Castles2004). South European countries are still catching up: between 1980 and 2004 their growth in social welfare spending is 8.5 per cent, whereas the change of the other countries is around 3.6 per cent of GDP. All this indicates that the growth of (big) government has indeed been arrested in the most OECD countries under review here. Finally, note that in particular during the 1990s in most cases the effects of fiscal stringency becomes particularly visible (including on Social Welfare). It appears that the fiscal policies pursued by most governments were more or less in place during this decade and have most likely contributed to the established levels of government outlays in 2004.
Table 2 also shows that the difference between EMU member states and others is small but nevertheless meaningful – in particular regarding public debt. This is also the case for the inflation rate. This third component of the EMU requirements went down considerably everywhere and is 3 per cent or lower in 2004 (on average for all cases). It is plausible to suggest that the EMU requirements, as agreed upon in Maastricht and reinforced in Amsterdam (1997), have made a significant difference for the EMU-members. Although all countries under review here have followed a more or less similar trajectory as regards their fiscal development, the EMU member states have produced a stronger change of their fiscal attitude. In fact the fiscal performance of the EU members – many of these having been big spenders before up to the 1980s – has become more similar to other OECD-members.
To conclude: whatever way one looks at the parameters of fiscal policy performance listed in Table 2 the overall message has been that fiscal stringency occurs everywhere, but often more prolific when a country is member of the EMU group. Finally, Table 2 shows that total government outlays and related fiscal parameters grew less than before (particularly since 1992) and the question is therefore to what extent this development towards fiscal contraction has affected the change and present levels of public investment.
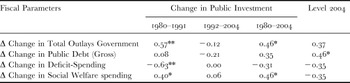
An answer can be found by inspecting to what extent the changes in fiscal performance (as represented by total outlays, public debt and deficit spending) are associated with change in public investment. We expect that if Total Outlays of government is being downsized, and its expenditures on non-welfare functions in particular, that public investment is a likely victim for reduction. In Table 3 we report the correlations between these indicators of fiscal performance and the change in public investment expenditures. As we know from Table 1 and 2 there are differences between the 1980s and 1990s and therefore the correlates for both decades are reported separately. In addition the results for the expenditures on public investment in 2004 are reported for we expect that the changes in fiscal performance will also affect these.
Correlations between Public Investment and Fiscal Performance 1980–2004

Note: see Table 2. Correlations re. Change variables match periods mentioned; re. level it concerns only Change 1980–2004. N = 18. All are Pearson Product Moment Correlations. * = significant at 0.05; ** = significant at 0.01. Total Outlays of Government are measured minus Public Investment expenditures.
First of all it is clear that the association between change in total outlays and public investment rates is positive, that is to say: reducing the overall budget coincides with a decrease in public investment expenditures (during the 1980s, but not after 1992 as expected). In fact, we observe a reduction of public investment expenditures (25 per cent less than in 1980; see Table 1) whereas total government outlays still grow by 4.3 per cent (see Table 2; except for Ireland, Norway and the Netherlands; Castles Reference Castles2007). The same pattern is also apparent for deficit spending up to 1992, but not for public debt where increases are related to higher levels of public investment in 2004. Although the correlations are moderate they are nevertheless sending the same message for the whole period under review: fiscal stringency – as presented in Table 2 – appears to be conducive to lower levels of government expenditures. Yet, how exactly this has affected public investment needs still to be analysed.
Second, the period 1992–2004 is different from the overall pattern. This is by and large caused by the different pattern of public debt and deficit spending of the South European nations. Whereas the other nations reduced their high levels of gross public debt further, avoiding deficit spending in order to develop a balanced budget during this decade, the Mediterranean countries showed an increase in public debt of 12.5 per cent of GDP surpassing all other countries. Likewise deficit spending went up with 9.1 per cent of GDP in these countries. All in all, bearing in mind the modest correlations, it is plausible to suggest that the change of public investment expenditures has been contingent upon the developing fiscal performance since the 1980s. More importantly: it appears to be a trend and not an incident.
Fiscal developments in these 18 OECD democracies after 1980 have influenced both the level and development of total outlays of government and in turn may have affected the rates of public investment. At least two factors appear in play: the political discourse promoting smaller government has become visible in fiscal contraction (Cf. Self Reference Self2000). This development has in part been reinforced by the introduction of the EMU requirements that has induced a converging pattern of fiscal performance towards the levels of the non-European states. The public investment rates in the 1980s are clearly converging to a new pattern that becomes a more or less steady pattern during the 1990s (recall Table 1: the negative relations between the original levels and subsequent change demonstrate this). One of the reasons may well be – in addition to fiscal developments – the effects of a changing political climate as regards big government and the role of partisan politics in government.
4. Politics and Public investment
Public investment as a public policy has been contested in two ways. One, as part of a broader issue: how much state investment would be sufficient for society, and two, should public investment be a structural or a temporary feature of public policy? Public investment expenditures indicate the extent to which the contemporary state invests in society, in particular for developing and maintaining the infrastructure of a society (Adelman and Taft Reference Adelman and Taft1988; Banister and Berechman Reference Banister and Berechman2000). Since it concerns a public policy, it implies that partisan motives are also relevant for understanding variations in the level and change of public investment.
Public investment as a contested issue between the Left and the Right originates mainly from contrasting views as a public policy to provide a wider range of collective goods to regulate or nationalize key industries, in particular public utilities like railways, postal services, roads and waterworks etc. The major rationale of Left leaning parties has been that public investment is functional for reasons of social equality (access to amenities) and facilitating economic development (by means of infrastructure development and promoting job growth). These ideas were quite prominent of the 1950s and 1960s (Galbraith Reference Galbraith1967; Nove Reference Nove1983). In fact, leftist parties have always endeavoured to maintain state involvement in the economy, while those on the Right tend to remain more reserved in this respect (Boix Reference Boix1998).
An additional argument that is made on the growth and limits of public policies concerns the so-called Policy Legacy: a policy profile inherited from the past that defines the present spending pattern. These ‘path dependent’ trajectories have been mainly analysed in relation to the development of the welfare state, in particular to account for cross-national differences and spending rigidities over time (Rose and Davies Reference Rose and Davies1994; Pierson Reference Pierson and Pierson2001). This development has led to differentiation in the size of the public sector: in North Western Europe it grew strongly after the war, whereas most South European states only started to catch up in the 1970s in this respect after their re-democratisation (and, obviously, could not develop a policy legacy before the late 1970s). Most countries outside Europe have always showed a more moderate profile as regards the public sector (Keman Reference Keman, Eliassen and Kooiman1993). Hence, the impact of policy legacies will accordingly vary across the countries as well as over time.
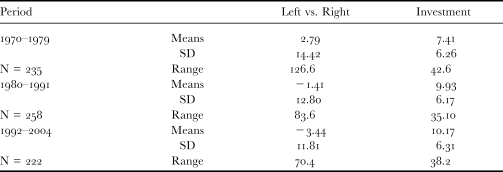
Party differences, in particular in government, can be expected to affect the change in public investment within the context of big government. In addition we argue that political decisions made by party government have produced both policy legacies (in the past) and fiscal stringencies (at present) that have influenced public sector spending in different directions: policy legacies – mainly created by Left-to-Centre parties in governments after the Second World War – led to bigger government with a large welfare state sector, whereas fiscal stringent policy-making intended to developing a smaller government mainly occurred since the 1980s (see for this also: Castles Reference Castles2007: Chapter 2). Hence, the effect of fiscal stringency and the concomitant sizing down of big government have affected the levels and change in public investment in a downward direction albeit differently depending on the previous levels (i.e. before 1980; recall the bottom row in Table 1). In addition, after 1980 the ideological discourse between the Left and Right also changed to neo-liberalism and appears relevant for the development of public investment since the 1980s: ideology as a platform for policy choices shaping policy formation by party government. In most advanced democracies the Left versus Right contestation dominates party political differences. This dimension of political conflict strongly correlates with views on the role of the public sector and vis-à-vis social and economic development (see for example: Keman Reference Keman2007). Below in Table 4 the party differences regarding the Left vs. Right distinction in party systems and partisan support for promoting public investment is reportedFootnote 4:
Left versus Right Difference and Issue Salience of Public Investment across 18 Party Systems, 1970–2004
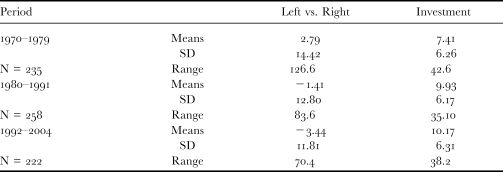
Note: SD = Standard Deviation. LvsR: left versus Right, measured at a scale that runs from Left (+ 100 maximum) to Right (− 100 maximum). Derived from data in Budge et al. Reference Budge, Klingemann, Volkens, Bara and Tanenbaum2001: 219–228 and updated in Keman Reference Keman2007. Left vs. Right concerns a range of socio-economic issues in party programmes re. a positive and negative role in the relationship state and market that are added up. If the outcome is negative it means pro-Rightwing ideas, if negative pro-Leftwing ideas. Investment: emphases within a party programme on the need for investing in society and infrastructure. The figures on Investment represent per cent of text of an electoral party platform devoted to this issue. Total N = 715 party programmes.
The Left versus Right conflict dimension has moved through time from a Leftist penchant (i.e. positive score) towards a more Rightist position in most countries (from +2.79 in the 1970s to −1.41 during the 1980s to −3.44 after 1992). This supports the idea that in most party systems – including the centre parties (which remain always between the Left and Right; see: Keman and Pennings Reference Keman and Pennings2006). There seems to emerge an inclination to a more right-wing if not neo-liberal attitude since the 1980s. This may well imply that the use of public means is becoming less prominent and concurs with the slow movement from Left to Right at the level of national party systems by 6.23 points. Conversely the issue of investment remains apparently uncontested during the 1980s and 1990s (on average 9.6 points), indicating that most parties still consider public investment important. This is a paradoxical development: parties tend to opt for smaller government but also wish to uphold public investment. However, as we have seen, most governments are also fiscally constrained in this endeavour because of the EMU requirements and the need to reduce public debt and deficit spending (Iversen and Wren Reference Iversen and Wren1998). Under these circumstances, the ideological shift towards to the Right appears to coincide with the wish for a smaller government, yet more often than not at the expense of the welfare state, but rather at the expense of non-welfare state policies like public investment (Pierson Reference Pierson and Pierson2001, Castles Reference Castles2007).
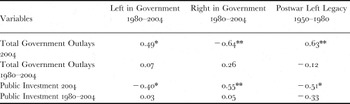
This development can be considered as a ‘break’ with the past: before the 1980s – in particular Left governments (or Centre-Left coalitions in which they dominated) – not only spent more on average, but also considered the provision of collective goods by public means as their business (Castles Reference Castles1998). This Left policy legacy helps to understand the changing pattern of public investment and its present level (the correlation between Left in Government before 1980 and the level of public investment is 0.44*, indicating that Leftwing parties tended to support this type of spending). Although the issue for public investment is maintained by most parties, we expect that the wish for reducing big government has been more pressing given the overall ideological change towards less state spending since the 1980s, in particular for parties with a more Right-leaning attitude. Inspecting the correlations between the presence of respectively the Left and Right in government – be it a coalition with Centre parties or not – this appears to be the case.
Obviously the party differences between the Left and Right government matters. Although centre parties are also regularly in government, they are less relevant here since their position is everywhere and always between Left and Right (see: Keman and Pennings Reference Keman and Pennings2006). As expected the Left leaning governments are reluctant to lower the level of total outlays, whereas if the Right is represented in government there is a negative relationship with higher levels of public expenditures. In part this development has been affected by the policy legacy of the Left, which has left behind its marks up until 2004. Yet, more conspicuous are the relations of the Left and Right in government with the present level of public investment: apparently Rightwing parties appear to spend more on public investment than Leftwing parties in government do. Hence the paradox that was noted in relation to the issue salience of ‘investing in society’ appears to be real and seems to imply that expenditures on public investment are maintained, yet only if and when budgetarily feasible.
From this we argue that the observed change from Left to Right in most countries eventually has not only the need to make budgetary cuts but also has meant that party differences matter indirectly as regards spending on public investment: If and when the Left in government has been in office for longer periods before the 1980s the perceived need to constrain total outlays of government after 1980 will be stronger and will eventually lead to lower levels of public investment (see Table 5 – this accounts for the negative relationship between the presence of the Left in Government and the level of public investment in 2004). If this policy of fiscal stringency is pursued by the Right in government this development will be particularly strong, but not directly at the expense of public investment. In other words: the level of government spending has been driven by the extent to which parties of the Left have been in government before 1980 and in part determines the lower levels of public expenditure on investment thereafter. Hence, the development of public investment since 1980 is in large part to be understood as collateral damage resulting from the emergence of fiscal stringency measures after 1980 as well as from an ideological shift towards a smaller state and the inert effects of an existing policy legacy of the Left leaning parties, if and when in government.
Bi-variate relations between Left and Right in Government and Expenditure on Public Investment, 1980–2004

Note: All are Pearson Product Moment Correlations. * = significant at 0.05; ** = significant at 0.01. Left and Right in Government represent the average proportion of portfolios in party government for the period 1980–2004. Left Legacy concerns the average participation of Leftwing parties in government between 1951–1980.
In Section 3, fiscal contraction in total outlays appeared relevant for understanding the change of public investment expenditure and its present level (2004). Hence, it can be argued that the impact of the policy legacy of the Left – in terms of developing a big government – has driven the need for fiscal stringency by party governments after 1980. These circumstances have been conducive to lower levels and the downward change in public investment expenditures between 1980 and 2004.
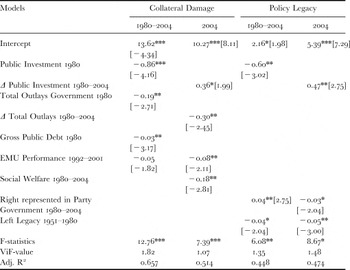
In Table 6 we present two models representing the overall explanation of the development in public investment. The first model shows the impact of the initial levels and development of total outlays of government, public debt and public investment in conjunction with the influence of welfare spending, on the one hand, and the role of the EMU requirements, on the other hand, on the change and present level of public investment (the Collateral Damage argument). The collateral damage, so we argue, is mainly an effect of budgetary choices that indirectly affect the future levels of public investment. In part this may be a trade-off between welfare provisions against public investment. However, this cannot be the full explanation (recall Table 3: the correlation between change in welfare and public investment spending 1980–2004 is 0.46). Another explanation might be that some investments are finite (e.g. there is no need or demand anymore; see also Budge et al. Reference Budge, Keman, McDonald, Pennings and Keman2002). The second model examines – in addition to the initial level of public investment – the role of the Left policy legacy and the influence of the Right in government regarding the change and present level of public investment (the Partisan Government argument). This model can be seen as complementary to the collateral damage model. It allows inspecting the extent to which political choices have affected budgetary ones. We expect that both models will help us to understand what has happened with the development of public investment.
Regressions for Public Investment Expenditure Change 1980–2004 and for 2004 in 18 OECD Democracies

Note: This table reports the coefficients of OLS-regressions; t-values in brackets. Significance levels: * = 0.05; ** = 0.01 Significance level; *** = 0.001 Significance level. All models were controlled for multi-co-linearity, i.e. only variables with a VIF-value of less then 2.0 are included and robust results are reported. Δ = Change is absolute difference. EMU Performance score is derived form Table 2: it consists of the change in Inflation, Deficit Spending and Gross Public Debt transformed into Z-scores. See for a description of the variables used: Tables 1, 2, 3 and 5.
The change models account for 45 to 66 per cent of the explained variance in expenditures on public investment across the countries under review. The history of spending patterns is to a large extent responsible for the present (Rose and Davies Reference Rose and Davies1994; Pierson Reference Pierson and Pierson2001). Additionally this development is also reinforced by the EMU performance during the 1990s. The models analysing the level of public investment expenditures in 2004 (adjusted R2 is 45 and 51 per cent) show that policy priorities like welfare spending, on the one hand, and complying with the EMU, on the other hand, are relevant.
Both the collateral damage model and the partisan government model confirm by and large that the main causes of public investment development between 1980 and 2004 within the OECD world are: the initial levels of public expenditure on investment, on the one hand, and subsequent change in total outlays, on the other, have significantly contributed to the present policy efforts in this area between 1980 and 2004. Yet, the impact of party government is also relevant: policy performance in the past is still relevant for policy-making at present: the Right in government tends to restrain total outlays and also welfare spending, but not so much public investment (recall Table 5). Lower levels of public investment are apparently indirectly affected by cuts in public spending and less by consciously reducing the level of public investment per se. And this, so we argue, is in large part due to the Left legacy that stems from the 1970s. This is what the Partisan Policy model appears to tell us.
All in all Table 6 reflects the story behind the development of public investment: fiscal contraction of spending by governments since 1980, reinforced by the EMU performance after 1990, has been conducive to lower levels of spending on public investment and has in turn led to a 2.07 per cent reduction on average. Notwithstanding the programmatic support to maintaining public investment by most political parties, the pressures to limit big government have been stronger and thus affected the change towards lower levels of public investment in 2004 as compared to 1980. In fact, it turns out to be a tale of more or less unintended consequences of political discourse being conducive to the collateral damage of public investing society by the state. We conclude therefore that fiscal capabilities and political responses to policy legacies (like financing the welfare state) are by and large responsible for understanding the present level and change of public investment expenditures.
5. Investing in society: Doing away with the public cause?
Public investment in OECD used to be a policy instrument for economic development and societal welfare. However, times have changed. An important factor accounting for the change of public investment expenditures has been the end of the ‘golden era’ of post-war economic growth within the OECD world (Cf. Maddison Reference Maddison1991). Additionally the growth of the welfare state led not only to higher levels of public expenditures, but also to a policy legacy that was increasingly considered as a burden that could not be sustained in the long run (Tarschys Reference Tarschys1983; Scharpf Reference Scharpf1991; Iversen and Wren Reference Iversen and Wren1998; Castles Reference Castles2007). Our analysis has demonstrated that this development has been conducive to fiscal stringency contingent upon changing ideas about the size of general government (Self Reference Self2000). The eventual result has been downward development over time (1980–2004), where in the process of cutting back big government public investment can be considered as a case of collateral damage.
This decreasing commitment to public investment since the 1980s appears to have a similar logic across the OECD world. Although some states did not decrease their levels as drastically as others, they certainly did not grow strongly. Overall the pattern of public investment expenditures tends to converge. In fact, the European democracies, (and the South European democracies at a slower pace), ‘caught up’ with the non-European ones in terms of reducing total outlays of government. Partisan politics of the Left and Right appear to have affected the cross-national pattern of spending on public investment during the last two decades of the twentieth century. Altogether, both macro-economic views on public finance and political ideas on state intervention have changed and have been put into policy practice.