


Introduction
With a yearly production of 180 million tons on 5 million hectares, tomato is one of the most popular vegetables worldwide (FAOSTAT, 2017). Due to the vast number of varieties available and its versatile utilization, this vegetable is an essential part of the daily human diet (Tigchelaar, Reference Tigchelaar and Bassett1986) and an important source of vitamins, minerals and antioxidants (Esquinaz-Alcazar and Nuez, Reference Esquinaz-Alcazar, Nuez and Nuez1995; Canene-Adams et al., Reference Canene-Adams, Campbell, Zaripheh, Jeffery and Erdmann2005). According to the broadest definitions – i.e. ‘any food for which a health claim can be made is a functional food’ (Weststrate et al., Reference Weststrate, van Poppel and Verschuren2002) – tomato is often called as a functional as well as a nutraceutical food (Jack, Reference Jack1995; Canene-Adams et al., Reference Canene-Adams, Campbell, Zaripheh, Jeffery and Erdmann2005). Lycopene, a phytochemical with paramount radical scavenging activity (Di Mascio et al., Reference Di Mascio, Kaiser and Sies1989; Stahl and Sies, Reference Stahl and Sies1996; Agarwal and Rao, Reference Agarwal and Rao2000) in tomato, can contribute to the reduction of certain cancers and cardiovascular diseases (Giovannucci, Reference Giovannucci1999; Canene-Adams et al., Reference Canene-Adams, Campbell, Zaripheh, Jeffery and Erdmann2005; Kun et al., Reference Kun, Lule and Xiao-Lin2006) by reducing reactive oxygen species levels and the extent of oxidative damage (Clinton, Reference Clinton1998; Rao, Reference Rao2006). Towards anti-mutagenic and anti-carcinogenic abilities (Ilahy et al., Reference Ilahy, Siddiqui, Tlili, Montefusco, Piro, Hdider and Lenucci2018), it enhances cell-to-cell communication (Rao et al., Reference Rao, Waseem and Agarwal1998) reduces the occurrence of certain kidney disfunctionalities (Carluccio et al., Reference Carluccio, Lenucci, Piro, Siems and Lu-no2016). Towards its hypothesized anti-cancer activity, ascorbic acid has a supportive role against DNA mutation induced by oxidative stress (Adalid et al., Reference Adalid, Rosello and Nuez2010). The nutritional parameters of tomato are influenced by climatic conditions (Worthington, Reference Worthington1998; Lee and Kader, Reference Lee and Kader2000; Dumas et al., Reference Dumas, Dadomo, Di Lucca and Grolier2003; Helyes et al., Reference Helyes, Dimény, Pék and Lugasi2006) to a different extent.
The phytonutrient content of modern cultivars has changed over the past decades in comparison with the old varieties (Baldwin et al., Reference Baldwin, Scott, Shewmaker and Schuch2000; Tieman et al., Reference Tieman, Zhu, Resende, Lin, Nguyen, Bies, Rambla, Beltran, Taylor, Zhang, Ikeda, Liu, Fisher, Zemach, Monforte, Zamir, Granell, Kirst, Huang and Klee2017). Ripening inhibitor genes influence the biosynthesis of several compounds, resulting in less flavourful cultivars (Powell et al., Reference Powell, Nguyen, Hill, Cheng, Figueroa-Balderas, Aktas, Ashrafi, Pons, Fernández-Munoz, Vicente, Lopez-Baltazar, Barry, Liu, Chetelat, Granell, Van Deynze, Giovannoni and Bennett2012), while the unbalanced breeding aims are responsible for the loss of valuable alleles influencing volatile production and thus flavour perception (Tieman et al., Reference Tieman, Zhu, Resende, Lin, Nguyen, Bies, Rambla, Beltran, Taylor, Zhang, Ikeda, Liu, Fisher, Zemach, Monforte, Zamir, Granell, Kirst, Huang and Klee2017). Therefore, several authors suggest the inclusion of old varieties, wild species and landraces into breeding and production (Male, Reference Male1999; Rodríguez-Burruezo et al., Reference Rodríguez-Burruezo, Prohens, Roselló and Nuez2005; Powell et al., Reference Powell, Nguyen, Hill, Cheng, Figueroa-Balderas, Aktas, Ashrafi, Pons, Fernández-Munoz, Vicente, Lopez-Baltazar, Barry, Liu, Chetelat, Granell, Van Deynze, Giovannoni and Bennett2012). At the same time, agricultural industrialization has led to the reduction of plant varieties and decreased agrobiodiversity (Toledo and Burlingame, Reference Toledo and Burlingame2006). Therefore, Food and Agriculture Organization of the United Nations (FAO) and Biodiversity International (BI) encourage the use of old, abandoned and underutilized genetic sources in order to enhance diversity of agricultural land as well as of the organoleptic and nutritional quality of food commodities.
Little data are available concerning the nutritional value of Hungarian processing type tomato accessions, while those from other countries are widely available (Passam et al., Reference Passam, Karapanos, Bebeli and Savvas2007). Genotype main effect plus genotype × environment interaction (GGE) biplot analysis (Yan, Reference Yan2001) is an effective and versatile tool for the multi-perspective evaluation of gene bank accessions and breeding lines (Fayeun et al., Reference Fayeun, Alake and Akinlolu2018). Therefore, the aim of our study was to compare Hungarian tomato accessions and commercial open-pollinated varieties using GGE biplot in order to assess them from a nutritional point of view, thus enhancing the utilization of the genetic pool of landraces.
Materials and methods
Sample preparation
The nutritional dataset of 10 indeterminate-type Hungarian tomato accessions and three commercial open-pollinated varieties were selected and compared in order to evaluate the value of the genetic sources from a nutritional point of view. The propagation material of accessions was provided by the Research Centre of Biodiversity, Tápiószele, Hungary. The samples were grown in 3 consecutive years (2012–2014) on the organic certified field of Experimental and Educational Station, Szent István University, (Soroksár, Hungary, 47°23′N 19°08′E, 115 m above sea level) in open field conditions. The soil surface of the experimental area was covered by plastic fabric. The randomized plots consisted of 10 plants of the same accession, one accession was represented by 40 plants in four plots. Side shoots of the plants were regularly removed. Plants were grown without regular supplementary irrigation. Characteristics of the selected accessions and varieties are shown in Table 1. For better understanding, the last five digits of the accession codes are used for sample identification in the text and in tables and figures.
Descriptive information of investigated tomato accessions and varieties

a Own measured data, 3 years mean.
b According to UPOV TG 44/11 Tomato Descriptor (2011).
c Reddish-pink fruit colour, all the other landraces and varieties have red colour.
d Commercial varieties maintained by Sunseed Genetics (UK), Hild Samen (DE) and Semillas Fito SA (ES), respectively.
Climatic data (average temperature, precipitation) for the period of the experiment was collected from the local weather station.
A measure of 1500 g of representative sample was collected at the peak harvest time (12–21 August 2012–2014) from each accession and variety. All fruits were in biological ripening stage (S6) (USDA, 1991), were intact, and without any visible sign of infection. After washing and removing of stems, the fruits were chopped and homogenized without dilution by a laboratory homogenizer at high speed for 2 min. The homogenates were stored at −80 °C in Falcon tubes until analysis.
Instrumental measurements
The instrumental measurements were performed by the Department of Dietetics and Nutrition Science, Faculty of Health Sciences, Semmelweis University, Hungary. Total soluble solids (TSS) were measured according to Codex Alimentarius 558/93 by a Hanna Instruments HI 96801 digital refractometer, data were provided in Bxo. For titratable acid (TA) quantification, 0.1 N NaOH and phenolphthalein indicator were used, data were expressed in citric acid equivalent percentage (ISO 750:2001). Sugar-acid (SA) ratio was calculated by the division of TSS with TA. A standard drying cabinet was used for dry matter (DM) measurement; after weight recovery, data were expressed in g/100 g dimension. TSS, TA and DM content were measured in three repetitions.
For antioxidant assays (FRAP, TPC, DPPH), the supernatant was collected from homogenates centrifuged at 2000 g.
The FRAP assay was conducted according to Benzie and Strain (Reference Benzie and Strain1996). The results were provided in ascorbic acid (AA) equivalent using mg AAE/l dimension according to Huang et al. (Reference Huang, Ou and Prior2005). Issues regarding AA instability were minimalized by preparing the FRAP reagent and the calibration curve in every 2 hours.
The DPPH method was carried out according to Molyneux (Reference Molyneux2003). A measure of 100 µl of supernatant was added to 3.9 ml of 6 × 10⁻⁵ M DPPH solution, kept in the dark for 20 min, then absorbance was recorded spectrophotometrically (λ = 517 nm). Values were provided in Inhibition % (I%) dimension.
Total polyphenolic content (TPC) was measured according to Singleton and Rossi (Reference Singleton and Rossi1965), using Folin-Ciocalteu's reagent. A standard curve based on gallic acid (GA) concentrations was created; results were expressed in mg GAE/l dimension.
Lycopene content was determined spectrophotometrically according to Fish et al. (Reference Fish, Perkins-Veazie and Collins2002); a mixture of acetone (with 0.05% BHT), ethanol, and hexane was used for extraction. Absorbance in the hexane layer was measured at λ = 503 nm against hexane as blank solution; the results were expressed in mg/100 g dimension. Although the spectra of other carotenoids overlap at this wavelength, spectrophotometric measurements provide reasonable results (Fish et al., Reference Fish, Perkins-Veazie and Collins2002); spectrophotometric and HPLC data do not divide significantly (Marković et al., Reference Marković, Krbavčić, Krpan, Bicanic and Vahčić2010).
Antioxidant activity, as well as lycopene content, were measured in five repetitions.
Statistical analysis
Analysis of variance (ANOVA) was run in the case of the 3-year dataset of each nutritional parameter using IBM SPSS Statistics version 25; Games-Howell or Tukey post-hoc tests were applied (P < 0.05).
GGE biplot data analysis was done using GGEBiplotGUI (Frutos et al., Reference Frutos, Galindo and Leiva2014) package of R-project (version R-3.3.3) (R Development Core Team, 2008). The applied model used row-metric preserving (SVP = 2), without data transformation (‘Transform = 0’), scaling by standard deviation and tester-centred G + GE.
It was decided to involve all investigated parameters (TSS, TA, DM, FRAP, TPC, DPPH, lycopene), but sugar-acid ratio, into the assessment of plant genetic resources (PGRs) with GGE biplot in order to provide a more complex picture about the nutritional properties of samples. However, as sugar-acid ratio is an index, not an amount of a compound, it was decided to exclude this parameter from the assessment. The parameters included have mixed characteristics; TSS, DM and TA refer to the taste of tomato, while the other parameters (FRAP, TPC, DPPH, lycopene content) relate to functional properties and provide information about the antioxidant status of the sample. Therefore, GGE biplots were also prepared with the exclusion of taste properties (TSS, DM, TA), solely based only on functional properties; results are discussed in the respective subsections.
Results
Weather conditions
With regard to weather data (Fig. 1), differences in average temperature were not outstanding between years, while precipitation shows moderate differences. Among the experimental years, 2013 was the warmest year, with minimal precipitation; both the temperature and precipitation of 2012 were generally average, while 2014 can be characterized with excessive rainfalls.
Average temperature (T) and precipitation (P) of three experimental years (2012–2014).

Nutritional data
All of the investigated nutritional parameters are more or less influenced by climatic conditions, therefore the raw nutritional data (Table 2, online Supplementary Tables S1–S3) is not comparable between years.
ANOVA test of 3 year (2012–2014) nutritional dataset of tomato PGRs and commercial varieties

TSS, total soluble solids; DM, dry matter; TA, total acid content; SA ratio, sugar-acid ratio; LYC, lycopene; FRAP, ferric reducing ability of plasma; TPC, total polyphenolic content; DPPH, diphenylpicrylhydrazyl.
Regarding total soluble solids, values ranged from 3.13 Bxo for Hellfrucht in 2012 to 7.77 Bxo for 31257 in 2013. Obovate-type accessions had typically higher Bxo values over the 3 years, especially 31255, 31257 and 60349, as well as San Marzano, significantly divide from the others in most cases. The lowest values were given by 31091 and two commercial varieties, Hellfrucht and Marmande; the difference was significant from most accessions in both 3 years. The same is true for DM content; here, the values ranged between 3.83 g/100 g for 31091 in 2012 and 7.1 g/100 g for RCAT060348 in 2013, however, obovate type PGRs do not divide significantly in every case. Total acid values ranged between 0.28 and 0.79 g/100 g throughout the 3 years. Variations in the sequence of samples occurred between years. Higher values were given by 30271, 31257, 29837 and San Marzano; while 31091, 56060 and 60349 were characterized by lower acid content. Neither obovate types nor PGRs divide significantly from commercial varieties. Highest sugar-acid ratios were given by 31255, 31257, 60348 and 60349, while the lowest values were reached by Hellfrucht and Marmande. The differences between these two groups were significant in most cases.
The lycopene content of samples was between 3.38 and 7.51 mg/100 g throughout the years. The obovate type accessions, especially 31255 and 31257 gave the highest results, in contrast with 31091, 31174 and all of the commercial varieties which had the lowest values. Significant differences were found in the first 2 years between the pair of 31255 and 31257 and the group of commercial varieties.
The antioxidant activity of the samples was inconsistent over years and methods (FRAP, TPC, DPPH). However, all of the assays gave consensual results in case of 31257 and 60349 accessions with the highest values in every year. The samples with higher results according to at least 2 years and/or two assays were 30271, 31255, 60348 and 29837, as well as all of the commercial varieties. The accessions 31091, 31174 and 56060 were characterized by low antioxidant status, based on the results of 3 years and assays.
GGE biplot of nutritional data
According to Yan et al. (Reference Yan, Kang, Ma, Woods and Cornelius2007), the two most important factors affecting the variation of the evaluation criteria (e.g. yield or nutritional values) are the genotype (G) and the genotype × environment interaction (GEI). The differences in the environments of the 3 years provide a wide basis for the assessment of the investigated accessions and varieties and increase the reliability of the results; it further indicates that the selection of accessions with outstanding and/or balanced phytonutrient content is feasible. The analysis of variance (Table 2) revealed significant effect of the environment, genotype and genotype × environment for the investigated nutritional parameters, which justifies the existence of GEI.
Fig. 2 shows the GGE biplot of the nutritional value of the investigated tomato accessions and varieties in three environments (years). The first two principal PCs explain 76.47% of the total variation of the GGE model (PC1 = 54.78%, PC2 = 21.69%). PC1 defines the mean performance of the samples, while PC2 shows the GEI of the accessions, i.e. the extent of variability, here called stability. Differences in the climatic conditions of the three seasons are visible on the GGE biplot (Fig. 2); the datasets of the 3 years divide with minimal overlapping. Samples of the same year stay within one group; an exception for this could be 31257, which is positioned relatively far from the group centre both in 2012 and in 2014. Fig. 2 also represents the sequence of mean nutritional values and stability across three environments as well. Here, the arrowed line is called average environment coordinate (AEC); the direction of the arrow indicates increasing average nutritional values.
GGE biplot of investigated nutritional properties of 10 Hungarian tomato accessions and three commercial varieties in 3 consecutive years (2012–2014) (SVP = 2, transform = 0, scaling by standard deviation, tester-centred G + GE). The last five digits of the accession codes and abbreviations of variety names are used for sample identification. BRIX, total soluble solids; DM, dry matter; TA, total acid content; SA ratio, sugar-acid ratio; Lyc, lycopene; FRAP, ferric reducing ability of plasma; TPC, total polyphenolic content; DPPH, diphenylpicrylhydrazyl.

Most of the mean nutritional values during 2012 and 2013 are above the average axis, while those of 2014 are below average. 31091 is a good example of low mean values in every environment. The accession 31257, with one of the highest mean values in every year is the only sample in 2014 that could qualify above the 3-year average mean.
The 3 years of the experimental period were characterized with generally different stability; the nutritionally most balanced samples were those grown during 2014, followed by those of 2012 and 2013, respectively.
When the GGE biplot is run only with functional properties (online Supplementary Fig. S1), separation of the 3 years is also visible, with slight changes; the dataset of 2014 is closer to that of 2013 and divides from that of 2012.
Figs. 3(a)–(c) represents the nutritional values of the 10 investigated tomato accessions and three commercial varieties in given environments (i.e. 3 years), respectively. The average tester coordinate (ATC) passes through the origin of the biplot (Yan and Kang, Reference Yan and Kang2003); the samples according to their nutritional data are ranked along this line. The arrow on the ATC shows the direction of the increasing values, while the centre of the coordinate system represents the average value; data vectors with a starting point on the arrowed side of the ATC have above average values, while those on the other side have below-average values. The length of the vectors from PC2 axis towards the data points refers to the stability of the sample, in this case, the balanced nutrient content. Longer vectors mean more unbalanced results.
(a–c) The phytonutrient values of 10 Hungarian tomato PGRs and three commercial varieties in 2012–2014 investigated with GGE biplot (SVP = 2, Transform = 0, scaling by standard deviation, tester-centred G + GE). The last five digits of the accession codes and abbreviations of variety names are used for sample identification.

In 2012, the highest average values were given by the group of 31257, 31255 and 60349, respectively (Fig. 3(a)). The accession 31091 together with Hellfrucht had the lowest mean values. The lowest stability was given by accession 30271 and 60349, while the accessions 60348, 31174 and 56060 had the highest stability. The subgroup of accessions with obovate fruit shape scored above average, with differences in stability.
The GGE biplot of the functional parameters for 2012 showed only slight differences (online Supplementary Fig. S2(a)), with the exception of 31255 and San Marzano; their position changed far below average.
In 2013, the best mean values were performed by 60349, 60348 and 31257 accessions (Fig. 3(b)). The lowest mean results were given by 31091 and 56060 accessions. The PGRs 31174, 56060 and 29837 had the highest stability in 2013, while the most unbalanced samples were Hellfrucht, 57664 and 31091, respectively.
The GGE biplot of the functional parameters for 2013 (online Supplementary Fig. S2(b)) did not differ from the biplot of all variables, except for 31257, where the exclusion of taste properties took a significantly lower position on the ATC.
The average axis divides the samples into two sub-groups in 2014 with a relatively wide gap in between (Fig. 3(c)). San Marzano, 31257 and 29837 gave the highest mean values. Highest instabilities throughout the 3 years were experienced here, in case of obovate type PGRs. Marmande and the accessions 60348 and 31091 showed the lowest summarized nutritional results.
When focusing only to functional data, separation of sub-groups is visible here as well (online Supplementary Fig. S2(c)). Slight changes happened in the sequence of samples: Hellfrucht took the second-highest average value and Marmande got a higher position on the ATC. Stability of the accessions 31257 and 31255 are much higher in this assessment.
Figs. 4(a)–(c) represents the relation of investigated samples to an ideal sample. The data point of this theoretical sample is situated at the middle of the concentric circles, on the AEC, which means, that it is absolutely stable at the same time. The distance from this point defines the value of the sample for the investigated traits; the closer the sample is the better the characteristics are. According to Adalid et al. (Reference Adalid, Rosello and Nuez2010), an average nutritional evaluation (ANE) of the GGE biplot was used in this case.
(a–c) Tomato PGR comparison (2012–2014) with a theoretical sample having high and equilibrated nutritional content on a GGE biplot (SVP = 2, Transform = 0, scaling by standard deviation, tester-centred G + GE). The last five digits of the accession codes and abbreviations of variety names are used for sample identification.
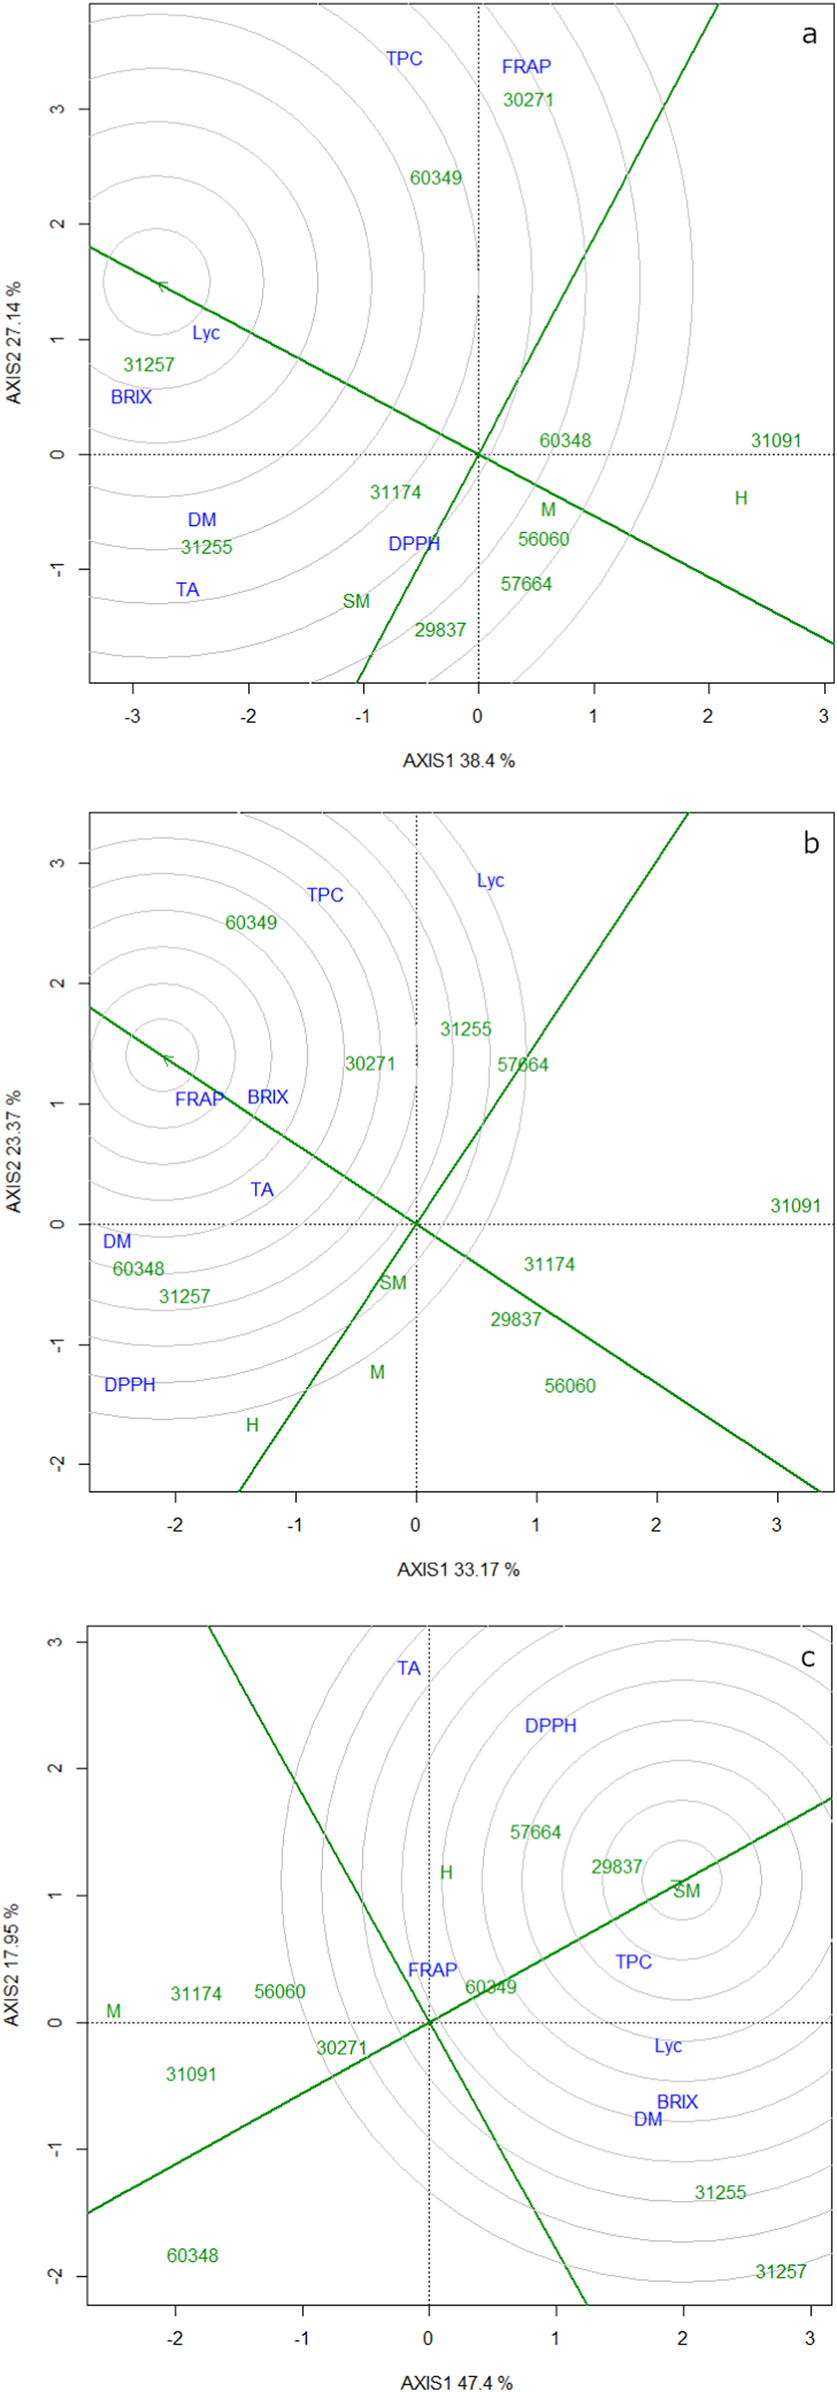
In 2012, the sample 31257 and the subgroup of 31255, 60349 and 31174 were the closest to the ideal variety (Fig. 4(a)), positioned in the first and fifth concentric ring, respectively. The most determinant nutritional parameters were lycopene, BRIX and DM. San Marzano in the seventh circle is the closest to the circle centre among commercial varieties, while Hellfrucht is outside the 10 circles.
The GGE biplot runs on functional parameters of 2012 show a different picture (online Supplementary Fig. S3(a)); the data point of the ideal sample is far from all the PGRs and varieties. A total of 31257 is the only sample that is included in any of the 10 circles.
In 2013, only six of the investigated samples – including all of those with obovate fruit shape – are positioned within the 10th concentric circles (Fig. 4(b)). The accession 60349 in the fifth circle is the closest to the ideal variety, followed by 60348 and 30271 in the sixth circle. San Marzano is the only commercial variety within the 10 circles.
When the GGE is run on functional parameters, the biplot accounts for 77.76% of the variance (online Supplementary Fig. S3(b)). The position of two obovate type PGRs change remarkably: 31255 is closer to, while 31257 is farther from the ideal data point.
In 2014, the variety of San Marzano was very close to the ideal sample (Fig. 4(c)). Five of the PGRs are within the 10 circles. Hellfrucht is situated in the fifth circle, while the other commercial variety, Marmande, together with five accessions are outside the circles.
In the case of the GGE biplot of the functional variables of 2014 (online Supplementary Fig. S3(c)), only four samples remain within the 10 circles, PGRs and varieties get further from the ideal data point. An exception is 31257, which is re-positioned in the fifth circle.
Discussion
Assessment of environments
The three environments with significantly different weather conditions provide a good ground for the assessment of the landraces in comparison with commercial varieties. It can be concluded, that neither landraces nor varieties could tolerate the extreme weather conditions of the 3 years from a nutritional perspective. On the other hand, our results contribute to the assessment of the compensating ability of landraces towards humid or arid environments, as accessions tolerating extreme weather conditions could have paramount importance for plant breeding in future. Excessive environments contributed to the decrease of the nutritional content of fruit and vegetables; increased tolerance could be a solution to overcome such economic losses in case of changeable climatic conditions.
From the position of the groups on Fig. 2, one can conclude, that the weather of 2014 was unfavourable to the investigated nutritional parameters, every parameter, but DPPH value are located far from that dataset; the extremely humid weather significantly decreased the investigated phytonutrient levels of all the samples. The year of 2012 was optimal mainly for the antioxidant activity measured using the DPPH assay, and for lycopene, acid and polyphenolic content to a lower extent. In contrast, the typically arid year of 2013 was ideal for the antioxidant capacity measured by FRAP assay, and proportionally for total and water-soluble solids. This can be ascribed to the reduced amount of water supply leading to the increased concentrations of nutritional constituents (Rouphael et al., Reference Rouphael, Cardarelli, Bassal, Leonardi, Giuffrida and Colla2012). At the same time, the proximity of DM and BRIX justifies their strong correlation. The main predictors of FRAP value are TPC and vitamin C content, which are in positive correlation with heat stress (Davey et al., Reference Davey, Van Montagu, Inze, Sanmartin, Kanellis, Smirnoff, Benzie, Strain, Favell and Fletcher2000), and excess to sunlight (Cano et al., Reference Cano, Acosta and Arnao2003), respectively; the position of FRAP datapoint is the closest to the warmest year's dataset. As the data point of TPC is situated close to the groups of 2012 and 2014, it suggests that supposedly the main contributor of FRAP was vitamin C in this case. An outlier is 31257 both in 2012 and in 2014. This might relate to relative independence from the climatic conditions from a nutritional point of view.
All the above statements are also true when only antioxidant related functional parameters are taken into the analysis.
Environment specialists
In the environment of 2012 (Fig. 3(a)), the most ideal samples were 31257 and 31255, together with 60349 and 31174; these accessions are the most valuable in the given environment from a nutritional point of view, having both the highest results and moderately high stability.
The arid environment during 2013 resulted in remarkable distances from the ideal sample (Fig. 3(b)). Only six of the investigated samples – including all of those with obovate fruit shape – are positioned within the 10 concentric circles. The impact of the arid environment on the nutritional content of the accessions is severe; this can be explained by the fact, that these landraces are adapted to the typical local climatic conditions; this drought period was endurable for the samples with Mediterranean origin (San Marzano, Marmande and possibly 60348 with ‘cuor di bue’ fruit shape).
In 2014, the GGE biplot (Fig. 3(c)) shows two separate sub-groups. It was probably due to the extremely humid climatic conditions; those which could tolerate it reached above-average means, while the nutritional values of the below-average group were severely ruined by the unfavourable weather conditions. From a nutritional point of view, the best rainfall-tolerant samples were San Marzano, 29837 and 57664. A total of 31257 and 31255 are far from the origo due to their low nutritional stability in this environment. Their important parameters are BRIX, DM and lycopene content in this year. In 2014, the pathogen stress was severe due to the humid weather conditions; landraces or varieties with more resistant foliage could possibly reach better results. The TPC parameter representing the TPC is positioned very close to the centre; it justifies the above assumption, as the level of polyphenols shows a positive correlation with pathogen stress (Bennet and Wallsgrove, Reference Bennet and Wallsgrove1994). FRAP data point is relatively far from the other nutritional parameters, probably due to the unfavourable weather conditions for vitamin C synthesis (Cano et al., Reference Cano, Acosta and Arnao2003). Both FRAP and TPC are based on similar mechanisms, but they have different sensitivity towards different reducing agents, which can cause this difference between their results.
The commercial varieties San Marzano and Marmande here used as controls are both landraces; together with Hellfrucht, an open-pollinated variety suitable for extensive cultivation meant a strong counterpoint for PGRs. Therefore, our results did not manage to clearly support the general belief, that landraces have more favourable nutritional content in every environment than commercial varieties. At the same time, we identified the PGRs with paramount nutritional values in comparison with the controls, which are of importance for both breeders and producers.
Exclusion of taste properties
The exclusion of taste properties from GGE assessment resulted in notable differences in comparison with those done on the whole nutritional dataset. This was mainly visible when PGRs were compared with an ideal variety.
The explained variance was increased in all three environments when taste properties were excluded; this is in accordance with the reduction of the number of properties in the principal component analysis (PCA).
The distance between PGR datapoints and that of the ideal variety was generally higher when only functional properties were included in the GGE analysis. This is the most visible in case of the first environment. The diameter of the 10 circles was also reduced. These phenomena can also be explained by the fact, that the number of properties included in the PCA was decreased.
All taste properties are close to the centre of the concentric rings; this shows the determinative role of DM, TA and BRIX in these environments. When these properties are excluded, PGRs with high taste properties will be ranked lower. A good example is 31255 in the first environment or 31257 in the second environment.
However, breeding for a single trait was never successful; therefore, it is suggested to include all of the investigated properties into the GGE analysis when the aim is to make a multi-criteria decision.
PGRs for further utilization
The main outcome of this work is the identification of PGRs tolerating special environments from a nutritional point of view. The accessions with possible drought tolerance and an acceptable phytonutrient composition were 60349, 60348 and 31257. The accessions with satisfying nutritional content under extreme wet conditions were 29837 and 57664 mainly due to their favourable DPPH and TPC values. Based on the above data, the involvement of these accessions for their balanced nutritional values in quantitative trait loci (QTL) mapping or in genome-wide association studies (GWAS) for increased drought/wetness tolerance is suggested. At the same time, accessions with one or more outstanding nutritional parameters could be of use for the improvement of novel tomato varieties, such as 31257 and 60349 showing the highest total soluble solids, DM, lycopene and antioxidant power values almost in all cases. The accessions with obovate fruit shape showed above average results in every environment, in contrast with the big-fruited ones; an in-depth analysis of the group members could be reasonable.
The great potential of the investigated tomato accessions for nutritional traits was demonstrated; with the use of GGE biplot, the selection of best accessions with balanced nutritional content is possible, especially by the comparison with an ideal variety. This phenotypic data can contribute to the utilization of the investigated landraces in targeted QTL or GWAS assessments and enriches the nutritional data bank of tomato genotypes.
Supplementary material
To view supplementary material for this article, please visit https://doi.org/10.1017/S1479262119000297.
Acknowledgements
The authors thank the support of (†) Csaba Orbán for his support in instrumental measurements. This work was partly supported by the Research Institute of Organic Agriculture (ÖMKi). D.K. and B.B. thanks the support of Doctoral School of Food Sciences, Szent István University. A.G. thanks the support the Premium Postdoctoral Research Program of Hungarian Academy of Sciences and OTKA, contract No K119269. The paper was supported by the János Bolyai Research Scholarship of the Hungarian Academy of Sciences.



