INTRODUCTION
The carbon dioxide (CO2) concentration (hereafter abbreviated as [CO2]) in the atmosphere has been increasing since the industrial revolution, reached 380 μmol/mol in 2005 and is predicted to reach 550 μmol/mol by 2050 according to the IPCC emissions scenario A1B (Houghton et al. Reference Houghton, Ding, Griggs, Noguer, Van Der Linden, Dai, Maskell and Johnson2001). Elevated [CO2] affects the carbon (C) and nitrogen (N) cycles in the plant–soil system (Gorissen Reference Gorissen1996; van Groenigen et al. Reference Van Groenigen, De Graaff, Six, Harris, Kuikman and Van Kessel2006; Polley et al. Reference Polley, Morgan and Fay2011) including production of the greenhouse gases (GHG) nitrous oxide (N2O), CO2 and methane (CH4) (Ineson et al. Reference Ineson, Coward and Hartwig1998; Baggs & Blum Reference Baggs and Blum2004; van Groenigen et al. Reference Van Groenigen, Osenberg and Hungate2011). In Australia, agriculture accounted for 0·16 of national GHG emissions in 2008 (Department of Climate Change and Energy Efficiency (Australia) 2010). The emissions might be higher under future, higher atmospheric [CO2] if the positive effect of elevated [CO2] on GHG emissions is observed in cropping systems (Smith et al. Reference Smith, Runion, Prior, Rogers and Torbert2010; Lam et al. Reference Lam, Lin, Norton and Chen2011) prevails. Although supplementary irrigation has been reported to stimulate grain yield under elevated [CO2] (Wu et al. Reference Wu, Wang, Bai and Liao2004) it may also affect the emissions of N2O, CO2 and CH4, as these are sensitive to soil moisture conditions (Kessavalou et al. Reference Kessavalou, Doran, Mosier and Drijber1998; Khalil & Baggs Reference Khalil and Baggs2005; Welzmiller et al. Reference Welzmiller, Matthias, White and Thompson2008; Maraseni et al. Reference Maraseni, Cockfield and Maroulis2010). However, the interaction between [CO2] and supplementary irrigation on emission of these gases from semi-arid cropping systems with a Mediterranean climate, such as in southern Australia, has not been investigated.
The present study was conducted in the Australian grains free-air carbon dioxide enrichment (AGFACE) system at Horsham (36°45′S, 142°07′E), Victoria, Australia, to investigate (i) the interaction between [CO2] and supplementary irrigation on the short-term fluxes of N2O, CO2 and CH4 from a wheat field; and (ii) whether the impact of elevated [CO2] on the fluxes varies with crop growth stage.
MATERIALS AND METHODS
The FACE experiment
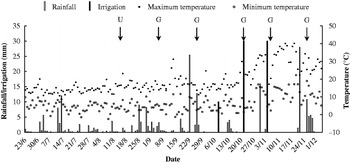
The system consists of 16 experimental plots (each 16 m in diameter), eight with elevated [CO2] (550 μmol/mol) and eight with ambient [CO2] (390 μmol/mol). The design and technology of the AGFACE system have previously been described in Mollah et al. (Reference Mollah, Norton and Huzzey2009, Reference Mollah, Partington and Fitzgerald2011). Briefly, the rings were spaced 78 m centre to centre to avoid cross contamination. The CO2 was injected into the atmosphere on the upwind side of the ring, through 0·30 mm holes (20 holes/m), mixed with air and transported across the ring by the prevailing wind. The [CO2] within each plot was measured each second by factory-calibrated infrared gas analysers (SBA-4 model) positioned at the centre of each ring. The elevated [CO2] was maintained within 0·10 of the target (495–605 μmol/mol) 0·92 of the time. The supply of CO2 was suspended at night when the plants were not photosynthesizing and if the wind speed exceeded 8 m/s in daytime (Mollah et al. Reference Mollah, Norton and Huzzey2009, Reference Mollah, Partington and Fitzgerald2011). The soil at the site is classified as Vertosol (Isbell Reference Isbell1996). The surface soil (0–0·20 m) has a bulk density of 1·30 t/m3, pH (1 : 5 soil : water) of 8·3 and contains 11·0 g organic C/kg, 1·4 g total N/kg and 370 g clay/kg. The 0–0·50 m layer contained 123 kg nitrate-N/ha and 31 kg ammonium-N/ha at sowing. Details of daily temperature, rainfall and irrigation events are presented in Fig. 1.
Rainfall received, irrigation applied, maximum and minimum temperature and fertilizer application during the field experiment in 2009. Irrigations of 10, 30 and 30 mm equivalent rainfall were applied to half of each experimental area on 8 and 22 October, and 3 November 2009. The other half of each area received only rainfall and is designated as rainfed. U, urea application; G, gas sampling.

Wheat cultivation, fertilization and supplementary irrigation
Spring wheat (Triticum aestivum L. cv. Yitpi) was sown at row spacing of 220 mm and a seeding rate of 80 kg/ha on 23 June 2009. The wheat crop was topdressed with granular urea at the rate of 100 kgN/ha on 18 August when the wheat was at the 5-leaf stage. Supplementary irrigations of 10, 30 and 30 mm equivalent rainfall were applied to half of each experimental plot on 8 and 22 October and 3 November 2009. The other half of each plot was designated as rainfed. The wheat plants were harvested on 4 December 2009.
Gas sampling and flux determination
Gas samples for N2O, CO2 and CH4 analysis were taken from closed static chambers (0·25 m high, 0·24 m diameter) between 12·00 and 15·00 h on 8 and 29 September, 23 October and 10 and 30 November. These sampling days corresponded to stem elongation (Zadoks growth stage (GS) 30; Zadoks et al. Reference Zadoks, Chang and Konzak1974), booting (GS 40), anthesis (GS 60), dough development (GS 80) and ripening (GS 90) of wheat, respectively. The plants were inside the chambers so the measured CO2 fluxes included both plant and microbial respiration. The first gas measurement was carried out at stem elongation because of the high crop growth rate and concurrent high demand for N and water at this developmental stage (Karrou & Maranville Reference Karrou and Maranville1994), resulting in potentially major changes in soil C, N and water levels. One day before each sampling event, two chambers were inserted to a soil depth of 50 mm at random locations on each treatment plot. On each sampling day, gas samples (30 ml) were collected at 0, 30 and 60 min after chamber closure using a gas-tight syringe, transferred into vacutainers (Exetainer®, Labco Ltd., Lampeter, Ceredigion, UK) and analysed by gas chromatography (Varian CP-3800, Varian Inc., Middelburgh, the Netherlands). The linearity of gas diffusion into the headspace over the closure period was assessed. The flux rates of N2O, CO2 and CH4 were calculated as described by Ruser et al. (Reference Ruser, Flessa, Schilling, Steindl and Beese1998)
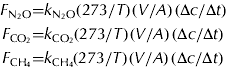 $$\eqalign{F_{{\rm N}_{\rm 2} {\rm O}} {\rm}\hskip-3pt = & {\rm} k_{{\rm N}_{\rm 2} {\rm O}} {\rm} ({\rm 273}/T)\hskip1pt (V/A){\rm}\, (\Delta c/\Delta t) \cr \hskip-6pt F_{{\rm CO}_{\rm 2}}\hskip-3pt = & {\rm} k_{{\rm CO}_{\rm 2}}\hskip-1pt ({\rm 273}/T)\hskip1pt (V/A){\rm}\, (\Delta c/\Delta t) \cr F_{{\rm CH}_{\rm 4}} \hskip-3pt= & {\rm} k_{{\rm CH}_{\rm 4}} \hskip-1pt ({\rm 273}/T)\hskip1pt (V/A){\rm}\, (\Delta c/\Delta t)} $$
where  $F_{{\rm N}_2 O} $,
 $F_{{\rm CO}_2} $ and
 $F_{{\rm CH}_4} $ are the flux rates for N2O, (μg N/m2/h), CO2 (mg C/m2/h) and CH4 (μg C/m2/h), respectively,
 $k_{{\rm N}_2 O} $ (1·25 μg N/μl),
 $k_{{\rm CO}_2} $ (0·536 μg C/μl) and
 $k_{{\rm CH}_4} $ (0·536 μg C/μl) are unit conversion factors for calculating the flux rates, T is the air temperature within the chamber (K), V is the volume of the air within the chamber (L), A is the covered soil area (m2) and Δc/Δt is the rate of change in gas concentration.
Soil analysis
Two samples of top soil (0–0·10 m) collected by auger within each chamber were bulked and oven dried at 40 °C prior to chemical analysis. Subsamples (10 g) of the dried soil were extracted with 100 ml 2 M potassium chloride (KCl; Keeney & Nelson Reference Keeney, Nelson, Page, Miller and Keeney1982). The concentrations of ammonium (NH4+) and nitrate (NO3–) in the filtered extract were determined colorimetrically by a Skalar San++ segmented flow analyser. Soil moisture was determined by oven-drying the soil at 105 °C for 48 h. Soil water-filled pore space (WFPS) was calculated using the formula
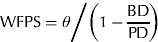 $${\rm WFPS} = {\theta \left/ {\left( {1 - \displaystyle{{{\rm BD}} \over {{\rm PD}}}} \right)}}$$
where θ is the volumetric soil water content, BD the soil bulk density and PD the particle density assumed to be 2·65 t/m3. The soil bulk density (1·3 t/m3) used in the present study was the average value of the whole site used for the major AGFACE experiment.
Harvest
When leaves were completely senesced and the grain was fully developed and ripened on 4 December 2009, plants were excavated to a root depth of 0·20 m from within a polyvinyl chloride (PVC) microplot. The PVC cylinder was inserted at sowing on the same treatment plot as that for gas sampling. The microplot covered the same area of land as that of the static chambers for gas sampling. The plant samples were dried at 60 °C for 48 h, and weighed for the total plant biomass.
Statistical analysis
The experiment has a randomized complete block design, with two [CO2] and two irrigation treatments and four replications. Data were analysed with MINITAB 14 statistical package using a General Linear Model analysis of variance. The correlation between gas flux rates and soil properties was tested in MINITAB 14 as well.
RESULTS
Biomass
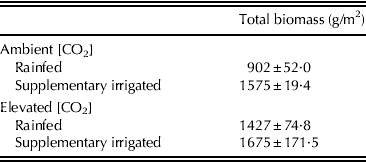
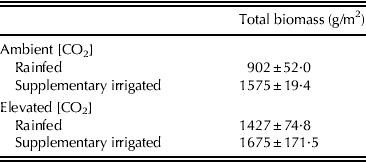
Elevated [CO2] increased the total plant biomass by 25% (P<0·01) when averaged across rainfed and irrigated plots (Table 1). Supplementary irrigation increased the total plant biomass by 75% (P<0·05) under ambient [CO2], but had no significant effect on the total plant biomass under elevated [CO2] (Table 1).
Interaction between [CO2] and irrigation on total plant biomass at maturity (Values are the mean±s.e. of four replicates for each treatment)
N2O flux
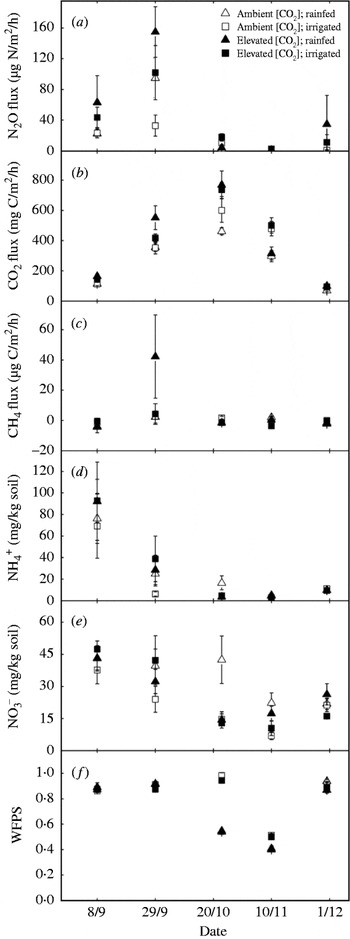
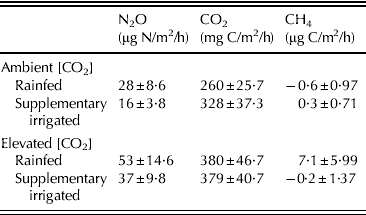
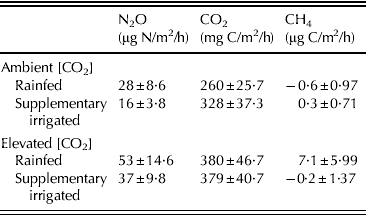
Elevated [CO2] increased N2O emissions by 108% (P<0·01) when averaged across rainfed and irrigated plots, but irrigation marginally (P<0·1) reduced the emissions by 36% when averaged across [CO2] treatments (Table 2). There was no significant interaction between [CO2] and supplementary irrigation on N2O fluxes. The fluxes of N2O were positively correlated with soil NH4+ content (r=0·25, P<0·01) and NO3– content (r=0·42, P<0·001). A significant (P=0·06) interaction between [CO2] and growth stage was observed, with a 101% increase in N2O fluxes occurring under elevated [CO2] between stem elongation and booting, but not at other sampling times (Fig. 2a). The fluxes of N2O and CO2 were positively correlated at the vegetative stage (r=0·37, P<0·01), but not at the reproductive or ripening stages.
Effect of elevated [CO2] on (a) N2O flux, (b) CO2 flux, (c) CH4 flux, (d) NH4+ content, (e) NO3– content and (f) WFPS at various key growth stages of wheat (stem elongation on 8/9/09; booting on 29/9/09; anthesis on 23/10/09; dough development on 10/11/09 and ripening on 30/11/09). CO2 fluxes included both plant and soil respiration as plants were inside the measurement chambers. Values are the means of four replicates for each treatment. Vertical bars indicate standard errors.

Interaction between [CO2] and irrigation on GHG fluxes averaged across the experimental period (Values are the mean±s.e. of four replicates for each treatment; n=40 for all variables except N2O flux with n=37 because of missing values)
CO2 fluxes included both plant and soil respiration as plants were in the measurement chambers.
CO2 flux
The emission of CO2 was 29% (P<0·001) higher under elevated [CO2] when averaged across rainfed and irrigated plots (Table 2). Supplementary irrigation increased CO2 emission by 26% (P<0·05) under ambient [CO2], but did not significantly affect the emission under elevated [CO2]. There was a significant (P<0·01) interaction between elevated [CO2] and growth stage, with an increase of 37% occurring between stem elongation and booting and 42% between booting and anthesis, but not at other sampling times (Fig. 2b).
CH4 flux
Methane fluxes were unaffected (P>0·05) by either elevated [CO2] or supplementary irrigation (Table 2). There was no significant interaction between [CO2] and irrigation on CH4 fluxes. The interaction between [CO2] and growth stage on CH4 fluxes was marginally significant (P=0·08). Fluxes increased from 2·5 (ambient [CO2]) to 23·3 μg C/m2/h (elevated [CO2]) at booting, but remained unchanged during other growth stages (Fig. 2c). The fluxes of CH4 and CO2 were positively correlated at the vegetative stage (r=0·45, P<0·001), but not at the reproductive or ripening stages.
Soil mineral N and WFPS
When averaged across [CO2] and irrigation treatments, NH4+ and NO3– content decreased (P<0·001) from 82·6 and 42·9 mg/kg soil, respectively, at stem elongation to 24·6 and 34·5 mg/kg soil at booting and to 7·1 and 21·1 mg/kg at anthesis before levelling off (Fig. 2d–e). Supplementary irrigation increased (P<0·001) WFPS from 0·54 to 0·96 and 0·40 to 0·51 during anthesis and dough development, respectively, but there was no significant interaction between [CO2] and growth stage on WFPS (Fig. 2f).
DISCUSSION
Interaction between [CO2] and supplementary irrigation on GHG fluxes
The increase in CO2 emission under elevated [CO2] (29%) was comparable with that found at other FACE sites growing wheat (15–39%) (Pendall et al. Reference Pendall, Leavitt, Brooks, Kimball, Pinter, Wall, Lamorte, Wechsung, Wechsung, Adamsen, Matthias and Thompson2001; Kou et al. Reference Kou, Zhu, Xie, Hasegawa and Heiduk2007; Lam et al. Reference Lam, Lin, Norton and Chen2011). This increase in CO2 emission (plant and soil respiration) was attributed to an increase in the total plant biomass under elevated [CO2] in the present study and possibly to the [CO2]-induced increase in root exudates (Cheng & Johnson Reference Cheng and Johnson1998; Zak et al. Reference Zak, Pregitzer, King and Holmes2000; Kou et al. Reference Kou, Zhu, Xie, Hasegawa and Heiduk2007).
The positive effect of supplementary irrigation on the emission of CO2 under ambient [CO2] can be explained both by its effect on plant growth and subsequent respiration and substrate input and a direct effect on the microbes (Van Gestel et al. Reference Van Gestel, Merckx and Vlassak1993; Calderón & Jackson Reference Calderón and Jackson2002). The current experiment did not allow a study of these two effects in isolation. Under elevated [CO2], supplementary irrigation did not affect either plant growth or soil CO2 emission. These results suggest that the direct effect of irrigation on soil microbes was probably small in the present study.
Supplementary irrigation did not stimulate biomass under elevated [CO2] in the present study, which implies crop water-use efficiency was improved under elevated [CO2] (Leakey et al. Reference Leakey, Ainsworth, Bernacchi, Rogers, Long and Ort2009; Utset & Del Río Reference Utset and Del Río2011). As a result, CO2 emissions under elevated [CO2], in association with biomass, remained the same between rainfed and irrigated treatments. It was found that elevated [CO2] had no effect on WFPS of top soil (0–0·10 m). This suggests that the enhancement of water-use efficiency under elevated [CO2] was not substantial enough to alter the moisture content of the top soil in the present study. Moisture in deeper soil layers was not measured in the present study. Nevertheless, since elevated [CO2] had no effect on the moisture content in the surface horizon, it is unlikely that large changes would occur at depth (Nowak et al. Reference Nowak, Zitzer, Babcock, Smith-Longozo, Charlet, Coleman, Seemann and Smith2004; Janus et al. Reference Janus, Angeloni, McCormack, Rier, Tuchman and Kelly2005).
The [CO2]-induced increase in N2O emission (108%) is similar to that of Kettunen et al. (Reference Kettunen, Saarnio, Martikainen and Silvola2005) who found a 107% increase in N2O emission from an N-fertilized (20–100 kg N/ha) peat soil growing Phleum pratense (timothy grass) when the [CO2] was increased. It is suggested that in the present study, denitrification was the major source of N2O emission, because, (i) there is a stronger correlation between N2O emission and NO3– content than between N2O emission and NH4+ content; (ii) the high WFPS (>0·70 of the space, except at dough development stage) that is ideal for denitrification (Bateman & Baggs Reference Bateman and Baggs2005; Khalil & Baggs Reference Khalil and Baggs2005); and (iii) the alkaline soil (pH 8·3) that would inhibit heterotrophic nitrification (Papen et al. Reference Papen, Von Berg, Hinkel, Thoene and Rennenberg1989). The increased denitrification probably results from the greater availability of C substrates, e.g. root exudates, for the denitrifiers (Arnone & Bohlen Reference Arnone and Bohlen1998; Kettunen et al. Reference Kettunen, Saarnio, Martikainen and Silvola2007). This suggestion is supported by the increase in CO2 emission under elevated [CO2] in the present study.
In this study, the reduction in N2O emission under supplementary irrigation was most likely due to enhanced reduction of N2O to N2 in the denitrification process, which could have resulted from high WFPS (0·87–0·96) from stem elongation to anthesis of wheat and the relatively high NO3– concentration in the soil (Weier et al. Reference Weier, Doran, Power and Walters1993; Mathieu et al. Reference Mathieu, Lévêque, Hénault, Milloux, Bizouard and Andreux2006). High N2 : N2O ratios were observed in other studies when WFPS was greater than 0·90 (Weier et al. Reference Weier, Doran, Power and Walters1993; Ciarlo et al. Reference Ciarlo, Conti, Bartoloni and Rubio2008). At a rainfed wheat field near the site of the present study, S. J. Officer (personal communication) found that irrigation did not increase N2O emission during the growing season under ambient [CO2]. In contrast, Lam et al. (Reference Lam, Lin, Norton and Chen2011) found that N2O emission was increased after irrigation when WFPS reached 0·40–0·50 under both ambient and elevated [CO2] in a semi-arid wheat field in northern China.
Methane fluxes from supplementary irrigated plots at ambient and elevated [CO2] were close to zero and there was no significant effect of irrigation or increased [CO2] on CH4 emission. Pathak et al. (Reference Pathak, Prasad, Bhatia, Singh, Kumar, Singh and Jain2003) also found that irrigation did not affect CH4 fluxes in a wheat field. It is unlikely that supplementary irrigation will increase CH4 emission from semi-arid wheat systems under future atmospheric CO2 concentrations.
Effect of elevated [CO2] on GHG fluxes at different growth stages
Elevated [CO2] increased emission of N2O, CO2 and CH4 at vegetative stage, but not at dough development or ripening stage in the present study. The greater CO2 fluxes under elevated [CO2] at the vegetative stage suggest higher plant and soil respiration, which is supported by the corresponding [CO2]-induced increase in wheat biomass at stem elongation (14%) and anthesis (13%) (Norton et al. Reference Norton, Lam, Chen, Fitzgerald, Armstrong, Dove and Culvenor2010). Therefore, the C input into soil at the vegetative stage was possibly greater under elevated than ambient [CO2]. In agreement with other studies (Arnone & Bohlen Reference Arnone and Bohlen1998; Wang & Adachi Reference Wang and Adachi1999; Kettunen et al. Reference Kettunen, Saarnio, Martikainen and Silvola2007), this suggests that the increased availability of C substrates for microbes under elevated [CO2] contributed to the increase in CH4 and N2O emissions between stem elongation and booting. This conclusion is supported by the positive correlation between the fluxes of CO2 and N2O and CO2 and CH4 at these vegetative stages.
There are two possible explanations why increased [CO2] did not affect the emission of the three gases at the dough development and ripening stages. First, N uptake by plant and N loss during the vegetative growth stage of wheat resulted in lower availability of mineral N at the dough development and ripening stages. Second, at these stages, wheat root activity and N uptake declined (Asseng et al. Reference Asseng, Ritchie, Smucker and Robertson1998; Palta et al. Reference Palta, Kobata, Turner and Fillery1994; Wechsung et al. Reference Wechsung, Wechsung, Wall, Adamsen, Kimball, Garcia, Pinter and Kartschall1995), which may have reduced the difference in C and N dynamics between [CO2] treatments.
In conclusion, while GHG emission from this semi-arid wheat cropping system may be stimulated in the future by an increased [CO2], the extent of stimulation could be lower in irrigated systems and/or in systems where the vegetative stage of crop growth is shortened (by increasing temperature) (Eitzinger et al. Reference Eitzinger, Orlandini, Stefanski and Naylor2010; Patil et al. Reference Patil, Laegdsmand, Olesen and Porter2010). Further study is required to quantify longer term fluxes of N2O, CO2 and CH4 in order to explore feedback mechanisms between [CO2] and GHG emission from cropping systems at various rainfall and temperature conditions.
This work was supported by the Grains Research and Development Corporation, the Federal Department of Agriculture, Fisheries and Forestry, the Victorian Department of Primary Industries, the University of Melbourne and the Australian Research Council. The authors thank Mr. Peter Howie and Mr. Russel Argall for field assistance, Dr Weijin Wang, Mr. Steven Reeves and Dr Helen Suter for assistance with gas analyses and Dr Xing Chen and Dr Huilin Li for soil chemical analyses.