Introduction
A valid biomarker for Alzheimer's disease (AD) will help to distinguish between cognitively impaired individuals with and without AD pathology. It will also help to identify those cognitively healthy individuals likely to develop cognitive decline over time (Breteler, Reference Breteler2011). Biomarkers are not tied to the clinical spectrum of the disease but instead reflect the presence of disease pathology. Therefore, they can both confirm the clinical diagnosis and provide a measure of pathological staging. Although not currently a requirement for diagnosis of AD, brain imaging data are increasingly regarded as biomarkers supporting the clinical diagnosis (Dubois et al., Reference Dubois, Picard and Sarazin2009; McKhann et al., Reference McKhann2011). Neuroimaging data also provide evidence of the brain substrate upon which the neurodegenerative process takes place, thus determining the rate of clinical expression of the underlying pathology.
Although brain imaging is less commonly performed in population studies than in clinical studies, the issue of underlying brain structural integrity may be particularly important in studies that draw their samples from the community at large. Being more representative of the base population than patients typically encountered in specialty memory disorder clinics, community study participants tend to be older, sicker, and often have less access to medical care. These differences can potentially attenuate the relationships between clinical deficits and structural abnormalities. Thus, it is essential to complement imaging biomarker studies from specialty clinical centers by replicating them at the community level. The Cardiovascular Health Study (CHS), for example, which conducts scans at academic medical centers, has provided valuable population-based data showing risk of incident dementia (Carmichael et al., Reference Carmichael2007) and the independent contributions of exercise and vascular risk to brain structure and dementia (Erickson et al., Reference Erickson2010).
However, in many population-based studies, it is not feasible for participants to utilize imaging facilities at major medical centers. Here, we report a case-control study within a newer population-based cohort. We performed MRI brain scans at a local community hospital, using the state-of-the-art Alzheimer's Disease Neuroimaging Initiative (ADNI) image acquisition protocol (Mueller et al., Reference Mueller2005), and applying two independent approaches to analyze the images remotely. The first goal of this study was to determine the feasibility of incorporating a magnetic resonance (MR) imaging protocol, acquired at a non-research imaging center, into a community-based study of brain aging. The second goal was to cross-validate the two independent image analytic approaches against each other as well as against the clinical assessments performed during the preceding month.
Methods
Study area, sampling, and recruitment
The study cohort, named the Monongahela–Youghiogheny Healthy Aging Team (MYHAT), is an age-stratified random sample of individuals aged 65 years or over, sampled from voter registration lists for a small-town region of southwestern Pennsylvania, USA (Ganguli et al., Reference Ganguli, Snitz, Lee, Vanderbilt, Saxton and Chang2009). The University of Pittsburgh Institutional Review Board approved the community outreach, recruitment, and assessment protocols. Recruitment criteria were (a) age 65 years or over, (b) living within the selected towns, and (c) not already in long-term care institutions. Individuals were ineligible if (a) they were too ill to participate, (b) had severe vision or hearing impairments, or (c) were decisionally incapacitated. Over a two-year period, 2036 individuals were recruited and enrolled. When asked whether they would consider participating in an MRI research study, 63% of the study participants responded affirmatively.
Overview of assessment
We first screened participants with the age/education-corrected Mini-Mental State Examination (Folstein et al., Reference Folstein, Folstein and McHugh1975; Mungas et al., Reference Mungas, Reed, Tomaszewski-Farias and DeCarli2005). We classified 54 individuals (2.7%) with scores below 21 as too severely impaired for a study of mild cognitive impairment (MCI) and did not assess them further. We then performed a detailed neurobehavioral assessment on the remaining 1982 participants, usually in their homes. We repeated this assessment annually thereafter. At each assessment, we classified participants according to several criteria for MCI. Here we focus on two definitions of MCI: a functional definition, using the Clinical Dementia Rating (CDR) (Hughes et al., Reference Hughes, Berg and Danzinger1982; Morris et al., Reference Morris1993), and a purely cognitive classification based on neuropsychological test performance relative to norms (Ganguli et al., Reference Ganguli, Snitz, Vander Bilt and Chang2010a).
Neuropsychological assessment and classification
We measured cognitive functioning with a detailed test neuropsychological battery (Ganguli et al., Reference Ganguli, Chang, Snitz, Saxton, Vanderbilt and Lee2010b). We categorized each test according to the principal cognitive domain that it assessed (attention/processing speed, executive function, language, memory, and visuospatial function) and created a composite score for each domain. We used these data for the previously described “cognitive classification” of participants as having (a) normal cognition (all domain composites within one standard deviation (SD) of the appropriate mean); (b) severe cognitive impairment (at least two domain composites worse than two SDs below the appropriate mean); or (c) MCI (at least one domain composite between one and two SDs of the appropriate mean) (Ganguli et al., Reference Ganguli, Snitz, Vander Bilt and Chang2010a). We further sub-classified those with MCI, based on the presence or absence of a memory deficit, into amnestic and non-amnestic MCI.
Clinical dementia rating
We also rated participants on the CDR scale, based on a standardized assessment protocol focused on cognitively driven everyday functioning, and which we rated independently of cognitive test performance (Ganguli et al., Reference Ganguli, Snitz, Vander Bilt and Chang2010a). We selected participants for the MRI study only if their summary CDR ratings were <1 (i.e. no dementia); thus, those included in the current study are all classified as CDR = 0 (normal) or CDR = 0.5 (very mild MCI).
Etiological classification
A Web-based, online diagnostic process developed for the MYHAT study (Weir et al., Reference Weir2011) allowed expert raters (JB, RD, BS, MG) to view relevant data for study participants on a secure website and render a diagnostic impression about likely etiology. Participants were etiologically classified into neurodegenerative (including AD), vascular, mixed degenerative and vascular, other (including depression, metabolic causes), and none (normal). Raters did not review the MRI data before rendering the etiologic classification. We selected the consensus or modal diagnosis for each participant. For the current analyses, we compared only the etiological groups designated as neurodegenerative and none (normal) as the other subgroups were too small in size.
Selection of participants for the MRI study
The time window for the MRI scan was no greater than one month after the nearest annual MYHAT clinical/cognitive assessment. Each time we recruited an MCI participant, we randomly selected two cognitively normal individuals matched on gender and age (±5 years) to serve as controls for the MCI case. Inclusion criteria for both cases and controls included willingness to undergo a brain MRI scan for research purposes, clinical study assessment within one month, absence of contra-indications to MRI, absence of clinical cerebrovascular disease (history of stroke or TIA), and CDR < 1. The first 52 participants (17 cases and 35 controls) who met the inclusion criteria underwent scanning; three controls were later reclassified as MCI based on revised norms; image datasets from three other controls were subsequently discarded because they did not meet quality control standards. The final study sample included 29 cognitively normal and 20 cognitively impaired participants.
MRI image acquisition
Participants underwent scanning on a 1.5T GE scanner at the MR Center of UPMC McKeesport, the community hospital located in the heart of the study area. The Department of Radiology at the hospital downloaded the Spoiled Gradient Recall (SPGR) sequence appropriate for their machine and software from the ADNI website (http://www.loni.ucla.edu/ADNI/Research/Cores/). Briefly, the image parameters were: 3D acquisition, sagittal, TR = 6.48 ms, TE = 1.488 ms, TI = 1000 ms, 192 slices of 1.2-mm thickness, flip = 8°, FOV = 24 × 24 cm2, image matrix = 256 × 256 × 1. Copies of all of the scans were sent to the University of Pittsburgh on CDs, and stored for later processing.
MR image analysis
Visual Rating Scale (VRS)
Individual SPGR scans labeled with the participant's age, sex, and study identification numbers, loaded on CDs, were provided to one of us (RD) for evaluation using a validated visual rating system (VRS) (Urs et al., Reference Urs2009). VRS ratings were performed on a standard coronal slice of 1.2-mm thickness, perpendicular to the AC-PC line, intersecting the midpoint of the mammillary bodies. Standardized rating of the degree of atrophy seen in the hippocampus and entorhinal and perirhinal cortices in each target image was compared to a set of reference images provided by the software in VRS that was developed for this purpose. The reference images depict five possible levels of atrophy for each structure to be rated (i.e. “0” for no atrophy and “4” for the most severe atrophy). The reliability for individual structures ranges between 0.75 and 0.94 for inter-rater reliability, and 0.87 and 0.93 for intra-rater reliability (Urs et al., Reference Urs2009). Only two MRI scans were rejected from this study because they had sufficient movement or positioning artifact to compromise reliable VRS ratings. A medial temporal atrophy score for each side of the brain was created by taking the average of the ratings for these three structures. Additional standardized visual ratings included cortical atrophy, the size of the lateral and third ventricles, and the extent of periventricular and subcortical white matter hyperintensities.
Semi-automated Volumetric Analysis (SVA)
Each of the image data sets was run through a processing pipeline that included bias field correction, intra- and inter-slice intensity normalization, rigid body registration to the Colin27 template, and affine and fully deformable registration to the Colin27 template (Teverovsky et al., Reference Teverovsky2011). Total intracranial volume was calculated following an atlas-based brain extraction from the skull, with the subsequent addition of the cerebrospinal fluid (CSF) volume between the surface of the brain and the inner table of the skull.
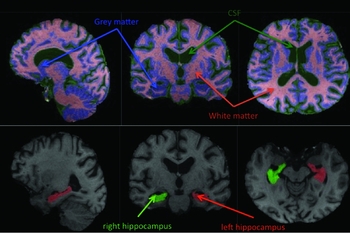
Each brain image was processed using the FMRIB's Integrated Registration and Segmentation Tool (FIRST, http://www.fmrib.ox.ac.uk/fsl/first/index.html) (Patenaude et al., Reference Patenaude, Smith, Kennedy and Jenkinson2011), which provides model-based segmentation and registration (see Figure 1). The output from the brain extraction was processed using FMRIB's Automated Segmentation Tool (FAST v4) (http://www.fmrib.ox.ac.uk/fsl/fast4/index.html) to identify the relevant structures, including the hippocampus, amygdala, nucleus accumbens, thalamus, putamen, caudate nucleus, globus pallidus, total gray matter (GM), total white matter (WM), and total CSF. The raw data were converted to percent of total intracranial volume (TIV) using the data acquired from the initial pipeline processing. The hippocampus segmentation was of inadequate quality for three scans, as identified by visual inspection.
Sample segmented images. (Top) Gray matter/white matter/CSF segmentation; (bottom) hippocampus segmentation.

Statistical analysis
We compared demographic and cognitive characteristics of the cases and controls using χ2 or Fisher's Exact tests, and t-tests or Wilcoxon two-sample test, as appropriate to the distribution of the given variable. Although our cases and controls were selected based on their cognitive classification, we also classified them according to the CDR and etiologic classification, which are independent of, and do not map entirely to, the cognitive classification. Mean VRS and SVA MRI measures were separately compared between these groups. Rank/order correlations were calculated between the overall distribution of the atrophy ratings and automated volumetrics.
Results
Of the 49 participants with complete data, 29 had been selected as cognitively normal controls for 20 individuals classified as MCI (14 of them amnestic MCI) based on the purely cognitive classification approach. On the functionally based CDR, 33 were rated as CDR = 0 (normal) and 16 as CDR = 0.5 (very mild impairment). On the web-based etiologic classification rendered by clinical raters, 28 were classified as none (normal) and 12 as neurodegenerative; the remaining, much smaller, etiological groups were not included in analysis. Since these three ratings were independent of one another, they do not overlap totally; three individuals who were clinically impaired, and one who was diagnosed as neurodegenerative, scored in the normal ranges on the neuropsychological tests.
The 20 MCI cases and 29 cognitively normal controls were similar in age (mean age of 78.6 years, with SD of 5.0 and 5.6, respectively), and gender (35% and 27.6% male). Difference in educational level (70.0% and 37.9% with greater than high school education) reached borderline significance (p = 0.065). The two groups were not significantly different in self-reported diabetes mellitus, hypertension, and current smoking status.
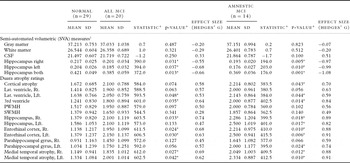
Cognitive classification (MCI vs. normal cognition) (Table 1)
Looking first at VRS, the overall cortical atrophy ratings, as well as the ratings of ventricular expansion, differed significantly between the MCI and normal groups. Measures of structural integrity in the medial temporal lobe, as well as the summary measures of medial temporal atrophy, significantly discriminated between the MCI and normal groups.
MRI measurements as a function of study group

+Appropriately tested by the t-test or Wilcoxon two-sample test.
*p <0.05.
† Expressed as a percentage of intra-cranial volume.
MCI = mild cognitive impairment; CSF = cerebrospinal fluid; Lat = lateral; RT = right; Lft = left; PWMH = periventricular white matter hyperintestine; SWMH = subcortical white matter abnormalities.
Next, looking at SVA, there were significant differences between the volumes of the right hippocampus, the left hippocampus, and the total hippocampal volume (bilaterally) in those with normal cognition compared with those with any MCI, and specifically those with amnestic MCI. By contrast, there were no significant differences in total GM, WM and CSF measures (expressed as a percentage of TIV) as a function of cognitive classification.
Thus, the expert visual ratings were more sensitive than the semi-automated volumetrics to the presence of MCI, as indicated by the greater number of brain regions that differed significantly in their atrophy ratings between groups.
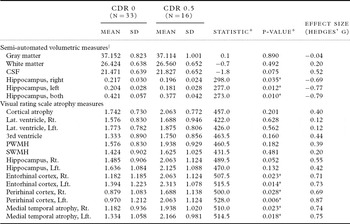
Clinical dementia rating (Table 2)
Similar patterns of association were found when we compared brain volumes as a function of CDR rating; the hippocampal regions and the total hippocampal volume successfully discriminated between the unimpaired (CDR = 0) and the mildly impaired (CDR = 0.5) participants. The summary VRS variables reflecting medial temporal atrophy (both right and left), as well as measures of the entorhinal and perirhinal cortices, were significantly different between groups. The SVA volumes of the left and right hippocampus, however, were not significantly different between groups.
MRI measurements as a function of CDR

+Appropriately tested by the t-test or Wilcoxon two-sample test.
*p < 0.05.
† Expressed as a percentage of intra-cranial volume.
CDR = Clinical Dementia Rating; CSF = cerebrospinal fluid; Lat = lateral; RT = right; Lft = left.
Etiological classification
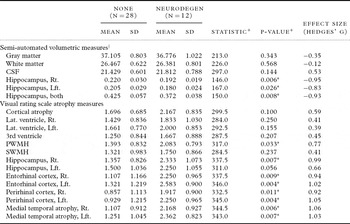
With regard to the VRS, a similar pattern was seen as (Table 3) for the CDR, which included the entorhinal and perirhinal cortices, and the medial temporal atrophy summary score. Periventricular white matter hyperintensities were present in a significantly greater proportion in individuals with presumed neurodegenerative etiologies than in the cognitively normal controls.
MRI measurements as a function of etiologic classification

+Appropriately tested by the t-test or Wilcoxon two-sample test.
*p < 0.05.
† Expressed as a percentage of intra-cranial volume.
CSF = cerebrospinal fluid; Lat = lateral; RT = right; Lft = left.
When comparing SVA between the individuals with presumed neurodegenerative etiology and those classified as normal, the hippocampal volume measurements, and in particular the right hippocampus and bilateral hippocampal volumes as assessed using the semi-automated techniques, significantly differentiated between the two groups.
Comparison of semi-automated and visual ratings
The correlations between the two approaches to measure CNS integrity showed consistent patterns between the two methods (Tables 4 and 5). The automated method for determining overall gray matter and white matter volume did not yield values that were significantly correlated with any of the visual atrophy ratings (Table 4). The total volume of CSF was, however, significantly correlated with the size of the third ventricle and that of the lateral ventricle on the right. However, no other correlations were statistically significant. The volumes of the hippocampal formation correlated significantly with the corresponding atrophy ratings (Table 5).
Spearman rank-order correlations between visual ratings and quantitative measures of atrophy and ventricular expansion

*p < 0.05.
Spearman rank-order correlations* between visual and quantitative measures of medial temporal (MT) lobe

*All correlation coefficients significant at p < 0.05.
Discussion
In this study we have demonstrated the feasibility of acquiring research-quality MRI data at local community facilities, and shown that the resulting information can be analyzed remotely using the same image analytic tools available at academic medical centers. We were able to distinguish cognitively normal individuals from those with MCI, using both volumetric and visual rating methods to measure atrophy of medial temporal structures. Our method of acquiring and analyzing the anatomical MRIs did not rely on the availability of new, higher field, and research center-based scanners. As such, our experience as reported in this study is potentially relevant to large-scale research projects devoted to understanding factors associated with the development of clinically significant abnormalities in cognitive functions.
The findings that we report here are not new; atrophy in the hippocampus and expansion of the ventricles have been noted for decades from research on aging and cognition using computed tomography (de Leon et al., Reference de Leon1984; de Leon et al., Reference de Leon, George and Reisberg1989) and MRI scans (de Leon et al., Reference de Leon1993). However, our data were acquired at a community hospital, which is rarely the case in neuroimaging research. This hospital was not only conveniently located for our study participants but also familiar to them, thus maximizing the likelihood of their consenting to undergo research scans. The alternative, requiring them to travel from the small mill towns of southwestern Pennsylvania into the city of Pittsburgh to be scanned at the University's MR Research Center, would have been viewed as an unreasonable burden. Here, the barrier to participation is more cultural than physical, and is related to the historic separation of the communities. In other regions of the USA (and perhaps elsewhere), actual physical distance and lack of available transportation may be additional limiting factors. If only a select few participants take part in an imaging study, the resulting sample bias can obviate some of the benefits of generalizability from using a true population-based sample. However, before utilizing convenient and familiar facilities for the imaging procedures, it is critical to demonstrate that the data that are acquired from such sites can be acquired and analyzed using the standard neuroimaging tools.
In terms of logistics and feasibility, both visual rating and volumetric methods of analysis worked smoothly and cost-effectively. In this study, the expert visual ratings showed greater sensitivity to the various clinical classifications than did this particular semi-automated volumetric approach to image analysis. The visual ratings can be easily completed by trained raters in any setting (e.g. study field office), and are constrained by fewer problems with image quality than are the mechanistic approaches. In other words, a visual rating of medial temporal lobe atrophy may be possible even when the image quality may preclude (in the absence of additional post-processing) automated analysis. As further external validation of our approach, the measures of medial temporal lobe atrophy that we obtained here did not differ significantly from previously reported findings in amnestic MCI in a clinic sample, using the same visual rating method (Duara et al., Reference Duara2008). More importantly, the measures of medial temporal atrophy among our cognitively normal community-based participants were significantly greater (i.e. showed more atrophy) in both the right (t(33) = 3.76, p < 0.001) and left (t(32) = 4.09, p < 0.001) hemispheres than those observed in the previous clinical study. This discrepancy reinforces the importance of selection factors, suggesting that the brains (or at least the temporal lobes) of putatively normal participants in a community-based study, representative of the general population, have suffered more damage, likely secondary to medical comorbidities, than have the brains of volunteers in academic research centers. Of course, inherent methodological differences between clinical and population studies might also have contributed to the differences in results.
A major advantage of the semi-automated volumetric approach is that large numbers of scans can be analyzed. Our data processing pipeline utilized state-of-the-art methodologies in order to “clean” the data, and then to reliably segment and classify brain regions. We used publicly available software on a distributed network within the research group, which optimized the time to complete the analysis. While other methods (e.g. Freesurfer) are increasingly popular because of the quality of the data, these techniques take a large amount of time to process an individual scan. Our pipeline was able to accomplish the entire process, start to finish, in less than one hour per scan. We were capable of running 6–9 scans at any given time, which means that the total amount of time taken to extract critical data from this data set was on of the order of 10 hours (i.e. overnight). A test-run of nearly 1000 brains was completed in less than one week. Alterations in brain structure are often small, and may coexist with other CNS abnormalities (e.g. small vessel disease and white matter hyperintensities). Therefore, studies must include a sufficient number of participants to provide sufficient power to disentangle the effects of the various independent variables on the expression of cognitive dysfunction. In large cohort studies (e.g. >2000 participants), where the MRI data do not need to be analyzed until all scans are acquired, an automated method will have advantages. Automated methods also have the advantage that no observer/rater training is necessary, and there is no need for intra- and inter-rater reliability checks (or measures of rater drift).
In this validation study, we examined the relative merits of semi-automated techniques for the measurement of both large and small structures in the brains of participants in an epidemiological study. We found that the measured volume of CSF, expressed as a proportion of the total intracranial volume, was significantly correlated with the size of the third ventricle and the size of the right lateral ventricle. We did not find correlations between the measures of overall cortical atrophy and the measured volumes of gray matter and white matter. However, with regard to the small structures of the medial temporal lobe, and in particular the hippocampus, we found large and statistically significant correlations between the semi-automated and visual rating systems. This means that, even for a structure as small as the hippocampus, the semi-automated technique is capable of reliably measuring volume of the structure as compared to the rated atrophy. Further, concurrent validity is provided by the fact that both the visual ratings and the semi-automated measurements were significantly associated with clinical classification, CDR, and presumed etiology. We have previously reported on the relationship between a different automated measure of ventricular expansion and a different visual rating of ventricular enlargement (Carmichael et al., Reference Carmichael2005a, Reference Carmichael2005b). We found that the correlation between the two measures was high, but there were significant outliers, some of which reflected problems with the semi-automated technique, and some of which reflected idiosyncratic ratings by radiologists.
Advances in neuroimaging have led to major improvements in understanding brain aging and the ways in which altered brain structure and function lead to cognitive impairment and dementia. While neuroimaging is standard in the diagnosis of vascular dementia (Chui et al., Reference Chui, Victoroff, Margolin, Jagust, Shankle and Katzman1992; Roman et al., Reference Román1993; Gorelick et al., Reference Gorelick2011), only the recently revised National Institute on Aging and the Alzheimer's Association (NIA-AA) criteria for the diagnosis of AD include structural MRI as a potential biomarker to confirm diagnosis and identify stage (McKhann et al., Reference McKhann2011). Further, it is now clear that data on brain structure (and preferably also brain function) are required to understand the impact of various comorbidities on the clinical expression of a neurodegenerative condition like AD (e.g. Raji et al., Reference Raji, Lopez, Kuller, Carmichael and Becker2009; Reference Raji2010; Reference Raji2012). Comorbid conditions such as cerebrovascular disease alter the substrate onto which an AD-type or related neurodegenerative process is expressed, decreasing the extent of cognitive or brain reserve (Satz, Reference Satz1991; Stern et al., Reference Stern, Alexander, Prohovnik and Mayeux1992; Satz et al., Reference Satz1993) and accelerating the clinical expression of the underlying neuropathology.
Thus, clinical research into cognitive impairment and dementia increasingly includes neuroimaging, and such research from tertiary care medical centers advances our understanding of these neurodegenerative processes. However, patients who participate in specialty clinic studies have many characteristics that set them apart from the rest of the community, potentially introducing selection bias into the research. Hence, results generated in specialty clinic studies must be replicated in population-based studies, allowing investigators to see the entire spectrum of the disease as it exists in the population at large. Conversely, the ability of population studies to perform high-quality assessments and diagnoses may increasingly depend on the availability of imaging data (if not of fluid biomarkers such as CSF) to confirm the diagnosis of concurrent disorders and identify predictors of future disorders. Yet, neuroimaging within representative population samples brings the challenge of implementing a clinical imaging protocol in a study cohort of individuals who are randomly selected from the population, are not seeking services, and often undergo their research assessments in their homes. The logistics of any imaging study must be sufficiently simple and flexible to engage the interest of such individuals and maximize their participation. It may be possible in the near future to design studies to process brain imaging data efficiently, and to integrate that information relatively quickly for subsequent analysis and identification of biomarkers of impending clinical disorder. When this has been accomplished, it will also become relevant to the care of patients in areas remote from tertiary medical care centers.
Conflict of interest
None.
Description of authors' roles
James T. Becker drafted the paper, provided critical revision of the paper for important intellectual content, participated in etiologic classification, and was responsible for volumetric analyses, analysis and interpretation of data, and statistical analysis, conception, and design. Ranjan Duara provided critical revision of the paper for important intellectual content, participated in etiologic classification, was responsible for visual ratings, analysis, and interpretation of data, and was involved in conception and design. Beth E. Snitz provided critical revision of the paper for important intellectual content, participated in etiologic classification, and was involved in conception and design. Ching-Wen Lee provided analysis and interpretation of data and was involved in statistical analysis. Chung-Chou (Joyce) Chang provided critical revision of the paper for important intellectual content, participated in statistical analysis, and was involved in conception and design. Leonid Teverovsky provided critical revision of the paper for important intellectual content and was involved in statistical analysis. Mary Ganguli provided critical revision of the paper for important intellectual content, participated in etiologic classification, carried out analysis and interpretation of data, and was involved in conception and design.
Acknowledgments
The authors thank the 52 MYHAT participants who underwent scans, and also the MYHAT research staff, particularly Amy Sinot, Kathryn McMichael, and Diane Kurta; Denise Davis and Daniel Galeza at the University of Pittsburgh Medical Center; as well as Annette Volbers and Dr. Shaikh Rashid at the MRI Center of UPMC McKeesport.
This research was supported in part by funds from the National Institute on Aging to M.G. (R01AG023651 and K24AG022035). Additional support came from the Neuroimaging Core of the Alzheimer's Disease Research Center at the University of Pittsburgh (AG05133), and we utilized analysis techniques developed in the context of the Cardiovascular Health Study–Cognition Study (AG020098; HC055222).