


Introduction
It is generally accepted that the greater part of the Antarctic ice sheet consists of accumulation zones and thus has a positive mass balance. In isolated areas around the margin, however, blue-ice areas exist, characterized by a negative net mass balance. In Dronning Maud Land, such areas are most commonly found in relation to nunataks, e.g. Reference Orheim and Lucchitta.Orheim and Lucchitta (1990), Reference Bintanja, van den Broeke and Portanger.Bintanja and others (1993). The wind pattern in the vicinity of the nunataks tends to disturb snowdrift so that little or no snow accumulates downwind. The combination of sublimation, which appears to be the essential source of ablation, and reduced accumulation causes this negative mass balance that eventually leads to exposure of the characteristic blue ice. e.g. Reference JonssonJonsson (1992), Reference Bintanja, van den Broeke and Portanger.Bintanja and others (1993).
Since air temperatures in Antarctica are well below the freezing point, past observations of melting in Dronning Maud Land have been confined to nunatak areas where blue ice is in contact with bedrock, rocks in the ice, or morainic material, all of which increase heat absorption (Reference Autenboer.Autenboer, 1962). On the McMurdu Ice Shelf, a dark ash layer inside the blue ice was reported to create sub-surface melt pools up to 1.5 m deep beneath a 30 cm ice cover (Reference PaigePaige, 1968).
Studies on a blue-ice area downslope of the Mizuho Plateau in east Dronning Maud Land have shown that the areas with negative mass balance result from the divergence of snowdrift related to katabatic winds on this north-facing slope (Reference Takahashi, Naruse, Nakawo and Mae.Takahashi and others, 1988). The Jutulgryta area, located about 1300 km to the west on the same type of slope, may well have the same origin. While it is beyond the scope of this paper to discuss the formation of the Jutulgryta blue-ice area, its resemblance to the east Dronning Maud Land blue-ire area is striking. The subsurface melting observed in Jutulgryta does not originate from local climate conditions related to nunataks, since the closest nunatak is more than 50 km away; nor have any impurities been found which could lead to internal melting as seen on the McMurdo Ice Shelf.
Reference Brandt and Warren.Brandt and Warren (1993) summarise studies of snow-temperatures with special emphasis on the occurrence of a temperature maximum below the surface, i.e. the “solid-state greenhouse” caused by solar-radiation penetration and absorption inside the snow and the fact that longwave radiative cooling is restricted to the surface. Brandt and Warren conclude that whereas the “solid-state greenhouse” within snow is questionable, the occurrence of melting inside blue ice probably results from the smaller extinction coefficient and lower albedo of ice.
This paper presents, to our knowledge, the first observed sub- surface melting in blue ice, and shows that the formation of this sub-surface melt layer can be modelled. Sensitivity analyses with special emphasis on the importance of physical properties of the surface are performed, and the formation and decay of special surface features, i.e. melt pools and icing, are discussed in the context of the sensitivity analyses.
The Field-Work Programme
A study of melt processes was carried out during the Norwegian Antarctic Research Expedition (NARE) 1993/94, from 24 December to 20 January. Ground observations of melting in Jutulgryta were first reported by Reference WintherWinther (1993), based on a short study during the NARE 1989/90. The observations were followed by remote-sensing analyses where remains of large basins of accumulated meltwater (classified as frozen “lakes”) were detected and enhanced from Landsat TM imaging (Reference WintherWinther, 1993).
Field-work during the NARE 1993/94 was concentrated near a large frozen “lake” with distinct Features of refrozen water on the surface (Fig. 1). We focused on a restricted area about 3 km in radius where the position determined by GPS was 71°23′55″S, 0°29′55″E, at an altitude of approximately 140 m a.s.l. Blue ice in Jutulgryta occurs mainly in isolated areas intersected by snowfields (Fig. 1). These are often related to convex surface shapes where exposure to wind is most prominent, as observed in east Dronning Maud Land (Reference Takahashi, Naruse, Nakawo and Mae.Takahashi and others, 1988). Since the surface topography undulates along the gentle northwesterly slope leading down to the Jutulgryta depression, blue-ice fields are common. constituting about 70% of the total blue-ice region (Fig. 1). The upper limit of this region is around 700 m a.s.l. where the slope decreases on the plateau Hellehallet. The lower limit for occurrence of blue-ice fields is near the grounding line where the land ice begins to float at the Fimbulisen ice shelf (Fig. 1).
Index map (top) and sub-section of a satellite-enhanced map (below) covering the blue-ice region in Jutulgryta. The dark areas art blue-ice fields which are intersected by the bright snowfields. Dark spots are takes, and the arrow refers in the area of field-work. To the lower right is the Hellehallet plateau, and Jutulgryta is to the upper left of the satellite map.

Five thermistor strings were drilled into the ice and snow at different locations. Two were installed in a blue-ice field and two in an adjacent snowfield. The last thermistor string was installed near the frozen “lake” where clear ice was covered with 0.2 m of densely packed snow. In the blue-ice field, water levels were measured in ablation stake holes as well as in extra boreholes. Pump tests in selected holes were performed in order to determine the rate of inflow. Reflectance (albedo) measurements were carried out with a SE-590 portable spectrometer, which measures reflectance in 252 discrete bands between 370 and 1110nm. In addition, an automatic weather station equipped with a satellite transmitter continuously made hourly scans of 11 different meteorological parameters at 4.45 m above surface, and hourly air temperatures were recorded 0.15 m above surface.
Sub-Surface Melting and Water Flow
Figure 2 presents sub-surface temperatures as recorded on 8 January. Significantly higher ice temperatures (6°C or more) were observed at stakes 50 and 53 located in a blue-ice field. The blue-ice observations indicate that the temperature remained at the melting point throughout the mouth of observations (Fig. 3). Stake 12 is a special case, however, since the profile consisted of clear ice covered by 0.2 m of snow. At the climate station and stake 3 the snow and ice transitions were found at 1.70 and 4.23 m depths, respectively.
Sub-surface temperatures recorded on 8 January 1994 around 2230h UTC.

Ice temperatures (stake 50) and air temperatures during the period 29 December–19 January.

The main uncertainties in measuring snow and ice temperatures result from the radiative heating of the sensors, since it is difficult to design a sensor that matches the spectral absorption of snow and ice (Reference Brandt and Warren.Brandt and Warren, 1993). To minimise the effect of radiative heating of the Unicurve 101DET thermistor sensors, white tape was applied as a coating, and the temperature readings were restricted to late evening and midnight when radiative heating of the sensors was minimal. Despite such precautions, positive temperatures of + 0.5°C were observed within the melt layer, with a tolerance of 0.2° given by the manufacturer.
Air temperatures measured at the 0.15 and 4.15 m levels were predominantly negative with a mean temperature of −2.8 C at 4.45 m. The temperatures rose above the melting point on several occasions, usually during the hours around noon. Sometimes these events did not result in visible melting on the surface, i.e., the snow and ice surface remained dry. In general, the predominantly negative surface temperatures appeared not to affect the continuous existence of a sub-surface melt layer in the blue ice.
In 1 m deep auger holes, water levels were conuntinuosly monitored during the observation period. A few days after the holes were drilled they tended to become narrower near the top and bottom due to refreezing, but the middle section about 0.5 m below the surface became wider from melting. At three locations water inflow was observed at depths of 0.32–0.41 m below the surface in newly drilled holes. This depth range coincides with the initial formation depth of water ponds that have been observed on the McMurdo Ice Shelf (Reference PaigePaige, 1968).
The widespread existence of this sub-surface melt and water-flow horizon was indirectly detected through pump tests where the auger holes were kept dry and the rate of inflow was measured. Since flow rates stabilised rather quickly and remained constant throughout 40 min of pumping, it is assumed that this permeable layer formed a continuous aquifer in the ice. The flow rate was also observed to change with time at one location where the inflow on 15 January was only half that on 12 January.
Conduction and Radiative Heating
At the surface the temperature is determined by the components of the energy budget: the solar radiation, the thermal infrared radiation and the turbulent exchanges of sensible and latent heat. However, incident solar radiation does penetrate the surface boundary and together with conductive heating controls the temperature inside the snow and ice. Thus, in order to treat the evolution of sub-surface temperatures, it is necessary to describe the extinction and absorption of solar radiation (0.3–3μm wavelength) inside the ice. In general, the downward flux F that penetrates the ice does attenuate exponentially following the expression (Reference Grenfell and Maykut.Grenfell and Maykut, 1977),

where z and λ denote depth and wavelength, respectively, and κλ is the spectral extinction coefficient of solar radiation within the ice. Reference Grenfell and Maykut.Grenfell and Maykut (1977) found κλ to decrease sharply near the surface due to the high energy absorption, particularly in the spectral range beyond 0.6μm. At depths greater than 0.10m, Reference Grenfell and Maykut.Grenfell and Maykut (1977) suggest that a net bulk extinction coefficient κ can be applied. If the incident radiation is measured only as spectrally integrated values over the short-wave range, the absorption below 0.10 m depth can be obtained by using a transmittance coefficient β(= F 10/F 0). Hence, the heat absorption from radiation is

where α is the albedo. From observations, Reference Grenfell and Maykut.Grenfell and Maykut (1977) found β to range front 0.18 in white ice to 0.43 in clear ice, indicating a wide range, but given the exponential nature of the radiation properties inside ice the variability of β becomes less important at the depths where melting occurs.
The heat conduction may be obtained by solving the transient one-dimensional heat equation (Reference Carslaw and JaegerCarslaw and Jaeger, 1959),

where k is the thermal conduction, ρ the density, c the specific heat of ice, T the temperature, and t the time. Due to the transparent characteristics of ice, temperature changes below surface are governed by the contribution from conduction (Equation (3)) and the absorption of radiative energy (Equation (2)):

Surface Conditions
The near-surface temperatures are characterized by a constant adjustment to the climate, which forces energy through the surface. The special optical and thermal characteristics of the surface layer will therefore be addressed. In situ observations revealed the development of an opaque crust on top of the clear ice. This crust closely resembles snow and under certain light conditions was difficult to distinguish from the accumulated snow in the adjacent snowfield. Reference Shumskii.Shumskii (1964) deals thoroughly with the phenomenon and employs three different terms for this white and opaque layer on top of clear ice, i.e. “sun weathering”, “radiational–thermal shielding” and “melt crust”. Here the term “radiation crust” is used, since the Jutulgryta surface was clearly a radiational phenomenon with troughs and crests oriented in the direction of the most intense solar radiation (around noon).
A similar ablation crust was never observed in the blue-ice areas near nunataks around the Norwegian Troll station. The nunatak-related blue-ice areas have been found to consist of clear ice at the surface with ripples of about 0.2 m spacing. This surface apparently differs significantly from the one observed in Jutulgryta.
Model Specifications
To model the evolution of sub-surface temperatures the ice-air interface temperature was chosen as the upper-boundary condition. Equation (4) was solved using the explicit finite-difference method from Reference Bintanja, van den Broeke and Portanger.Boggild (1990). Here Δz was set at 0.03 m at the surface and was allowed to expand to 0.3m at the lowest grid (at 15m). At this depth seasonal temperature variations can be neglected (Reference Greuell, Oerlemans. and OerlemansGreuell and Oerlemans, 1989) and thus serve as the lower-boundary temperature in this model. Time steps Δt were chosen to meet the stability criterion determined by Reference MortonMorton (1980),
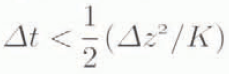
where K is the thermal diffusivity (=kg/c). The opaque surface crust as mentioned above led us to include an extinction coefficient of snow (20m−1) in the top 0.06m of the model. However, the jagged structure and low density of this crust do enable turbulent transfer of sensible heat within the layer, so the bulk heat dissipation through the crust far exceeds the contribution from conduction alone. Consequently, we have assumed that this layer is isothermal and follows the air temperatures. Thus, the temperature at the interface between the radiation crust and ice is set equal to the air temperature.
Sensitivity Analyses
The first set of simulations are carried out to analyze the initial formation of a sub-surface melting layer given conditions which can influence the radiative beating inside the ice. If no penetration of radiation were allowed, the results of the simulations would show entirely the effect of conductivity. In that case, no sub-surface melt layer could develop, since both the initial ice temperatures and the predominant air temperatures were significantly below the freezing point during the period. This Further illustrates that the melt laser is controlled strongly by the penetration and absorption of radiation which in turn is governed by the surface albedo α, the transmittance β and the extinction coefficient κ.
To match conditions in Jutulgryta our sensitivity experiments relied entirely on observed temperature and radiation data. Figure 4a–c show how the simulated temperatures at stake 12 evolve during a 5d period, when all but one of the parameters are held constant and no snow cover is assumed. Therefore, the simulated ice temperatures approach the temperatures measured in the blue-ice field (Fig. 2). By imposing new upper-boundary conditions we were able to study the effect of changing one parameter in great detail, since temperature adjustments to new surface conditions are most rapid at the beginning of the simulations.
Simulated profiles of temperatures vs depth based on air temperatures and global radiation during 5d from 27 December: (a) values of the extinction coefficient κ, (b) values of the transmittance coefficient β, (c) values of the albedo α.

During simulation all values exceeding the melting point in the model calculation were set equal to 0°C but melting was not considered. In relation to energy conservation this is not strictly correct. However, the volume of melting was small and considered negligible for the evolution of temperatures.
As can be seen in test 1 in Figure 4a, the increase of κ from 1.2 to 2.0 m−1 does not move the upper and lower boundaries of the melt layer markedly. This means that changing κ by 0.4 corresponds to a vertical shift of temperatures by 0.15 m at the most. The reference temperature profile is the initial condition for the simulation and is based on observations as described earlier. “No radiation” refers to the evolution of simulated temperatures based on conduction alone. Here a small temperature maximum below surface is entirely from diurnal fluctuation of surface temperatures.
In extreme cases κ has been found to range from 0.7 m−1 in totally clear (black) ice to 4m−1 in opaque white ice (Reference Gray and Male.Gray and Male, 1981). In Jutulgryta the solid ice below the ablation crust was observed to be rather homogeneous in all the blue-ice fields, indicating a narrower range of κ, which can be verified only by field observations.
Test 2 examines the effect of the transmittance (β) on the temperature profile. From detailed studies, Reference Grenfell and Maykut.Grenfell and Maykut (1977) found β to vary from 0.18 and up to 0.63 under especially cloudy conditions. The higher β values during cloudy weather result from less incident radiation to the surface in the infrared range (Reference Grenfell and Maykut.Grenfell and Maykut, 1977). Figure 4b summarises the result of changing β within these limits. Again, the resulting temperatures are influenced little by adjusting this parameter compared to the reference run with no radiation.
Test 3 examines the effect of albedo on temperature. From in situ reflectance along 25 evenly distributed points the albedo α was found to vary from 0.51 to 0.02 with a mean of 0.72 and a standard deviation of ±0.12. In spite of the apparent overall homogeneity of the blue ice, the measurements show surprising variability in the radiative values α. Two important changes are noticed as a result of letting α range between 0.51 and 0.92 in test 3. First, the melt layer barely develops within 5d with α near 0.90. Secondly, extreme α values can influence temperatures down to 4 m, which is evidently far beyond the melt layer. The three analyses described above clearly indicate that reflectance is the most important parameter and it can significantly influence the thickness of the melt layer. The transmittance (β) is of secondary importance since high β-factor values are found under overcast conditions when incoming global radiation is reduced (Reference Grenfell and Maykut.Grenfell and Maykut, 1977).
So far the focus has been on the effect of changing one parameter and keeping the others constant. In reality a natural interaction among all parameters is expected and can enhance the effect on both melt-layer thickness and sub-surface temperatures.
Melt Pools and Icing
Depressions are observed on horizontal planes on the blue-ice field and may vary in size and shape, but they mostly appear rather concentric with diameters from 1 to 5 m and depressions up to 0.5 m in the middle of the pools. Figure 5 shows one such pool at a clearly visible stage. Other pools had a brighter appearance, but still maintained the smooth surface, and others again could have the characteristic radiation crust described earlier.
A pool, The diameter is about 4 m. Notice the radiation crust outside the pool.

A measured albedo profile of one such pool has shown α to range from 0.80 at the margin to 0.44 in the center. This drop in albedo in the lowest section of the pool was associated with less scatter in the water contact under the smooth surface ice which was usually about 0.1 m thick. Beneath this clear ice lies a matrix of porous, loose, coarse-grained ice with densities ranging from 440 to 600 kgm−3 at 0.55 m depth.
The variety of physical appearance described above may illustrate separate time stages in the evolution of pools, along the following lines. First, a radiation crust develops. Next, water is trapped near the surface, reducing the surface albedo to, say, 0.44 and thus enhancing absorption and melting. The relatively low albedo and smooth surface ice have produced severe subsurface melting, evident from the development of loose, coarse-grained ice and the formation of a depression at the surface. As the water level gradually lowers, α rises and the radiation transmissivity is reduced inside the loose, coarse-grained ice, thus reducing the possibility of sub-surface melting. The cycle is completed when a radiation crust develops again, making the pool barely visible so that it appears as only a shallow depression on the surface.
Figure 6 shows the temperature evolution for the different stages described above. We have applied the initial temperature profile and simulation period as in the previous section on sensitivity analyses. However, in the first two of the following simulations, no radiation crust was included due to the appearance of clear ice on the surface. The stage of water contact is shown by curve 1 in Figure 6 where α is set to 0.44 from albedo measurements. As the water level lowers, α gradually rises to 0.60 which in turn reduces the thickness of the melt layer in curve 2. The final stage occurs when a radiation crust has developed (curve 4). Here κ has arbitrarily been set to 15m−1 due to the opaque nature of the loose, coarse-grained ice (snow is 20 m−1). Comparing curves 3 and 4 clearly illustrates the importance of κ at high α values. On the slopes a similar phenomenon was observed, but here the slope causes the sub-surface meltwater to flow out on to the surface where it freezes immediately (Fig. 7). The stage of low α due to water contact from below has not been observed and may not occur. The initially smooth surface was observed to become gradually whitish and rough and after about 2 weeks it developed into a full radiation crust. The icing phenomenon contributes to high variability in measured albedo which previous experiments have shown to be crucial for the thickness of the melt layer. Therefore, it is likely that the spatial distribution of the melt layer displays a complex three-dimensional pattern inside the observed ice fields, associated with both the slopes and the flat areas.
Simulated profiles of temperatures vs depth of pools at different time stages in the evolution and decay. For explanation see text.

Icing at stake 50, photographed on 10 January. The stake is 1.05m high. This smooth surface later started to develop into an ablation crust as can be seen outside the icing area.

Discussion and Conclusions
Various observations and measurements have shown that a sub-surface melt layer developed and persisted through a period where surface temperatures and the adjacent snow temperatures were well below the melting point. Horizontal inflow of meltwater was observed in newly drilled holes at a depth of about 0.4 m, and in the same holes the water level fluctuated daily. This may result from the delicate balance between radiative melting that would expand the thickness of the melt layer and the opposite effect, namely refreezing from above and below due to the existence of a temperature gradient at both boundaries.
The modelling experiments were conducted in order to explore the formation and sensitivity of a sub-surface melting layer and were based on an initial temperature profile not exposed to radiative heating. Radiation was allowed to penetrate and absorb inside the ice and modelled melt layer, and the temperature profile developed in agreement with observations. The most favourable conditions for this sub-surface melting are found in pools, since all three parameters (albedo, transmittance coefficient and extinction coefficient) favour more radiant energy penetrating the ice where it is absorbed.
Other factors, like exposure to the Sun and surface roughness, may also contribute to sub-surface melting. But the data from Jutulgryta are limited and restrict the possible level of model sophistication. To obtain better estimates of sub-surface flow and runoff from Jutulgryta or similar areas, more detailed measurements will be needed. It is clear that the continuous existence of the sub-surface melt layer during the melt season does not restrict the possibility of runoff to a few yearly events with air temperatures near or above the melting point which is required for surface runoff to occur. The “invisible” nature of this sub-surface melting and runoff phenomenon is generally confined to a narrow range of summer mean air temperatures, since a slight increase in air temperature will result in “classical” surface melting, whereas a cooling will probably disable sub-surface melting. Further analysis of the range of air temperatures under which sub-surface melting can occur may result in this phenomenon serving as a future benchmark for possible climate changes.
Our final comment is that the finding of this widespread “solid-state-greenhouse” melt layer in Jutulgryta may contribute to the understanding of runoff from the Greenland ice sheet, because similar surface features, i.e. frozen lakes and blue-ice fields intersected by snowfields, have been documented near the equilibrium line in both East and West Greenland (Reference Echelmeyer, Clarke and Harrison.Echelmeyer and others, 1991; Reference Reeh, Oerter and Neve.Reeh and others, 1991).
Acknowledgements
The authors would like to thank all the participants in the Nordic Antarctic Research Programme 1993/94, which was excellently organised by Svensk Pofarforskningssektretariat. N. Reeh and H.H. Thomsen from the Geological Survey of Greenland are thanked for their critical comments and suggestions on an earlier version of the manuscript. The research programme was funded by the Research Council of Norway and the Danish Natural Science Research Council. This is publication No. 142 of the Norwegian Antarctic Researeh Expeditions (1993/94). C.E.B. publishes by the permission of the Geological Survey of Greenland.



