Heritage speakers are early bilinguals who, under varying conditions of exposure, acquired their first language (L1) naturalistically in the home environment and later (or simultaneously) acquired a second language (L2) in the broader community and in school. As they constitute a heterogeneous group, Zyzik (Reference Zyzik, Beaudrie and Fairclough2016) proposes understanding heritage speakers in terms of a cluster of attributes that include early language exposure, implicit knowledge, and proficiency that is restricted to basic language cognition (Hulstijn, Reference Hulstijn2015). Heritage speakers are native speakers of their L1 (Kupisch & Rothman, Reference Kupisch and Rothman2018; Rothman & Treffers-Daller, Reference Rothman and Treffers-Daller2014), and yet, they are likely to perform differently from monolingual native speakers on any number of linguistic tasks. In the current study, we focus specifically on the performance of heritage speakers (HSs) on grammaticality judgment tasks (GJTs), which are controversial for a number of reasons. Boon and Polinsky (Reference Boon and Polinsky2014), Orfitelli and Polinsky (Reference Orfitelli, Polinsky, Kopotev, Lyashevskaya and Mustajoki2017), and Polinsky (Reference Polinsky and Pascual y Cabo2016) argue that GJTs are not an appropriate method for HSs because of the potential impact of extra-grammatical factors (e.g., processing limitations and testing anxiety). Boon and Polinsky also suggest that HSs display a “lack of faith in their own intuition” (p. 12) that may affect their judgments. To our knowledge, there are no studies that examine HSs’ confidence or certainty in relation to their ability to judge sentences in their heritage language (HL). Thus, it remains an open question whether all native speakers—including HSs—display a high degree of certainty in grammaticality judgments (Rebuschat, Reference Rebuschat2013; Rebuschat, Hamrick, Sachs, Riestenberg, & Zeigler, Reference Rebuschat, Hamrick, Sachs, Riestenberg, Zeigler, Bergsleithner, Frota and Yoshioka2013).
We assume that grammaticality judgments are a type of performance data that may be influenced by any number of processing and extra-grammatical factors (cf. Allen & Seidenberg, Reference Allen, Seidenberg and MacWhinney1999; Ellis, Reference Ellis1991; Gass, Reference Gass, Tarone, Gass and Cohen1994; McDonald, Reference McDonald2006; Sorace, Reference Sorace, Ritchie and Bhatia1996). This does not necessarily invalidate their use, but requires sensitivity in interpretation. Following Cowart (Reference Cowart1997) and Schütze and Sprouse (Reference Schütze, Sprouse, Podesva and Sharma2014), we use the term acceptability judgment task (AJT) rather than GJT because grammaticality is an abstract concept that cannot be measured directly. The two AJTs used in the present study are identical in terms of format (bimodal and binary response) but differ with respect to their content. The first task, best described as a traditional AJT, asked participants to evaluate (un)grammatical sentences that conform to or violate rules of Spanish morphosyntax. In contrast, the second task focused on the lexical domain by including conventional (i.e., attested) and creative derivatives that are possible, yet not attested. As derivational morphology is acquired later than inflectional morphology (Kuo & Anderson, Reference Kuo and Anderson2006) and develops considerably with literacy, the second task is expected to be more difficult for HSs. Confidence ratings were obtained for all items on both tasks in order to empirically test the assumption that HSs are affected by uncertainty when responding to stimuli on AJTs.
In addition to measuring confidence, this study also examines language dominance as an independent variable. Most characterizations of HSs assume dominance in the nonheritage language (cf. Benmamoun, Montrul, & Polinsky, Reference Benmamoun, Montrul and Polinsky2013; Scontras, Fuchs, & Polinsky, Reference Scontras, Fuchs and Polinsky2015). As noted by Montrul (Reference Montrul2018), “The vast majority of young adult heritage speakers in the United States are unbalanced bilinguals with stronger command of English than of the heritage language” (p. 531). Nevertheless, Spanish-dominant bilinguals have been identified in a number of studies in the US context. For example, Gollan, Weissberger, Runnqvist, Montoya, and Cera (Reference Gollan, Weissberger, Runnqvist, Montoya and Cera2012) reported that 40% of their participants who reported dominance in Spanish were objectively Spanish dominant. In that study, the Spanish-dominant bilinguals learned English later (mean age of first exposure was 6.4) and reported using Spanish relatively more often during their childhood and as young adults. Another example is Amengual (Reference Amengual2018), in which the Spanish-dominant participants had arrived in the United States between the ages of 6 and 11, with age 8.2 being the average age of exposure to English. Similarly, Amengual (Reference Amengual2016) tested 13 Spanish-dominant HSs, whose average age of exposure to English was 4.5. In the current study, we grouped participants according to their relative dominance in Spanish and English using the Bilingual Language Profile (Birdsong, Gertken, & Amengual, Reference Birdsong, Gertken and Amengual2012) with the goal of clarifying how language dominance might impact performance on AJTs.
Background
Methodology in HL research
Data collection in HL research spans a wide range of techniques, including naturalistic observation (e.g., Silva-Corvalán, Reference Silva-Corvalán2018), oral production tasks designed to elicit specific linguistic structures (e.g., Bayram et al., Reference Bayram, Rothman, Iverson, Kupisch, Miller, Puig-Mayenco and Westergaard2017), comprehension tasks such as sentence–picture matching (e.g., Polinsky, Reference Polinsky2011), and psycholinguistic tasks such as self-paced reading (e.g., Keating, Jegerski, & VanPatten, Reference Keating, Jegerski and VanPatten2016). In addition to these methodological tools, the AJT has figured prominently, allowing researchers to test one linguistic structure or a set of related structures (e.g., Montrul & Bowles, Reference Montrul and Bowles2009; Montrul, Bhatt, & Girju, Reference Montrul, Bhatt and Girju2015). The most popular option has been a scalar AJT consisting of a 4-point Likert scale, sometimes with an additional option for “I don’t know/I’m not sure.” Binary AJTs have also been used (e.g., Bylund, Abrahamsson, & Hyltenstam, Reference Bylund, Abrahamsson and Hyltenstam2010; Rinke & Flores, Reference Rinke and Flores2014). Finally, because written AJTs often presuppose an acute disadvantage for HSs, auditory or bimodal AJTs have become commonplace in the field. A bimodal AJT was used by Kupisch et al. (Reference Kupisch, Lein, Barton, Schröder, Stangen and Stoehr2014), but instead of judging stimuli, participants were asked to repeat the sentences they deemed acceptable and correct (orally) sentences they judged to be faulty. In some ways, this kind of AJT bears similarity to the elicited imitation task because it is reconstructive (see Suzuki & DeKeyer, Reference Suzuki and DeKeyser2015, for discussion of elicited imitation).
As mentioned above, the use of AJTs in HL research has been questioned. Polinsky (Reference Polinsky and Pascual y Cabo2016) argues that many HSs perform poorly on AJTs because of their reluctance to reject ungrammatical sentences, resulting in overacceptance (i.e., yes bias). Polinsky explains that “the ability to rate forms as unacceptable or ungrammatical requires greater metalinguistic awareness” (p. 335). Moreover, Polinsky suggests that HS performance on AJTs may stem from a sense of linguistic insecurity, which leads them to assign higher ratings to ungrammatical items. Orfitelli and Polinsky (Reference Orfitelli, Polinsky, Kopotev, Lyashevskaya and Mustajoki2017) present substantial arguments against the use of AJTs with nonnative speakers, including HSs in their discussion. Their concerns focus on the difficulty that this population has with rejecting ungrammatical items, which may stem from processing-related factors and/or difficulty with making conscious, metalingual judgments. They demonstrate that HSs perform better on comprehension-based tasks, such as sentence–picture matching and truth-value judgment tasks, even when displaying poor performance on a parallel AJT. Orfitelli and Polinsky (Reference Orfitelli, Polinsky, Kopotev, Lyashevskaya and Mustajoki2017) conclude that it is problematic to draw conclusions about the underlying grammar of HSs solely based on results from AJTs, and thus, argue for comparable data from additional tests.
The suggestion of linguistic insecurity noted by Polinsky (Reference Polinsky and Pascual y Cabo2016) has been mentioned in other studies.Footnote 1 Pascual y Cabo (Reference Pascual y Cabo2016) notes that Spanish HSs displayed “a higher degree of uncertainty and variability” (p. 43) than monolingual controls on some portions of an AJT designed to test psychological predicates; HSs indicated “I don’t know” more often than the control group, whose responses tended to be more homogeneous. In their study of Inuit receptive bilinguals, Sherkina-Lieber, Pérez-Leroux, and Johns (Reference Sherkina-Lieber, Pérez-Leroux and Johns2011) found that participants’ responses on a comparative judgment task were inconsistent and that many receptive bilinguals accepted both grammatical and ungrammatical items in a given pair of sentences (i.e., yes bias). The authors conclude that lower accuracy and higher variability are indicative of the speakers being “insecure about their intuitions” (p. 312). Likewise, Rinke and Flores (Reference Rinke and Flores2014) suggest that HSs of Portuguese overaccept ungrammatical items due to a “lack of confidence in their linguistic intuition” (pp. 688–689). Although low confidence may be a factor in these studies, strictly speaking, it cannot be concluded from accuracy data alone. For this reason, we included confidence ratings to determine if HSs lack certainty in their judgments when responding to stimuli.
Task stimuli
Any study that utilizes AJTs must address the possibility that participants may perform better on grammatical than ungrammatical items (or vice versa). This has been a major methodological question in second language acquisition (SLA) research, often coupled with comparisons between timed and untimed judgment tasks (cf., Godfroid et al., Reference Godfroid, Loewen, Jung, Park, Gass and Ellis2015; Shiu, Yalçin, & Spada, Reference Shiu, Yalçın and Spada2018; Vafaee, Suzuki, & Kachisnke, Reference Vafaee, Suzuki and Kachisnke2017). Given that the current study did not set out to compare timed versus untimed tasks, we limit our discussion to the issue of task stimulus.
Ellis (Reference Ellis2005) reported on a battery of tests that included timed and untimed AJTs. Among the significant findings was an effect for type of item: grammatical sentences on the untimed AJT correlated more strongly with tests of implicit knowledge (e.g., elicited imitation, oral narrative, and timed AJT). This led Ellis to conclude that “the grammatical and ungrammatical sentences appear to measure different constructs” (p. 167). On this view, grammatical items measure implicit knowledge whereas ungrammatical items constitute a measure of explicit knowledge. This result was later corroborated by Gutiérrez (Reference Gutiérrez2013), who found that L2 learners of Spanish performed significantly worse on the ungrammatical items in both timed and untimed AJTs. Task stimulus (grammatical vs. ungrammatical items) had a larger effect than time pressure for L2 learners. Most recently, Vafaee et al. (Reference Vafaee, Suzuki and Kachisnke2017) argue that AJTs are more of an explicit measure when compared to online comprehension tasks such as self-paced reading. Using confirmatory factor analysis, Vafaee et al. found that the ungrammatical items from the AJTs, irrespective of time pressure, were a more valid measure of explicit knowledge. The grammatical items were ultimately not included in the model, leading the authors to suggest that “the grammatical sentences in AJTs behave differently from the remaining measures” (p. 88). Despite methodological differences between these studies, and some disagreement regarding what they mean for the constructs of implicit and explicit knowledge, they have all found significant differences between participants’ performance on grammatical versus ungrammatical items.
Previous studies that utilized an AJT with HSs most often report comparisons between groups, but they do not take into account the variable of task stimulus. For example, Bylund et al. (Reference Bylund, Abrahamsson and Hyltenstam2010) report a comparison between Spanish-speaking bilingualsFootnote 2 in Sweden and monolinguals in Chile. On an aural AJT, the bilinguals scored significantly lower than the monolinguals, but statistics are presented for the test as a whole and not by type of item. Similarly, Bowles (Reference Bowles2011) showed that HSs of Spanish scored significantly lower on both timed and untimed AJTs than a control group, which consisted of speakers who were raised monolingually and had completed at least secondary school in Spanish (the difference was nearly 30 percentage points on the timed AJT). However, the data were not analyzed further by task stimulus.
The preceding discussion is relevant to the current study because it is widely assumed that HSs have greater implicit than explicit knowledge of their HL (cf. Zyzik, Reference Zyzik, Beaudrie and Fairclough2016). Assuming that ungrammatical items are more likely to draw on a speakers’ explicit knowledge, as proposed by a number of SLA researchers, we predict that HSs will have more difficulty with ungrammatical than with grammatical items. However, this predicted difficulty may be mitigated by individual factors, such as the degree of dominance in Spanish.
Confidence ratings
Confidence ratings are routinely used in experimental psychology, particularly in research designs that include exposure to an artificial or semi-artificial grammar learning (AGL). In this line of inquiry, researchers are interested in determining whether exposure to an artificial language results in conscious (explicit) or unconscious (implicit) knowledge (see Norman & Price, Reference Norman, Price and Overgaard2015; Rebuschat, Reference Rebuschat2013, for comprehensive overviews). One indicator is the relationship between performance on a judgment task and what participants think of their own performance, specifically the degree of confidence in their judgments. As confidence ratings give us information about what participants think they know, they are considered a subjective measure of awareness. In contrast, participants’ ability to discriminate between grammatical and ungrammatical sentences is an objective measure. Data collected from confidence ratings can be analyzed in a variety of ways, but AGL research is primarily interested in the relationship between confidence and accuracy. First, researchers look to see whether participants scored significantly above chance on items for which they claimed to have no confidence. If this is the case, then there is evidence for implicit knowledge according to the guessing criterion. A second insight comes from the zero-correlation criterion, which hypothesizes that accuracy and confidence are not correlated if participants are relying on implicit knowledge (Dienes, Altmann, Kwan, & Goode, Reference Dienes, Altmann, Kwan and Goode1995).
It must be emphasized, however, that when participants make a grammaticality judgment, two layers of knowledge are being utilized: structural knowledge and judgment knowledge (Dienes, Reference Dienes2008). This distinction is crucial for understanding how native speakers make grammaticality judgments. Dienes explains that native speakers can tell if a sentence is grammatical or not and be very confident in their judgment, which is indicative of conscious judgment knowledge. In contrast, their structural knowledge is almost entirely unconscious, as evidenced by the fact that they cannot explain why their judgment is correct. The coexistence of unconscious structural knowledge and conscious judgment knowledge is what underlies native speaker intuition. Rebuschat (Reference Rebuschat2013) states that “[this] explains why, in the case of first language knowledge, people can be very confident in their grammaticality decisions without knowing why” (p. 611).
To summarize thus far, a confidence rating measures the degree of certainty in the participant’s judgment knowledge; it is not meant to provide a measure of confidence in one’s structural knowledge.Footnote 3 In natural language, native speakers may have unconscious structural knowledge while at the same time displaying very robust judgment knowledge. In other words, when native speakers are using intuition, the guessing criterion may not hold, and moreover, there may be a strong relationship between accuracy and confidence.
In SLA research, confidence ratings have been used less systematically and in slightly different ways from most AGL studies. Ellis (Reference Ellis2005), in the study referenced earlier, included a percentage scale (0–100%) to measure confidence in the untimed AJT. The results indicated a positive correlation between accuracy on the ungrammatical items and confidence (r = .31) as well as between accuracy on the grammatical items and confidence (r = .32). This led Ellis to reject his initial hypothesis that participants would show greater confidence when drawing on their implicit knowledge (assuming that grammatical items are tapping implicit knowledge). Vocabulary research, in contrast, has utilized confidence ratings as a measure of how well word knowledge is consolidated. For example, Otwinowska and Szewczyk (Reference Otwinowska and Szewczyk2017) used confidence ratings in their study on cognate word learning in order to determine when participants were guessing. Pellicer-Sánchez (Reference Pellicer-Sánchez2016) added confidence ratings to a series of offline tasks (form recognition, meaning recall, and meaning recognition), which showed that participants had displayed greater certainty on the receptive measures.
From a methodological standpoint, we note that a confidence scale can be constructed using a variety of response alternatives (i.e., binary or multiple-alternative scales). We opt for the approach used in recent AGL research (cf. Rebuschat et al., Reference Rebuschat, Hamrick, Sachs, Riestenberg, Zeigler, Bergsleithner, Frota and Yoshioka2013; Rogers, Révész, & Rebuschat, Reference Rogers, Révész and Rebuschat2016), in which four levels of confidence are provided as options: not confident at all (guessing), somewhat confident, very confident, or 100% confident (absolutely certain). The fact that the levels of confidence were labeled for participants means that it is no longer an interval scale but rather a rank-ordered one (1 indicates more confidence than 0; 2 indicates more confidence than 1, etc.). Because we cannot assume that the intervals between levels of confidence are psychologically equidistant from each other, the data are analyzed as a categorical variable.
The current study
Research questions
Motivated by the gap in the literature on HSs’ subjective awareness of their own performance on AJTs, we designed a study to compare two judgment tasks that differed in terms of content and type of (un)grammaticality. While the first task was aimed at probing categorical violations of morphosyntax, the second task contrasted complex words in Spanish (e.g., escasez “shortage”) with what we have labeled creative derivatives (e.g., escasidad). We expect that HSs will have some difficulty in rejecting these creative derivatives because they are possible words, but blocked by the presence of the conventional or established forms (more details about the stimuli are provided in the description of Task 2). In making this prediction, we draw on research findings that show that high-proficiency HSs may be similar or identical to majority language speakers in terms of morphology and syntax, but not in the lexical domain (Kupisch, Reference Kupisch2013; Kupisch et al., Reference Kupisch, Lein, Barton, Schröder, Stangen and Stoehr2014; Treffers-Daller, Daller, Furman, & Rothman, Reference Treffers-Daller, Daller, Furman and Rothman2016). The specific research questions are outlined below:
a. On a traditional AJT (Task 1), how do participants respond to grammatical versus ungrammatical items? Are there differences between HSs as a function of language dominance?
b. On a lexically focused AJT (Task 2), how do participants respond to conventional and creative derivatives? Are there differences between HSs as a function of language dominance?
c. Are HSs as confident in their responses as monolingual NSs? Is confidence related to accuracy?
We decided to group participants according to their relative dominance in Spanish and English using the Bilingual Language Profile (BLP). This self-report questionnaire taps the multiple dimensions of language dominance by including a number of questions that are organized into four modules: language history, use, proficiency, and attitudes. Each module receives equal weighting and produces a language-specific score (e.g., one for Spanish and one for English) as well as a global score of dominance (for more information, see Gertken, Amengual, & Birdsong, Reference Gertken, Amengual, Birdsong, Leclercq, Edmonds and Hilton2014). If the language-specific scores were equal, then the global score would be exactly 0 and the participant might be considered a “perfectly balanced” bilingual. In our study, participants with negative dominance scores were classified as Spanish dominant, whereas the ones with positive scores were classified as English dominant. The use of 0 as a cutoff has been used to group participants in a number of studies (cf. Amengual & Chamorro, Reference Amengual and Chamorro2015), although other cutoffs are possible (see Simonet, Reference Simonet2014, for a study in which the BLP data was used as the basis for three participant groups). Moreover, as dominance is gradient, we also used the BLP scores to conduct a continuous analysis.
Participants
A total of 75 native Spanish speakers participated in this study. There were 57 bilingual HSs, all matriculated students at a public university in Central California. The majority had some formal study of Spanish, although a small number (n = 5) had 1 year or less of coursework. Most of the HSs (n = 51) are sequential bilinguals, having learned Spanish from birth and English sometime afterward, in early childhood. The simultaneous bilinguals (n = 6) indicated having learned both Spanish and English from birth. The majority of the bilinguals reported that their parents were born in Mexico; there were 5 participants whose parents immigrated from other Latin American countries (Guatemala, El Salvador, or Perú), and only 1 participant reported having a US-born parent. Participants completed a language background questionnaire followed by the BLP, which was subsequently used to divide the HSs into two groups based on their dominance score: those with dominance scores below 0 were classified as Spanish dominant (n = 21), and those with dominance scores above 0 were classified as English dominant (n = 36).
The monolingual group (n = 18) was tested in Querétaro, Mexico. These participants were recruited in the community, and their highest level of formal education was as follows: 2 participants reported having finished high school, 11 had some university coursework, and 5 had completed a university degree. Table 1 summarizes the demographic data of the participant groups, including mean age (standard deviations in parentheses), mean age of exposure to English, and self-reported daily use of Spanish and English (where 1 represents only Spanish and 9 represents only English).
Participant demographic data

Note: Typical daily use is based on the following scale: 1 = only Spanish and 9 = only English.
Procedure
Both tasks were built and delivered with SuperLab software. Instructions for the experiment were presented in English and Spanish for the bilinguals tested in the United States, and in Spanish for the monolinguals in Mexico. Participants used a response pad to indicate their judgments, pressing the green button if the sentence was acceptable and the red button if the sentence was not acceptable. Each sentence remained on the screen for 6000 ms,Footnote 4 and afterward a confidence rating was elicited with the question “How confident are you?” Participants indicated their confidence using one of four white buttons at the top of the response pad; this response was not timed, and no reaction times were recorded. Each task began with six practice items in order to familiarize participants with the response pad and the confidence scale. The order of the experimental items in each task was randomized.
At the beginning of the experimental session, participants filled out a consent form and then completed the BLP on paper (in either English or Spanish). Then they proceeded to complete Task 1 and Task 2, with a 5-min break in between. Participants were tested individually and were compensated for their participation in the study. The experimental session took between 40–50 minutes.
Task 1
Stimuli
The stimulus materials for the traditional AJT consisted of 60 sentences that were counterbalanced between grammatical (30) and ungrammatical items (30), which were based on the structures tested by Bowles (Reference Bowles2011), with some minor modifications.Footnote 5 Because the response format was binary, we only included items that do not require a larger discourse context to be interpreted. Furthermore, all of the ungrammatical items represent morphosyntactic violations that are not subject to regional and/or social variation. Examples of the experimental items are given in Appendix A.
All sentences were recorded by a native speaker of Mexican Spanish using a normal speech rate. These recordings were used to create a bimodal AJT in which participants saw and heard each experimental sentence simultaneously. Participants were asked to give a yes/no judgment for each sentence. The instructions were framed in terms of acceptability (“decide if the sentence is an acceptable way of saying things in Spanish”) and included a clarification that all spelling and punctuation were correct. Participants were instructed to make their decision as quickly and accurately as possible. After each judgment, participants indicated their degree of confidence using one of four options: no confidence (guessing), somewhat confident, very confident, and absolutely certain (100% confident).
Data analysis
Data from the binary judgments were coded as correct (assigned a value of 1) and incorrect (assigned a value of 0). In order to account for response bias, d prime (d´) was calculated for the judgment data; this is a measure of sensitivity that is calculated based on hit and false alarm rates (cf. Macmillan & Creelman, Reference Macmillan and Creelman2004). Items on which participants did not respond within the time limit were removed from further analysis. This is important as previous studies (cf. Bowles, Reference Bowles2011) have coded such nonresponses as incorrect. There were very few nonresponses in our judgment data (15 out of a total of 4,500 responses). Reaction times for the yes/no judgments were measured but will not be analyzed here because our research questions are not focused on the issue of response latency. With respect to the confidence ratings, these were analyzed as a categorical variable with four levels (0, 1, 2, 3). Nonresponses on the confidence question were also treated as missing data (35 out of a total of 4,500 confidence ratings). Finally, the dominance scores from the BLP were included as a continuous variable.
The accuracy data were analyzed using a mixed-effects logistic regression with participants and items as random variables, employing package lme4 for R (Bates, Maechler, Bolker, & Walker, Reference Bates, Maechler, Bolker and Walker2014). The model included item type (grammatical and ungrammatical) as a between-item fixed effect and group (monolingual, Spanish-dominant heritage speaker [SDHS], and English-dominant heritage speaker [EDHS]) a between-subject, within-item fixed effect. All variables were deviation coded. The group factor was coded using two dummy factors: SDHS versus monolinguals, and SDHS versus EDHS. We used maximal models, including all fixed effects, by-subject and by-item random intercepts, as well as a by-subject random slope for item type and a by-item random slope for group.
Results
Accuracy
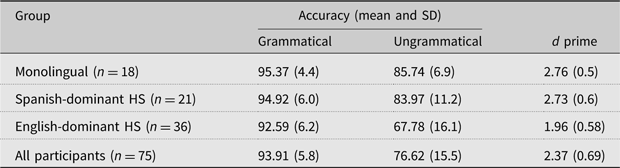
Table 2 presents the descriptive statistics for both conditions and d´ values. Focusing on d´ as a dependent variable, a one-way analysis of variance confirms a statistically significant difference, F (2, 74) = 17.49, p < .001, and Bonferroni post hoc tests show that this effect is due to the lower mean score of the EDHS group (p < .001 for both comparisons).
Descriptive statistics for Task 1

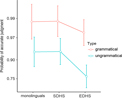
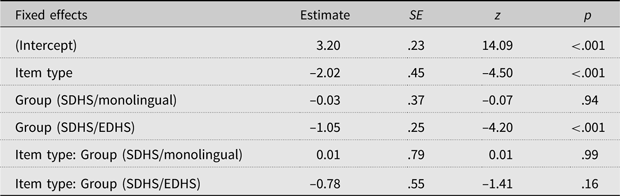
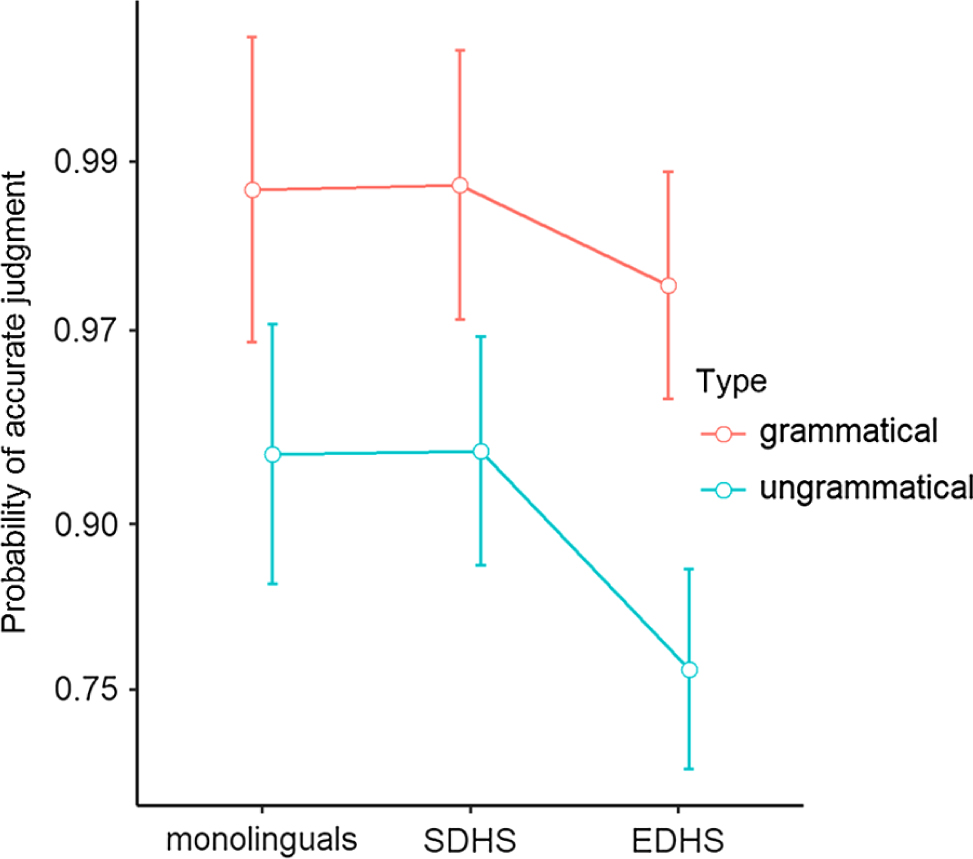
We now turn to the results of the mixed-effects model shown in Table 3. The effect of item type was significant: ungrammatical items were less likely to be judged accurately. There was also a fixed effect for group: the EDHS group was less likely than the SDHS group to judge items accurately. There was no significant interaction between item type and group. These results are visualized in Figure 1, which shows the probability of an accurate judgment for the two types of items (grammatical and ungrammatical) for the monolingual, EDHS, and SDHS groups.
The predictions of the mixed-effects logistic regression model for Task 1. Whiskers indicate 95% confidence intervals. The results were back-transformed to the probability scale.
Summary of the fixed effects in the mixed-logit model (Task 1)

Note: Coefficients are given in log-odds. Significant positive coefficients indicate increased log-odds (and thus increased probability) of an accurate judgment.
Language dominance
The data were analyzed to determine if language dominance (a continuous variable) is a predictor for accuracy. We ran two simple linear regressions with participants’ BLP score as the predictor variable and mean accuracy in each condition as the response variable. The results for the ungrammatical condition show a moderately strong negative correlation (r = –.59, p < .001) between BLP score and accuracy. The results of the regression indicated that BLP score accounted for 35% of the variance, R 2 = .35, F (1, 55) = 29.72, p < .001. In contrast, the correlation between BLP score and accuracy on the grammatical items was negative but not statistically significant (r = –.19, p >.05); the results of the regression also lack statistical significance, R 2 = .04, F (1, 55) = 2.04, p > .05.
Confidence
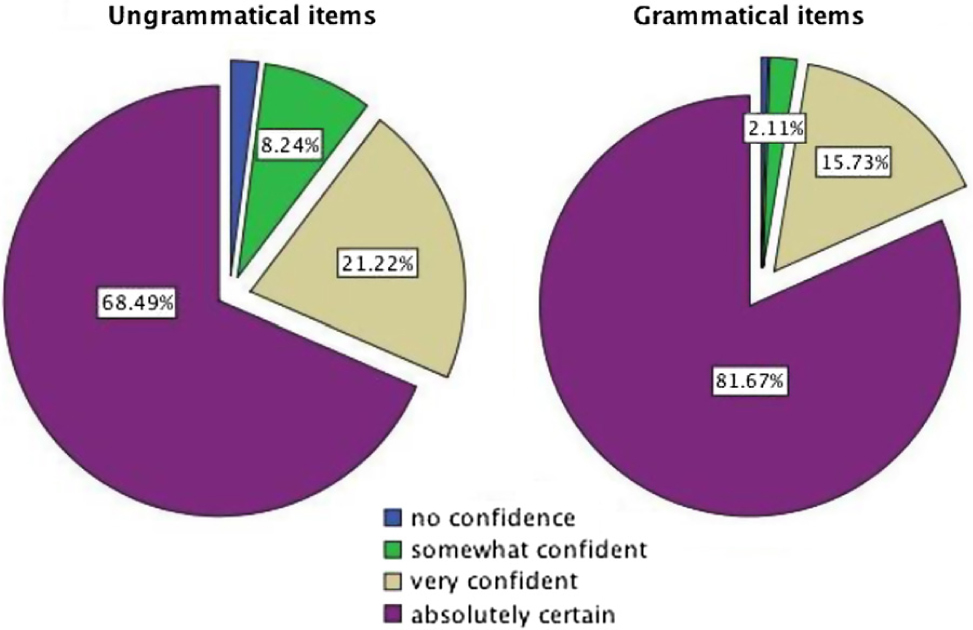
A total of 4,465 confidence ratings were collected and analyzed. The first step in the analysis was to examine the frequency with which each rating was assigned. The ratings in the “absolutely certain” category predominate (3,352 tokens or 75.1% of the data), followed by “very confident” (825 tokens or 18.5%). There are few responses at the lower end of the confidence scale: “somewhat confident” (231 tokens or 5.2%) and “no confidence” (57 tokens or 1.3%). Next, the confidence data were computed in relation to the type of item (grammatical vs. ungrammatical) on the AJT. Figure 2 shows the proportion of confidence ratings on the grammatical items and ungrammatical items. As seen in Figure 2, participants indicated they were “absolutely certain” more often on the grammatical items (81.7%) in comparison to the ungrammatical ones (68.5%).
Percentage of confidence ratings by item type.

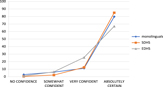
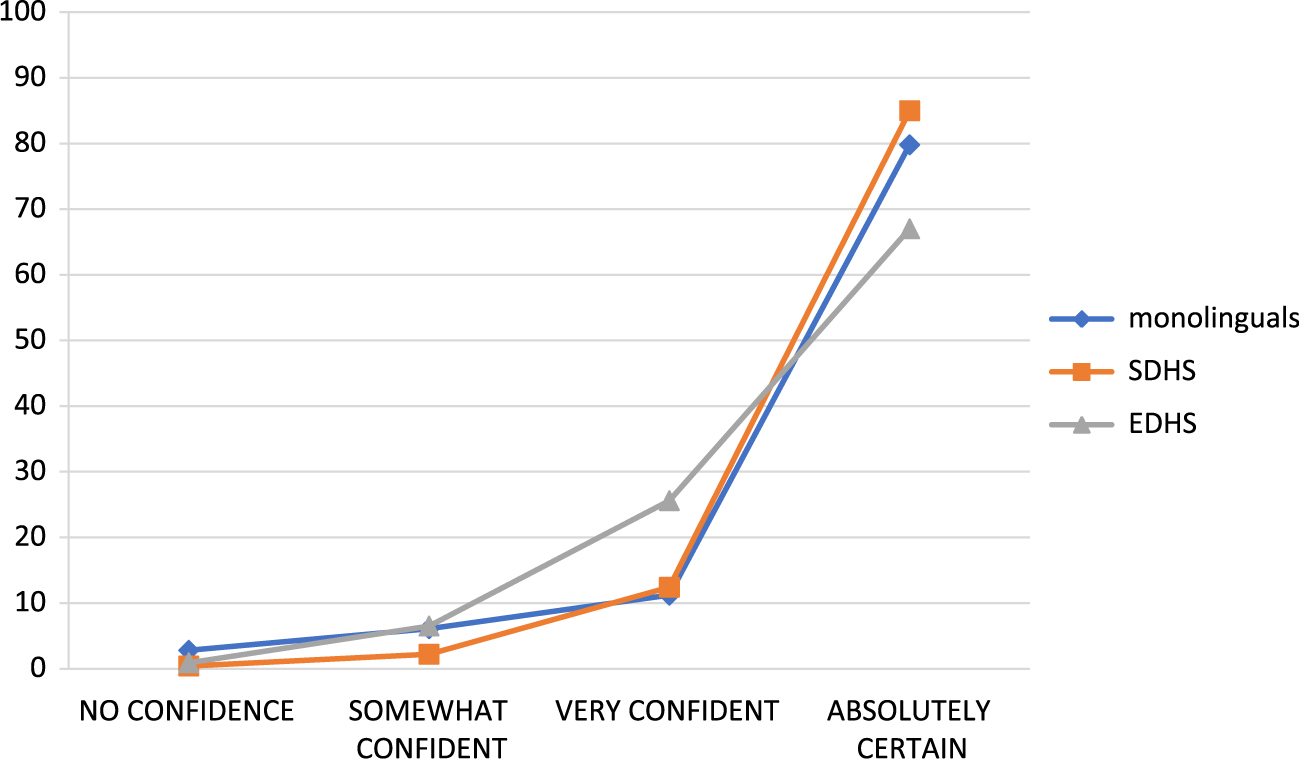
Next, we consider how group membership may have impacted the confidence ratings. Figure 3 shows the percentage of confidence ratings in each category by group. The SDHS group stands out in terms of having the lowest percentage of “no confidence” and “somewhat confident” ratings, and conversely, the highest percentage of “absolutely certain” ratings (85%). To further examine the relationship between group membership and confidence ratings, a chi-square test of independence was performed. The results show a statistically significant association between these two variables, χ2 = (6, n = 4,465) = 210.985, p < .001.
Proportion of confidence ratings per group (Task 1).
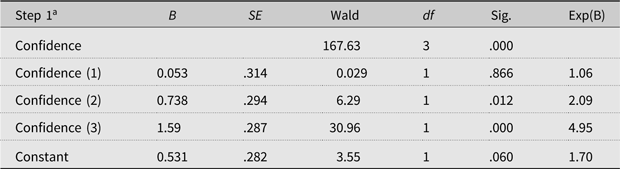
Finally, we examined the relationship between accuracy and confidence. Figure 4 shows that the proportion of accurate responses increases with greater levels of confidence. A binary logistic regression was performed to explore the effects of confidence rating on the likelihood that a judgment was correct. In other words, is confidence rating a predictor for accuracy? In this model, the “no confidence” response was selected as the baseline, meaning that the other levels of confidence will be compared to it. The logistic regression model was statistically significant, χ2 (3, N = 4,453) = 157.18, p < .001. However, the model explained only 6.2% of the variance (Negelkerke r2 ). As shown in Table 4, two levels of the predictor variable were statistically significant. When participants chose “very confident” as their rating, they were twice as likely to be accurate in their judgment: odds ratio Exp(B) = 2.09. Furthermore, when participants chose “absolutely certain” as their level of confidence, they were five times as likely to be accurate in their judgment (odds ratio = 4.95).
Relationship between accuracy and confidence on Task 1.
Binary logistic regression for Task 1

Note: Confidence (1) refers to somewhat confident; Confidence (2) refers to very confident; and Confidence (3) refers to absolutely certain. aVariable(s) entered on Step 1: Confidence.
Summary of Task 1 results
The data from Task 1 reveal that participants in the EDHS group showed less sensitivity in discriminating between grammatical and ungrammatical stimuli, as evidenced by their significantly lower d´ score. The performance of the SDHS group was nearly identical to that of the monolinguals (see Figure 1). Furthermore, item type (grammatical vs. ungrammatical items) had a significant effect on all groups: the ungrammatical condition yielded lower probability of an accurate judgment. With respect to the confidence ratings, the data were skewed toward high confidence, with over 93% of the ratings clustered in the “absolutely certain” and “very confident” categories. Finally, there was a significant relationship between confidence and accuracy; for example, when participants were “absolutely certain,” they were five times as likely to give an accurate judgment.
Task 2
Stimuli
The stimuli for this task include 36 sentences that were counterbalanced between conventional derivatives, creative derivatives, and filler items. We define creative derivative as a complex word formed with existing derivational suffixes, but one that does not appear in Spanish-speaking dictionaries nor is established in any (known) speech community. For example, the creative derivative profundez (noun meaning “depth”) is not attested in Spanish although it is well formed (i.e., there are other nouns in Spanish with the suffix –ez, such as estupidez “stupidity” and niñez “childhood”). We inserted these words into appropriate sentential contexts (see Appendix A for examples of the experimental items). The filler items consisted of sentences with lexical items belonging to the same word family (e.g., the adjective profundo “deep”). The filler items were not analyzed further; we report on the contrast between two main conditions: conventional and creative derivatives (Appendix B contains the complete list of conventional derivatives, their frequency from a rank-ordered listing, and the creative derivatives).
As in Task 1, these stimuli were embedded into a bimodal AJT with a binary response option (yes/no). The instructions were the same as in Task 1. Participants were instructed to make their decision as quickly and accurately as possible, and afterward, they indicated their degree of confidence using the same four-way confidence scale.
Data analysis
The data from Task 2 were analyzed in a parallel fashion to data from Task 1. Missing data were excluded from further analysis; these include 12 nonresponses out of 1,800 acceptability judgments and 28 nonresponses out of an equal number of confidence ratings.
Results
Accuracy
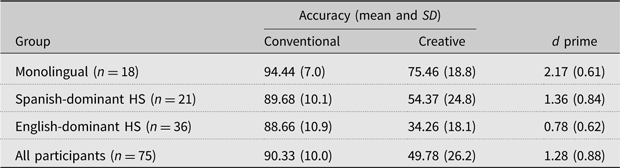
Table 5 reports the descriptive statistics in the two conditions of interest (conventional and creative derivative) and the d′ values. A one-way analysis of variance on the d′ scores yields statistical significance F (2, 74) = 24.88, p < .001. Post hoc tests (Bonferroni) reveal significant differences between all three groups: SDHS compared with monolinguals (p = .001); SDHS compared with EDHS (p = .009), and monolinguals compared with EDHS (p < .001).
Descriptive statistics for Task 2

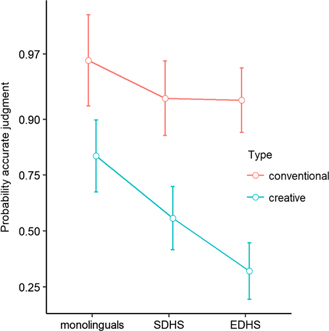
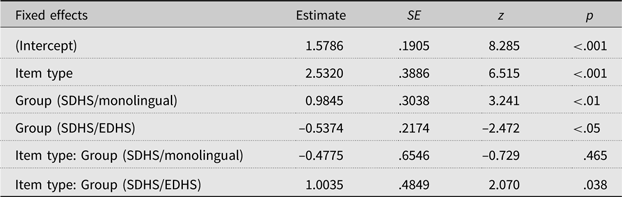
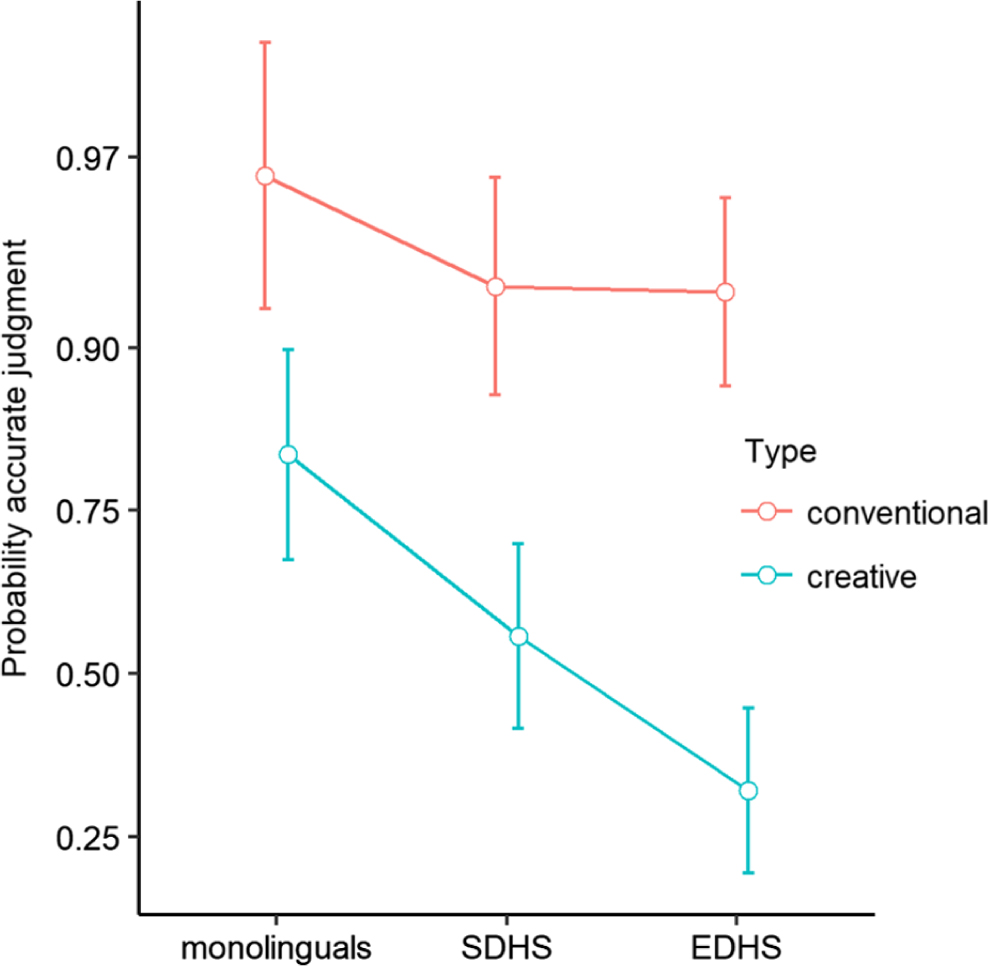
The results of the mixed-effects model reveal that the effect of item type was significant: conventional items were much more likely to be judged accurately. There was also a fixed effect for group, with monolinguals being more likely than SDHS participants to give an accurate judgment. The results show a significant effect for group when comparing EDHS and SDHS, qualified by an interaction of group and item type (see the bottom row of Table 6). Figure 5 shows the probability of an accurate judgment for the two types of items (conventional and creative) for the monolingual, EDHS, and SDHS groups.
The predictions of the mixed-effects logistic regression model for Task 2. Whiskers indicate 95% confidence intervals. The results were back-transformed to the probability scale.
Summary of the fixed effects in the mixed-logit model (Task 2)

Note: Coefficients are given in log-odds. Significant positive coefficients indicate increased log-odds (and thus increased probability) of an accurate judgment.
Language dominance
To determine if dominance is a predictor for performance in each condition, we ran two simple linear regressions between participants’ BLP score and mean accuracy on the conventional and creative derivatives. The correlation between BLP score and accuracy on the conventional condition was near zero and not statistically significant (r = –.13, p > .05). The lack of relationship between these two variables is confirmed by the regression analysis: R 2 = .017, F (1, 55) = 0.95, p > .05. In contrast, the correlation between BLP score and accuracy on the creative derivatives indicates a moderately strong negative relationship (r = –.53, p < .001). The results of the regression indicated that dominance (as measured by the BLP) explained 28% of the variance, R 2 = .281, F (1, 55) = 21.47, p < .001.
Confidence
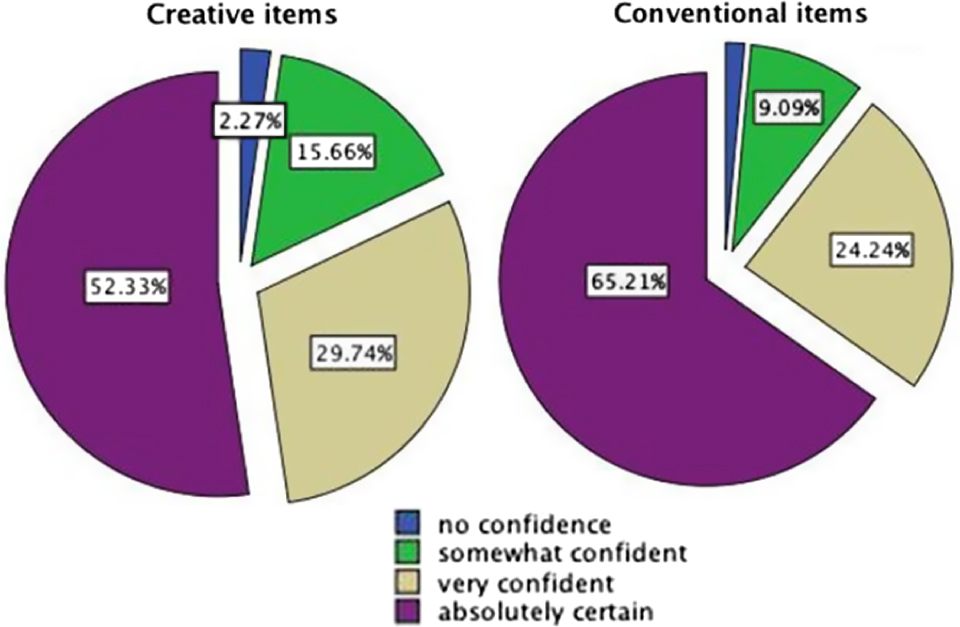
We examined the overall distribution of the four types of for the 1,772 confidence ratings that were collected and analyzed. As in Task 1, there were very few responses in the “no confidence” category (33 tokens or 1.9% of all ratings). The category “somewhat confident” yielded 219 tokens (12.4%). The largest proportion of responses fell into two categories: “very confident” (478 tokens or 27%) and “absolutely certain” (1,042 tokens or 58.8%). Next, we wanted to know whether the type of item (conventional vs. creative derivative) has an impact on the confidence ratings. This distribution is shown in Figure 6.
Percentage of confidence ratings by item type.

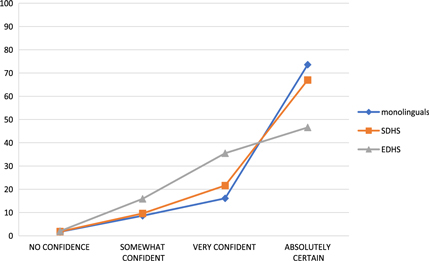
As seen in Figure 6, participants were “absolutely certain” more often on the sentences containing conventional derivatives. Figure 7 below shows the proportion of ratings in each category for the three participant groups.
Proportion of confidence ratings per group (Task 2).

Clearly, the SDHS and monolingual groups are very similar in their pattern of ratings. Nevertheless, monolinguals are “absolutely certain” more often (73.6%) than the SDHS participants (67%). It is the EDHS group that diverges from the trend in their confidence ratings, not reaching 50% in the category of “absolutely certain.” A chi-square test confirms a significant association between group and confidence: χ2 = (6, N = 1,772) = 105.99, p < .001.
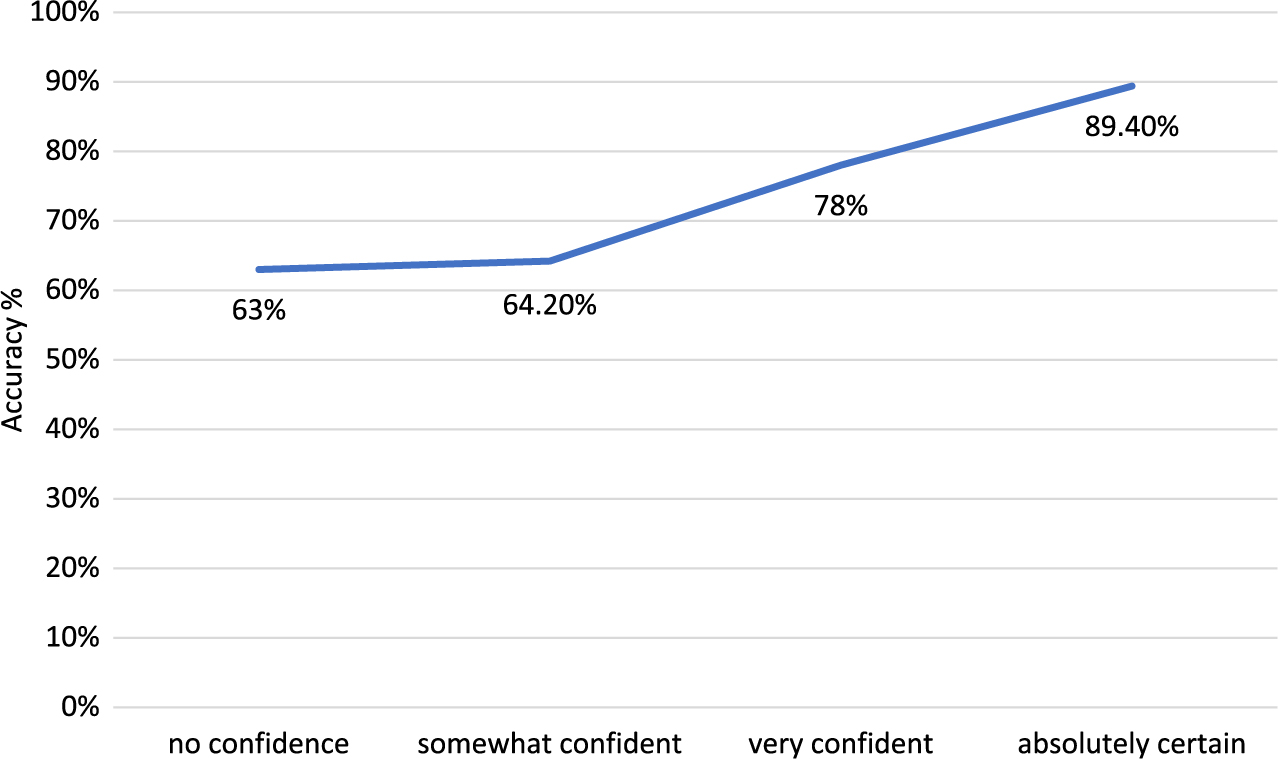
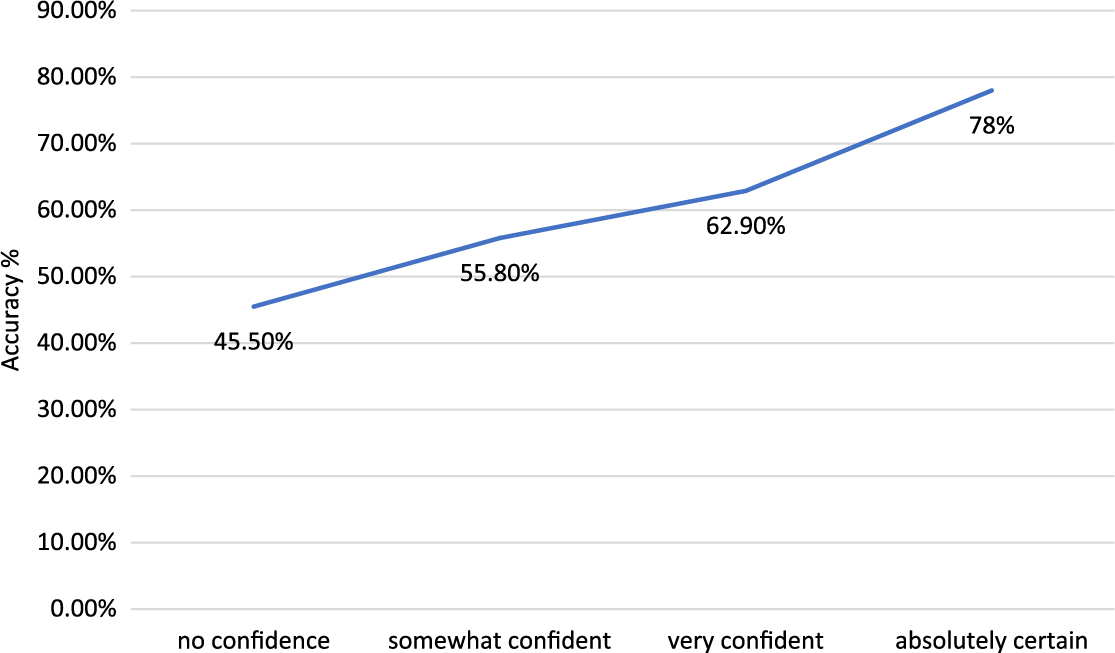
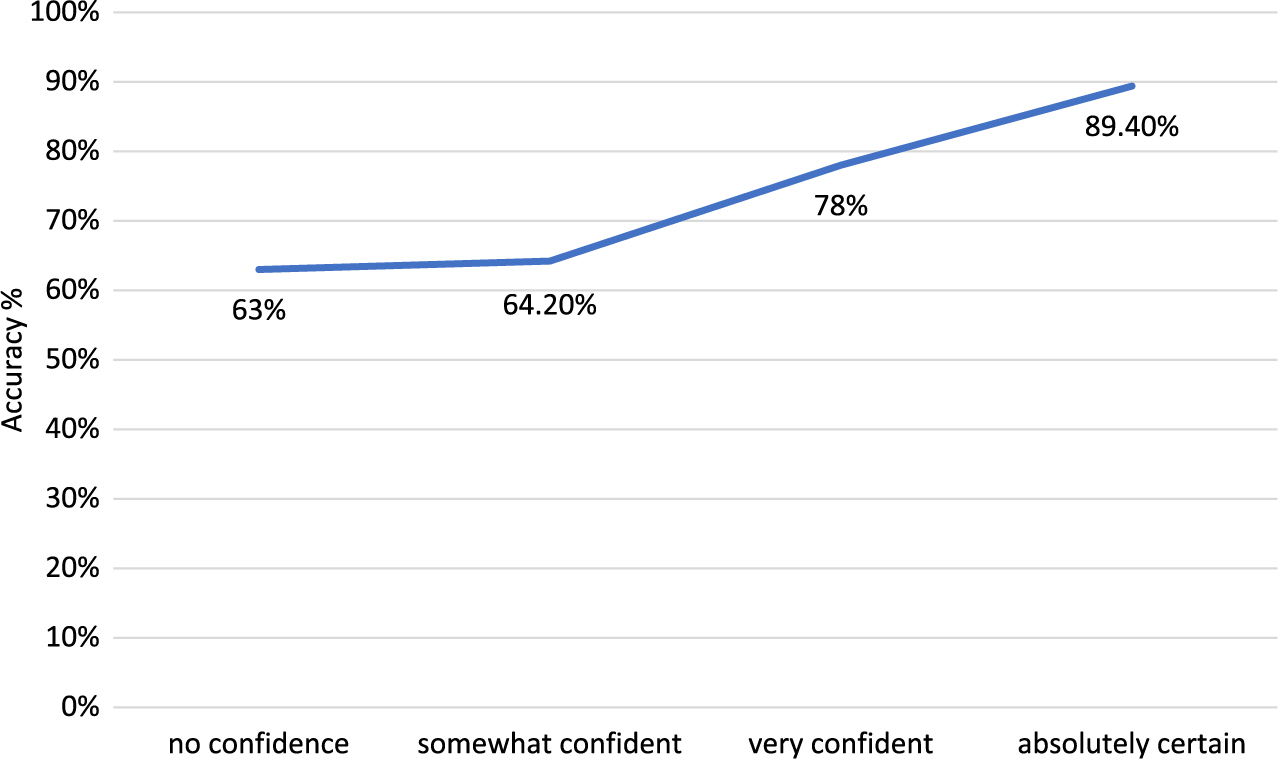
The final step in the analysis was to determine if there is a significant relationship between accuracy on the judgment task and confidence rating. Figure 8 presents the percentage of accurate responses in each confidence category and reveals a steady increase in accuracy with each confidence level; note that accuracy was below chance when participants expressed “no confidence” in their judgments.
Relationship between accuracy and confidence on Task 2.

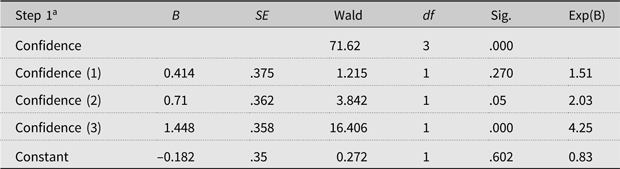
A binary logistic regression was performed to explore the effects of confidence rating on the likelihood that a judgment was correct. In this model, the “no confidence” response was selected as the baseline. The logistic regression model was statistically significant, χ2 (3, N = 1,768) = 72.53, p < .001, but explained only 5.7% of the variance (Negelkerke r2 ). As shown in Table 7, only one level of the confidence variable was statistically significant when compared to the baseline. When participants chose “absolutely certain” as their rating, they were 4.25 times as likely to be accurate in their judgment (odds ratio = 4.25).
Binary logistic regression for Task 2

Note: Confidence (1) refers to somewhat confident; Confidence (2) refers to very confident; and Confidence (3) refers to absolutely certain. aVariable(s) entered on Step 1: Confidence.
Summary of Task 2 results
The data indicate that all participants were affected by item type, with a greater probability of an accurate judgment on conventional items. Whereas the probability of an accurate judgment on the conventional items was the same for SDHS and EDHS groups, these groups are significantly different from one another when judging the creative items (this is the interaction effect reported in Table 6). The confidence data from Task 2 reveal that participants displayed high overall levels of confidence: nearly 86% of the ratings fell into the “very confident” and “absolutely certain” categories. The confidence of all groups was impacted by the type of item that they were asked to judge, with relatively lower confidence on the items containing creative derivatives. Finally, as in Task 1, there was a significant relationship between confidence and accuracy.
Discussion
In addition to revisiting the research questions outlined earlier, this section aims to draw comparisons between the two experimental tasks. We conclude with some reflections on how these data relate to larger debates in the field.
The first research question centered on the issue of task stimulus, that is, the possibility of differential performance on grammatical versus ungrammatical items. The data from Task 1 are quite clear in this respect: participants were less accurate on the ungrammatical items as evidenced by the fixed effect for item type. Thus, the results from Task 1 suggest that detecting ungrammaticality is generally more difficult for speakers, independent of the effects of bilingualism. This result has precedent in the literature, dating back to early work by Ryan and Ledger (Reference Ryan and Ledger1979) in research with school-aged children. More recently, Godfroid et al. (Reference Godfroid, Loewen, Jung, Park, Gass and Ellis2015) found a large difference in accuracy between grammatical (90%) and ungrammatical items (76%) on a timed AJT with native English speakers. Rinke and Flores (Reference Rinke and Flores2014), in their study on clitics in European Portuguese, found that both monolingual native speakers and HSs “are better at judging grammatical constructions than ungrammatical ones” (p. 694). In sum, the evidence from this study coincides with that of a number of previous studies in which ungrammatical items on AJTs yield lower accuracy rates for both monolingual and bilingual speakers.
Although all participants were affected by task stimulus, it was the EDHS group that differed significantly from the other groups; they displayed reduced sensitivity (lower d´) in discriminating between grammatical and ungrammatical stimuli. Polinsky (Reference Polinsky and Pascual y Cabo2016) has argued that judging ungrammaticality requires greater metalinguistic awareness, and it could be that a lower degree of metalinguistic awareness is what sets the EDHS group apart. This explanation, however, is not entirely satisfactory because it does not clarify why some HSs have greater metalinguistic awareness than others. The nature of metalinguistic awareness among HSs is poorly understood, due in part to an orientation stemming from SLA, which prioritizes metalinguistic knowledge (in the sense of declarative, explicit knowledge). Llombart-Huesca (Reference Llombart-Huesca2017) argues that we need to understand metalinguistic awareness among HSs from the perspective of L1 development. Specifically, metalinguistic awareness among children refers to the “linguistic insights and intuitions that are […] developed through literacy practices, such as reading, writing, and vocabulary activities that take place in early school years” (Llombart-Huesca, Reference Llombart-Huesca2017, p. 15). Along similar lines, Dąbrowska and Street (Reference Dąbrowska and Street2006) suggest that metalinguistic awareness develops out of experience with decontextualized language (e.g., written texts and classroom activities), and language users who have such experience are more likely “to pay more attention to formal cues” (p. 610). This is consistent with the role of formal education in accounting for differences among HSs, as articulated by Kupisch and Rothman (Reference Kupisch and Rothman2018), who argue for the benefits of the HL as a medium of instruction (rather than as the target). In sum, there are compelling arguments that point to formal education and literacy practices as having a significant impact on developing metalinguistic awareness among HSs. The challenge going forward will be to develop or adapt tests of metalinguistic awareness for adult HSs that do not emphasize explicit metalinguistic knowledge.
The second research question set up a comparison between conventional and creative derivatives (Task 2). Here we found a fixed effect for item type, with conventional items being judged more accurately than creative ones. Let us consider some of the creative words and their conventional equivalents: formaleza (instead of formalidad “formality” or “seriousness”) and amarguez (instead of amargura “bitterness”). Even though the creative derivatives are not established words, they bear similarity to many words that the participants know; for example, formaleza shares the morphological structure of high-frequency words such as naturaleza, “nature,” and belleza, “beauty.” In analogical models of the lexicon, all words ending in –eza form a network of morphologically related words (see Eddington, Reference Eddington2004, Reference Eddington2017). On this view, a creative word like formaleza is accepted based on analogy to words that share a similar structure. This sort of analogical pressure affects all the participants to some degree; note that the monolingual native speaker group also accepted some of the creative derivatives (on average 3 out of 12).
From the perspective of overacceptance, the two HS groups were more accepting of the creative words than the monolingual group. The overacceptance of lexical items by HSs was documented previously by Fairclough (Reference Fairclough2011), but using a different methodology. In that study, Fairclough developed a yes/no lexical recognition task for the purpose of language placement. Fairclough’s results indicate significant differences between L2 learners and HSs, with the latter group recognizing many more words. The HSs also had a higher rate of false alarms, that is, more “yes” responses to more pseudowords. Fairclough (Reference Fairclough2011) explains that, “when they [HSs] encountered a word that resembled a Spanish word, they wrongly selected it” (p. 289), which may stem from the fact that, unlike L2 learners, they have “a much better ‘feel’ for what could be a Spanish word (i.e., based on morpho-phonological restrictions).” The yes/no lexical recognition task differs from our AJT in Task 2 with respect to the presence of context, but it may reveal the same underlying tendency among HSs to (over)accept lexical items based on similarity to other words they know.
Although the trials were randomized during the experiment, it is possible that the order of stimulus presentation had some impact on the participants’ judgments. Specifically, seeing the conventional item first (e.g., formalidad) might lead a participant to reject the creative item (e.g., formaleza) when it appears later in the task.Footnote 6 This is the scenario of preemption, in which an innovation is blocked by an existing form (cf. Ambridge, Pine, Rowland, Chang, & Bidgood, Reference Ambridge, Pine, Rowland, Chang and Bidgood2013). To test for this possibility, we reviewed the original data files, which showed the actual order in which trials had been presented. Let us consider all the cases in which the creative item was accepted, controlling for which trial came first. The analysis revealed that, when the conventional item was presented first, there were 183 cases of acceptance of the creative form. Conversely, when the creative item was presented first, there were 256 cases of acceptance. A chi-square test of independence reveals a statistically significant association between stimulus order and response, χ2 = (3, n = 1,778) = 14.02, p = .003. Thus, it seems that participants were more likely to reject a creative form after having seen the conventional one. Nevertheless, there is another salient pattern in the data that deserves mention here: the cases in which participants accepted both the conventional and the creative form of a given pair (e.g., formalidad—formaleza). This pattern of yes-yes responses was evident in 44% of the trials in Task 2, indicating that for many participants in this study, the two forms are not mutually exclusive.
The third research question was largely exploratory as this is the first study to examine HSs’ confidence ratings. We wanted to know if HSs differ from monolinguals in their confidence ratings, noting the suggestion in the literature that HSs suffer from lack of confidence when making linguistic judgments. If we consider the data from Task 1 on their own, there is no evidence that HSs are less confident than monolingual speakers. It was the SDHS group that displayed the highest relative levels of confidence (we return to this point below). The confidence data from Task 2 reveal a slightly different picture: the EDHS group had the lowest proportion of “absolutely certain” responses (less than 50%), while the other two groups maintained relatively high confidence in their judgments. The differences between the SDHS and the monolingual groups are very subtle in the sense that they only appear in the relative frequency of choosing between “very confident” and “absolutely certain.” Arguably, both of these categories are indicative of high levels of confidence. Taken together, the data from both tasks suggest that any differences between groups are a matter of degree and do not indicate low levels of confidence among the HSs. Another possibility is that the four-way confidence scale, which has been widely used in AGL research, is not sensitive enough to capture differences between very high levels of confidence.Footnote 7
It is important to note that all participants generally avoided the “no confidence” category in both tasks. Methodologically, this makes it very difficult for us to say anything about the guessing criterion, which involves determining if performance is above chance when participants claim to be guessing (i.e., no confidence). However, we did find a significant relationship between accuracy and confidence, which indicates the existence of conscious judgment knowledge (Dienes, Reference Dienes2008) and is predicted to be present among native speakers.
Why is it then that previous studies have suggested that HSs lack confidence in their judgments? In our reading of the research, it seems that lack of consistency in HSs’ judgments is sometimes erroneously interpreted as lack of certainty. Consider the following (hypothetical) situation: there are eight experimental items designed to test a particular construction and a participant responds by accepting five of the items and rejecting the other three. This scenario makes it difficult to determine the status of that particular construction in the knowledge representations (i.e., competence) of the participant. Inconsistent or contradictory responses may stem from any number of factors; this issue has been discussed from the perspective of gradience and optionality (cf. Sorace, Reference Sorace2000; Sorace & Keller, Reference Sorace and Keller2005) as well as lexically specific representations (cf. Street & Dąbrowska, Reference Street and Dąbrowska2014). Crucially, inconsistent performance should not be equated with a lack of confidence or certainty in one’s judgments, which can be objectively measured with a confidence scale.
Another factor to consider when interpreting the confidence data is that the HSs in our sample had significant exposure to formal schooling in Spanish (M = 4.94 years). As noted by an anonymous reviewer, it is possible that HSs without any formal schooling would not have indicated such high degrees of confidence. This suggestion raises interesting questions about the source of confidence in one’s linguistic judgments. Does confidence stem from exposure in contexts where language tends to be examined and corrected (i.e., academic settings), or is it merely a function of the amount of exposure (regardless of context)? This is an empirical question that would require sampling a population of native speakers who have comparable amounts of exposure, but differences in formal schooling. Dąbrowska and Street (Reference Dąbrowska and Street2006) took this approach in examining differences among native speakers of English in the comprehension of passive sentences, but they did not elicit confidence judgments.
Finally, we offer some possible explanations for the finding that Spanish-dominant HSs were most confident in Task 1. In the US context, this group of speakers has strong Spanish language skills vis-à-vis other bilinguals, which may lead them to overestimate their Spanish abilities (Polinsky, personal communication). This is precisely what Gollan et al. (Reference Gollan, Weissberger, Runnqvist, Montoya and Cera2012) found when comparing self-ratings to oral proficiency interviews and picture naming tasks: the bilinguals who reported being Spanish dominant “seemed to be the most balanced bilinguals by objective measures” (p. 604). The same phenomenon may also be a factor in the confidence ratings in the present study, leading the SDHS group to feel more confident in their judgments than the monolingual native speakers.
Related to the data already discussed, we offer a few comments on how these results might be viewed in the larger context of HS bilingualism. One finding that stands out from this study is that the SDHS group is identical to the monolingual group on Task 1 but not on Task 2. This leads to broader questions about what it means to be a HS who is Spanish dominant. Although dominance in English is the most likely scenario of bilingualism in the US context, we cannot ignore the fact that some individuals—including the ones in our SDHS group—have histories and patterns of language use that prioritize the home language and culture. Based on the information in the language history module on the BLP, their mean age of exposure to English was 7.5 years. Thus, these are young adults who had some exposure to Spanish in early elementary school and continue to use Spanish on a regular basis in their daily lives. Nevertheless, Spanish-dominant HSs likely differ from their monolingual counterparts in Mexico in terms of relative exposure to the language, especially in academic contexts and with respect to written registers. We interpret the between-group differences on Task 2 as one manifestation of this differential exposure.
Returning to critiques raised by Polinsky (Reference Polinsky and Pascual y Cabo2016) and Orfitelli and Polinsky (Reference Orfitelli, Polinsky, Kopotev, Lyashevskaya and Mustajoki2017) regarding the AJT as a methodological option in HL research, our data show that English-dominant HSs were more likely to accept ungrammatical sentences than monolingual speakers and Spanish-dominant HSs. Thus, we concur with Orfitelli and Polinsky that the exclusive use of AJTs (to the detriment of other tasks) leads to a distorted picture of what HSs know. This is because HSs who are at the early stages of literacy and metalinguistic awareness are likely operating with the default strategy of attending to meaning (Llombart-Huesca, Reference Llombart-Huesca2017). This may be why they perform better on comprehension-based tasks, such as sentence–picture matching and truth-value judgment tasks, in comparison to AJTs, which always draw attention to form (Vafaee et al., Reference Vafaee, Suzuki and Kachisnke2017). In addition to the interpretation-based methods favored by Orfitelli and Polinsky, there are other options that could serve HSs well. Among these are the word-monitoring task (cf. Suzuki, Reference Suzuki2017; Suzuki & DeKeyser, Reference Suzuki and DeKeyser2015), which seems to be particularly well suited to learners with sufficient naturalistic exposure, and the word repetition task utilized by Montrul, Davidson, de la Fuente, and Foote (Reference Montrul, Davidson, de la Fuente and Foote2014) to assess gender processing among HSs.
Finally, the results of the current study contribute to the larger discussion regarding vulnerable domains in HS bilingualism. This is an important question that has been explored via comparisons of morphosyntax and pronunciation (Flores, Rinke, & Rato, Reference Flores, Rinke and Rato2017; Kupisch et al., Reference Kupisch, Lein, Barton, Schröder, Stangen and Stoehr2014). Kupisch et al. found that, among the morphosyntactic properties tested, HSs of French were monolingual-like in every aspect except for adjective placement, and in particular when placement depended on lexical and semantic factors (e.g., adjective–noun combinations in idiomatic expressions). Our results also suggest that the lexical domain, which was put to the test in Task 2, is affected to a greater degree than morphosyntax. Of course, this interpretation makes a theoretical assumption about complex words being stored in the lexicon, which is in line with a number of proposals in which words form networks based on overlapping semantic and phonological material (cf. Bybee, Reference Bybee2010; Eddington, Reference Eddington2004; Seidenberg & Gonnerman Reference Seidenberg and Gonnerman2000). Arguably, many questions remain about HSs’ lexical knowledge, either in comparison with other domains or on its own terms (cf. Montrul & Foote, Reference Montrul and Foote2014).
Conclusion
The research reported here investigated some of the methodological questions surrounding the use of judgment tasks with HSs. The results highlight the impact of task stimulus (grammatical vs. ungrammatical items), language dominance (Spanish-dominant vs. English-dominant HSs), and language domain (morphosyntax vs. lexicon). In our design, we included a separate confidence scale in order to empirically test the suggestion that HSs lack confidence in their linguistic judgments. The results reveal high levels of confidence on both tasks, as well as a significant relationship between accuracy and confidence. Such high confidence ratings suggest that HSs are not afflicted by low levels of confidence when performing AJTs, and furthermore, that differences between groups of native speakers (monolinguals vs. HSs) are not categorical but rather a matter of degree. Future research is needed to corroborate these findings, as confidence may be diminished when task demands are increased (i.e., a more demanding task could result in lower levels of confidence). In any case, the current study underscores the need to disentangle confidence—understood as a metacognitive judgment—from other aspects that underlie performance during linguistic tasks.
Acknowledgments
We wish to express our appreciation for several colleagues who helped with various phases of this project, including Mark Amengual, Melissa Bowles, and Carolina Castillo-Trelles. We would also like to thank Jakub Szewczyk for his valuable assistance with the statistical analyses. The suggestions and feedback of two anonymous reviewers are gratefully acknowledged. All remaining errors are our own.
Appendix A Examples of experimental items from both tasks

Appendix B Conventional and creative derivatives in Task 2

Note: Corpus frequency refers to the rank-ordered listing of the top 20,000 lemmas from the Corpus del Español (Davies, Reference Davies2002).