I. INTRODUCTION
Lightweight is an attractive way to improve its thrust-weight ratio of engine in aircraft. Reference Boyer1 High temperature titanium alloys have been applied in fabricating the compressor discs and blades at a temperature of 600 °C because of their high specific strength, excellent mechanical properties up to high temperature and good corrosion resistance, Reference Banerjee and Williams2 such as IMI685, Reference Guo and Baker3 IMI834, Reference Singh and Singh4 and Ti-1100 Reference Lee, Nam and Choe5 alloy. To increase the flight speed, the elevation of service temperature should be promoted as well as the remained mechanical properties at a higher temperature.
In general, the Ti–Al–Sn–Zr–Mo–Si series titanium alloy has been accepted to be applied at a temperature of 600 °C, which belongs to near α titanium. Compared with the common Ti–Al–Sn–Zr–Mo–Si series titanium, Ti-60 was prepared with the addition of Nd to meet the requirements of thermal stability and oxidation resistance. Reference Jia, Zeng, Liu, Zhou and Wang6 Ti-600 exhibited excellent creep resistance by the inclusion of 0.1% Y element and increase in the content of silicon. Reference Hong, Qi, Zhao and Yang7 Moreover, BT36 was added high-melting-point W element and rare-earth Y to perform improved creep resistance. Reference Hao, Cai and Du8 However, to develop a titanium used in the higher temperature encountered two main difficulties: (i) the improved elevated-temperature strength by increase alloying degree was at the expense of thermal stability; (ii) the creep resistance and fatigue property would deteriorate because of the oxidation of alloy’s surface. Reference Wang, Liu and Yang9 Therefore, it is the crucial difficulty in developing elevated-temperature titanium alloys to balance the effective strengthening and toughness.
Micro-alloying and improving the microstructure are effective ways to solve such difficulties. Rare earth elements, such as Nd and La, have been added into the Ti–Al–Sn–Zr–Mo–Si series titanium alloy to improve the creep resistance and fatigue property, which strengthened the alloy and did not deteriorate the thermal stability. Reference Zhang, Li and Yang10,Reference Xiao, Lu and Yang11 Sastry and his coworkers investigated the microstructure and properties of Ti-RE (Ce, Dy, Er, Gd, La, Nd, or Y) alloys prepared by rapidly solidification processing, suggesting that Ti–Er is the most promising alloy for applying in a dispersion-strengthened alloy because the finer dispersion and stability of the Er2O3 phase. Reference Sastry, Meschter and O’Neal12 Moreover, the dispersoids significantly effected grain refinement and retard grain growth at elevated temperatures. Reference Sankaran, Sastry and Pao13 Ti–Al–Sn–Zr–Mo–Si series titanium alloy was modified by rear-earth Er to generate refined grain size and alterative silicide, which improved the strength and toughness at elevated-temperatures. Reference Han, Li, Yin, Liu and Nie14 Therefore, adding Er is a promising method to balance the strength and toughness at higher temperatures. In addition, the addition of Nb can improve the oxidation resistance by impeding mass transfer in TiO2, Reference Jiang, Hirohasi, Lu and Imanari15 and increase the fracture toughness because of the improved propensity for crack-tip tortuosity. Reference Fu, Wang, Zou and Wei16 Yang and his co-works have reported that the oxidation resistance at elevated-temperatures could be improved with the addition of Ta. Reference Zhu, Wang, Liu, Liu and Yang17 Therefore, Ti–Al–Sn–Zr–Mo–Nb–Ta–Si–Er titanium was developed in this paper considering the improvement of the balance between the oxidation resistance and effective strengthening and toughness. On the basis of the phase diagrams and the maximum solubility of alloying element in matrix, the alloy was designed as Ti–5.8Al–3Sn–5Zr–0.5Mo–1.0Nb–1.0Ta–0.4Si–0.2Er, controlled by aluminum equivalent and electron concentration theory.
Microstructure is considered as the most direct influential factor of the mechanical property of a titanium alloy. Reference Jia, Zeng and Yu18–Reference Cvijović-Alagić, Gubeljak, Rakin, Cvijović and Gerić20 Meanwhile, submitting an appropriate hot deformation process is the most effective way to regulate and improve the microstructure of a high-temperature titanium alloy. Reference Zhou, Zeng and Yu21,Reference Chandravanshi, Sarkar, Kamat and Nandy22 Fine β grains with the transformed microstructures inside provided excellent resistance to fracture and creep at elevated-temperatures but low ductility; equiaxed α phases in the fine β grains can improve the ductile of a near-α titanium alloy. Reference Satyanarayana, Omprakash, Sridhar and Kumar23 Finer β grain is the microstructural foundation for improving the comprehensive mechanical property, which can be prepared by dynamic recrystallization. Reference Vo, Jahazi and Yue24 Meanwhile, the morphology of α phase can be regulated by hot deformation and heat treatment according to the expected mechanical property. The investigation of hot deformation behavior is the first and crucial method to improve the microstructure and mechanical property.
Generally, the hot deformation behavior of metallic material can be characterized by the flow stress, which is a function of the strain, strain rate, and deformation temperature. Reference Lin, Ding, Chen and Deng25,Reference Peng, Zeng, Wang and Yu26 The constitutive equation compensated by strain can reflect the deformation behavior, which is established from the experimental data. Reference Wu, Wen, Huang, Wu, Gao, Wang and Nie27,Reference Zhao, Li, Zhu and Nie28 Therefore, the deformation behavior of the Ti–Al–Sn–Zr–Mo–Nb–Ta–Si–Er titanium alloy should be analyzed via establishing constitutive equation and clarifying the microstructural evolution, aimed to provide theoretical support for the hot deformation process.
The hot deformation behavior of the Ti–Al–Sn–Zr–Mo–Nb–Ta–Si–Er titanium alloy was analyzed via the establishment of the constitutive equation compensated by strain from the isothermal compressed data. Meanwhile, the microstructures were characterized to clarify the softening mechanism and participates evolution. The research provided a basis for the determination of forging process after cogging to refine the β grain and improve morphology of α phase.
II. EXPERIMENTAL PROCEDURE
The Ti–5.8Al–3Sn–5Zr–0.5Mo–1.0Nb–1.0Ta–0.4Si–0.2Er titanium alloy ingot with a diameter of 200 mm was prepared by triple vacuum arc melting to ensure the homogeneity of the chemical composite. The β/(α + β) transus-temperature of the alloy was 1010 °C by differential thermal analysis and metallographic method. The ingot was cogged at a temperature of 1150 °C to form a bulk with a section length of 50 mm.
Isothermal compression tests were performed on a Gleeble-3500 simulator (Dynamic Systems Inc., Austin, Texas) to investigate the dynamic deformation behavior. The cylindrical specimens with 10.0 mm in diameter and 15.0 mm in height were machined from the as-cogged bulk. According to the conventional forging process and the β/(α + β) transus-temperature, the temperature ranging from 880 °C to 1080 °C was selected. To inhibit the growth of β grain, a minor interval should be applied in the β region. The isothermal compressed temperature was raged from 880 °C to 1000 °C at 40 °C intervals in α + β two-phase region and raged from 1020 °C to 1080 °C at 30 °C intervals in β single-phase region, which can be precisely detected by a H-type thermocouple. The strain rates were 0.001, 0.01, 0.1, 1, and 10 s−1. The cylindrical specimens were heated to the corresponding testing temperature with a constant heating rate of 10 °C/s, and kept for 300 s before the isothermal compression so as to acquire a uniform deformation temperature in the entire specimen. The experiment was conducted in a low vacuum condition. Specimens after isothermal compressed were quenched in water to retain the deformation microstructure. Moreover, the true strain–stress curves were automatically recorded during the isothermal compression test.
For microstructural examination, the deformed samples were sectioned parallel to the compression axis along the direction of the center line. The microstructures of as-cogged and as-compressed samples were analyzed by using Olympus BX51M optical microscope (OM; Olympus Corp., Tokyo, Japan), Zeiss SUPRA 55 scanning electron microscope (SEM; Carl Zeiss, Oberkochen, Germany). OM samples were ground, polished, and etched with Keller’s solution. SEM samples were only ground and polished.
The orientation distribution was analyzed by electron backscatter diffraction (EBSD). EBSD samples were ground and electro-polished, and the electro-polishing was accomplished using a solution of 60% perchloric acid (6 mL), and glacial acetic acid (94 mL). These samples were examined in a Quanta FEG 650 SEM (FEI Company, Hillsboro, Oregon), and the backscatter signal data were obtained by a Nordlys collection probe. HKL Channel 5 software was utilized to process the data to obtain the IPF orientation mapping and recrystallization content.
Longitudinal sections of samples were analyzed by a JEM-2010F transmission electron microscope (TEM; JEOL Ltd., Tokyo, Japan). Samples were mechanically polished to thin sheets. Disks with a diameter of 3 mm were twin-jet electro-polished in a 60% HClO4 50 mL–CH3(CH2)3OH 350 mL–CH3OH 600 mL solution at 248 K and 20 V followed by ion milling. The detailed microstructures were observed at 200 kV with standard TEM techniques.
III. RESULTS
A. Initial microstructure
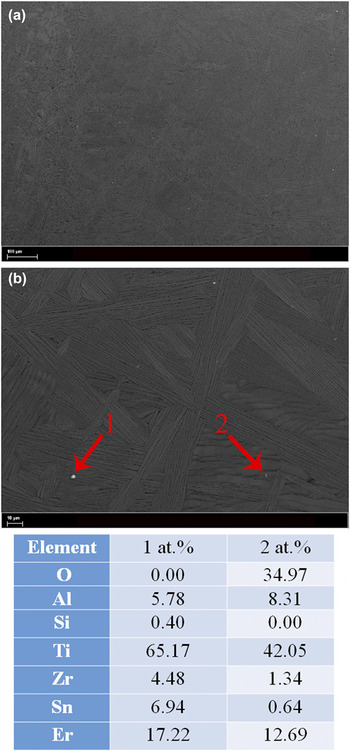
Figure 1 shows the microstructure of the as-cogged Ti–5.8Al–3Sn–5Zr–0.5Mo–1.0Nb–1.0Ta–0.4Si–0.2Er titanium alloy. The microstructure was a typical lamellar structure of β transformation. The prior β grain was determined to be approximately 1.50 mm in size, in which lamellar α colonies existed. To improve the mechanical properties of as-cogged alloy, the β grain and lamellar α colonies should be refined and regulated by hot deformation.
The microstructures of the as-cogged Ti–Al–Sn–Zr–Mo–Nb–Ta–Si–Er titanium alloy (a) morphology of as-cogged alloy, (b) enlarged image of α and precipitated morphology and its related chemical composition.

Numerous bright phases with a diameter of 3 μm were also distributed in the initial microstructure. The bright phases were identified by energy dispersive X-ray spectrometry (EDX), and the EDX results were shown in Fig. 1. EDX analysis revealed that the bright phases were Er-rich phases, which also contained oxygen element. It indicated that erbium played a role of internal oxidation, which was beneficial to improve the mechanical properties for reducing the oxygen content of the alloy. However, such large sized Er-rich phases maybe bad for the hot working ability if still existed during the isothermal compression.
B. Stress–strain curve
Flow stress–strain curves in the isothermal compression of Ti–5.8Al–3Sn–5Zr–0.5Mo–1.0Nb–1.0Ta–0.4Si–0.2Er titanium alloy at various strain rates and temperatures were presented in Fig. 2. Similar to flow stress versus strain curves of the common metals in isothermal compressed conditions, Reference Zhao, Li, Fu, Guo and Yao29 the flow stress–strain curves can reach a steady state, which was related to the balance between work hardening and dynamic softening. Additionally, the flow stress was sensitive to the temperature and strain rate, which significantly increased with the decreasing temperature and increasing strain rates.
Flow stress–strain curves in the isothermal compression of Ti–Al–Sn–Zr–Mo–Nb–Ta–Si–Er titanium alloy: (a) 880 °C, (b) 920 °C, (c) 960 °C, (d)1000 °C, (e) 1020 °C, (f) 1050 °C, and (g) 1080 °C.

As can be seen from Figs. 2(b)–2(g), the flow steady state was easier to be reached during the isothermal compression at the temperatures ranging from 920 °C to 1080 °C, which indicated that the softening mechanism was sufficiently fast to balance the rate of work hardening. Moreover, the softening behavior may result in the dynamic recovery or recrystallization.
Meanwhile, the flow stress–strain curve in the isothermal compression at a temperature of 880 °C exhibited a characteristic peak, and then decreases with the strain to reach a steady state. Generally, most of the phases were α phase at the temperature of 880 °C. The characteristic peak maybe related to the interaction between dislocations and twins. Moreover, this softening phenomenon may be caused by the adiabatic heating, dynamic recovery, or recrystallization.
To precisely clarify the hot deformation behavior and its related mechanism of Ti–5.8Al–3Sn–5Zr–0.5Mo–1.0Nb–1.0Ta–0.4Si–0.2Er titanium alloy, the kinetic of deformation and microstructural evolution should be discussed in the subsequent section.
IV. DISCUSSIONS
A. Compensation of strain
To describe the hot deformation behavior of the high-temperature titanium alloy, the Arrhenius equation Reference Sellars and Tegart30 and Zener–Hollomon parameter Reference Zener and Hollomon31 are used to establish the constitutive equation. These equations are mathematically expressed as follows:
 $$Z = \dot \varepsilon \exp ({Q \mathord{\left/ {\vphantom {Q {RT}}} \right. \kern-\nulldelimiterspace} {RT}})\quad ,$$
 $$\dot \varepsilon = Af\left( \sigma \right)\exp \left( { - {Q \mathord{\left/ {\vphantom {Q {RT}}} \right. \kern-\nulldelimiterspace} {RT}}} \right)\quad ,$$
where f(σ) is a function of the flows tress, and the function is given by Eq. (3).
 $$f\left( \sigma \right) = \left\{ {\matrix{ {{\sigma ^{{n_1}}}} & {\alpha \sigma \; \lt \;0.8} \cr {\exp \left( {\beta \sigma } \right)} & {\alpha \sigma \; > \;1.2} \cr {{{\left[ {\sinh \left( {\alpha \sigma } \right)} \right]}^n}} & {{\rm{for\ all\ }}\sigma } \cr} } \right.\quad .$$
Meanwhile,
 $\dot \varepsilon$
is the strain rate (s−1); σ is the flow stress at a given strain; R is the gas constant [8.314 J/(mol K)]; T is the absolute temperature (K); Q is the deformation activation energy (J/mol); Z is the Zener–Hollomon parameter; A, n, n
1, β, and α (α = β/n
1) are the material constants.
Generally, the isothermal compression is a dynamic process, when the work-hardening, dynamic recovery and dynamic recrystallization will synchronously occur. In other word, the strain has significant influence on the flow deformation behavior. Reference Drobnjak, Radovi and Andjeli34,Reference Niu, Hou, Li and Li35 It is also reported that the deformation strain plays an important role in the evolution of the deformation activation energy. Reference Li, Pan, Lin and Luo36 Meanwhile, materials constants, such as α, n, ln A, and Q, are also related to the deformation strain. Therefore, the compensation of strain should be taken into consideration.
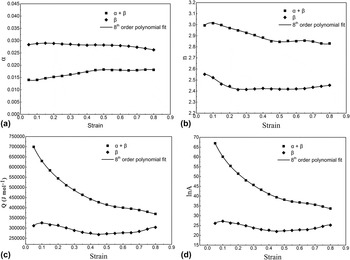
The values of materials constants in the constitutive equation i.e., given by Eq. (4) and the Zener–Hollomon parameter are calculated at strains ranging between 0.05 and 0.8 at 0.05 intervals. The plots of material constants and true strain are shown in Fig. 3. From Fig. 3 (c), the deformation activation energies are 369760.93–699310.86 J/mol in α + β two-phase region and 268030.03–325800.41 J/mol in β single-phase region. The deformation activation energy is much higher than the activation energy for self-diffusion of titanium (150,000 J/mol in α-Ti and 153,000 J/mol in β-Ti), indicating that cross-slipping of dislocation is the main deformation mechanism.
Relationships between material constants (α, n, Q and ln A) and true strain by polynomial fit of the Ti–Al–Sn–Zr–Mo–Nb–Ta–Si–Er titanium alloy (a) α-strain curves, (b) n-strain curves, (c) Q-strain curves and (d) ln A-strain curves.

Obviously, there is a big difference in deformation activation energy in α + β two-phase and β single-phase regions. The difference essentially resulted from the crystal structures of α and β phases. Reference Radovi and Drobnjak32 More and more β phases are transformed to α phases with the decrease in temperature from 1010 °C. α phase with hcp crystal structure is more difficult in deformation than β phase with bcc crystal structure during hot deformation. In general, deformation activation energy reflects the deformation resistance of one material. Therefore, the deformation activation energy in α + β two-phase region is higher than in β single-phase region. For the deformation in β single-phase region, it has been reported that the deformation activation energy is in the range of 180,000 J/mol to 220,000 J/mol. Reference Lee and Lin33 However, the deformation activation energy in β single-phase region calculated in this paper is larger than the general ones, which may be attributed to the participated strengthening and solution strengthening.
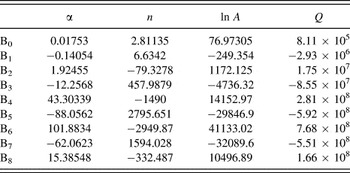
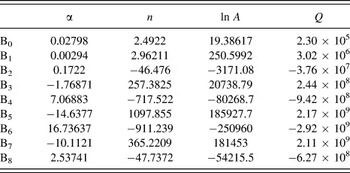
The plots can be polynomial fitted by the compensation of strain. The order of the polynomial can be varied from one to nine. Reference Rezaei Ashtiani, Parsa and Bisadi37,Reference Mandal, Rakesh, Sivaprasad, Venugopal and Kasiviswanathan38 Considering the analysis of correlation and generalization, an 8th order polynomial is the most optimal to fit the plot of materials constants and true strain, as given by Eq. (5). The polynomial fitting coefficients of α, n, A, and Q in α + β two-phase and β single-phase regions for the Ti–5.8Al–3Sn–5Zr–0.5Mo–1.0Nb–1.0Ta–0.4Si–0.2Er titanium alloy are listed in Tables I and II, respectively. Therefore, the constitutive equation with compensation of strain can describe and predict the deformation behavior of the Ti–5.8Al–3Sn–5Zr–0.5Mo–1.0Nb–1.0Ta–0.4Si–0.2Er titanium alloy.
 $$\eqalignb{ \sigma \left( \varepsilon \right) &= \left[ {{1 \mathord{\left/ {\vphantom {1 {\alpha \left( \varepsilon \right)}}} \right. \kern-\nulldelimiterspace} {\alpha \left( \varepsilon \right)}}} \right] \cdot \ln \left\{ {{{\left[ {{{Z\left[ {Q\left( \varepsilon \right)} \right]} \mathord{\left/ {\vphantom {{Z\left[ {Q\left( \varepsilon \right)} \right]} {A\left( \varepsilon \right)}}} \right. \kern-\nulldelimiterspace} {A\left( \varepsilon \right)}}} \right]}^{{1 \mathord{\left/ {\vphantom {1 {n\left( \varepsilon \right)}}} \right. \kern-\nulldelimiterspace} {n\left( \varepsilon \right)}}}} }\right\cr&+ {{\left[ {{{\left[ {{{Z\left[ {Q\left( \varepsilon \right)} \right]} \mathord{\left/ {\vphantom {{Z\left[ {Q\left( \varepsilon \right)} \right]} {A\left( \varepsilon \right)}}} \right. \kern-\nulldelimiterspace} {A\left( \varepsilon \right)}}} \right]}^{{2 \mathord{\left/ {\vphantom {2 {n\left( \varepsilon \right)}}} \right. \kern-\nulldelimiterspace} {n\left( \varepsilon \right)}}}} + 1} \right]}^{{1 \mathord{\left/ {\vphantom {1 2}} \right. \kern-\nulldelimiterspace} 2}}}\Big\} \cr Z &= \dot \varepsilon \exp \left( {{Q \mathord{\left/ {\vphantom {Q {RT}}} \right. \kern-\nulldelimiterspace} {RT}}} \right) \cr}$$
 $$Y\left( \varepsilon \right) = {B_0} + {B_1}\varepsilon + {B_2}{\varepsilon ^2} + {B_3}{\varepsilon ^3} + {B_4}{\varepsilon ^4} + {B_5}{\varepsilon ^5} + {B_6}{\varepsilon ^6} + {B_7}{\varepsilon ^7} + {B_8}{\varepsilon ^8}$$
Coefficients of polynomial fit for α, β, n, ln A and Q in α + β two-phase region.

Coefficients of polynomial fit for α, β, n, ln A and Q in β single-phase region.

B. Microstructural evolution
1. Dynamic softening behavior during hot deformation
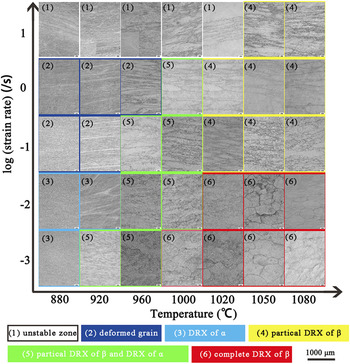
Figure 4 shows the microstructures of the Ti–Al–Sn–Zr–Mo–Nb–Ta–Si–Er titanium alloy compressed at temperatures ranging from 880 °C to 1080 °C and strain rates ranging from 0.001 s−1 to 10 s−1. As shown in Fig. 4, flow localization bands were generated during the deformation at a strain rate of 10 s−1 and temperatures ranging from 880 °C to 1020 °C, indicating that the instability domain mainly occurred in this condition. As following, the stability domain would be discussed.
Microstructures of the Ti–Al–Sn–Zr–Mo–Nb–Ta–Si–Er titanium alloy compressed at temperatures ranged from 880 °C to 1080 °C and strain rates ranged from 0.001 s−1 to 10 s−1 at a strain of 0.8.

Figure 4 is divided into six parts considering the dynamic recrystallization (DRX) of β and α phase, including instable zone, deformed zone, DRX of α phase, practical DRX of β phase, practical DRX of β phase with DRX of α phase, and complete DRX of β phase. In the deformed zone, prior β grain boundaries were also elongated, and most of the initial lamellar α colony was elongated and kinked. In the partial recrystallization DRX of β phase zone, the nucleation of recrystallized β phase occurred at the deformed β grain boundary. With the decrease in strain rate and increase in temperature, more and more β recrystallized grains were generated at the deformed β grain boundaries. In the complete recrystallization of β phase zone, complete β recrystallized grains were formed instead of the deformed β grains, and the recrystallized grain size was increased with the decrease in strain rate and increase in temperature. Moreover, the links among these three zones are the strain rate and temperature. The β phases in the form of elongated grains, nucleation of recrystallized grains, and complete recrystallized grains were generated with the decrease in strain rate and increase in temperature. Therefore, the dynamic recrystallization of the β phase is the main softening mechanism.
Considering the formation characteristic of the β dynamic recrystallized grain in Fig. 4, it was a procedure of discontinuous dynamic recrystallization. The β dynamic recrystallized grain was initiated by the bulging of pre-existing high-angle boundaries and primarily occurred by strain induced boundary migration. It has reported that the low-angle boundaries and twins also played a significant role in the formation of β dynamic recrystallized grain. Reference Mcdonald, Humphreys and Bate39 In addition, the dynamic mechanical behavior of such a discontinuous dynamic recrystallization mechanism had characteristics of multiple-peaks and fluctuation, which were consistent with the stress–strain curves obtained during the isothermal compression at the temperatures ranged from 920 °C to 1080 °C.
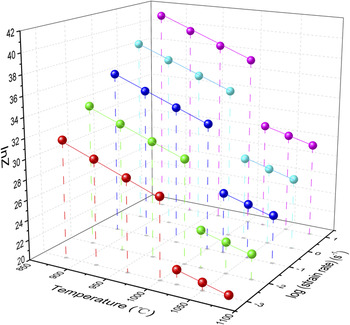
Figure 5 shows the value of ln Z at temperatures ranging from 880 °C to 1080 °C and strain rates ranging from 0.001 s−1 to 10 s−1 at a train of 0.8, which is corresponding with the microstructure in Fig. 4. The value of ln Z was ranged from 28.06 to 40.91 in α + β region, and the value of ln Z was ranged from 20.18 to 30.01 in β region. The value of ln Z was increased with the decrease in strain rate and the increase in temperature. The critical ln Z value for the generation of dynamic recrystallized β grain was 30.01, and the complete dynamic recrystallization of β morphology was generated at the ln Z value ranged from 20.18 to 23.74 in β region at a strain of 0.8. Moreover, the DRX of α phase without the dynamic recrystallized β grain occurred at the ln Z value ranged from 31.70 to 34.01 in α + β region at a strain of 0.8.
The value of ln Z at temperatures ranging from 880 °C to 1080 °C and strain rates ranging from 0.001 s−1 to 10 s−1 at a train of 0.8.

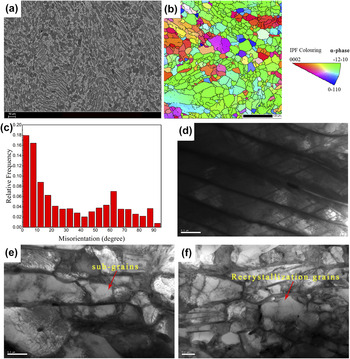
To illustrate the potential mechanism of the DRX of α phase, the microstructure and orientation distribution of the Ti–Al–Sn–Zr–Mo–Nb–Ta–Si–Er titanium that was compressed at a temperature of 880 °C and strain rate of 0.001 s−1 were analyzed in Fig. 6. As shown in Fig. 6(a), a duplex microstructure was generated and composed of the equiaxed α phases uniformly distributed in β transformed matrix. Figure 6(b) and 6(c) show the IPF orientation distribution mapping and mis-orientation distribution, indicating that the mis-orientation distribution was relatively random. It was attributed to the dynamic recrystallization of lamellar α colonies during the isothermal compression at a temperature of 880 °C and a strain rate of 0.001 s−1.
The microstructure and orientation distribution of the Ti–Al–Sn–Zr–Mo–Nb–Ta–Si–Er titanium alloy compressed at a temperature of 880 °C and strain rate of 0.001 s−1: (a) morphology, (b) IPF distribution mapping, (c) misorientation distribution, (d) interaction between dislocations and twins, (e) sub-grains and (f) recrystallization grains.

The detailed microstructures of the alloy deformed at a temperature of 880 °C and a strain rate of 0.001 s−1 were observed to elaborate the hot deformation mechanism in such a condition, shown in Figs. 6(d)–6(f). The interaction between dislocations and twins was found in Fig. 6(d), resulting in the characteristic peak at a strain of 0.05 in Fig. 2(a). And then, the stress was decreased because of the generation of dynamic recrystallization grain, which was also observed in Figs. 6(e) and 6(f). The dynamic recrystallization grain was 300 nm in size. In addition, sub-grains were generated with slipping dislocation inside, which were developed into the recrystallization grains as follows. It was indicated that the softening mechanisms of the alloy were the dynamic recrystallization and recovery of α phase at a temperature of 880 °C and a strain rate of 0.001 s−1, which well agreed with the misorientation distribution in Fig. 6(c).
As shown above, the dynamic recrystallization behavior of lamellar α phase belonged to the continuous dynamic recrystallization. Compared to the dynamic recrystallization of β phase, the lamellar α phase was in the form of sub-grain and dynamic recrystallized grain instead of direct nucleation of recrystallization grain. The process was a recrystallization induced by progressive sub-grain mis-orientation, which was controlled by the mechanical rotation of the sub-grain followed by dislocation climbing and annihilation via diffusion.
At low temperature in α + β region, dynamic recrystallization of lamellar α phase occurred by the mechanical rotation of the sub-grain after the interaction between slipping dislocations and twins. With the increase in temperature, more and more β phases were transformed from α phases on the basis of primary α phase volume-quenching temperature curve. Reference Ma, Lu, Qin and Zhang40 Dynamic recrystallized β phases were generated in the form of nucleation grains at the grain boundaries and complete recrystallized grains, which had lamellar α phases inside. Briefly, the continuous dynamic recrystallization of lamellar α phase and the discontinuous dynamic recrystallization of β phase were the main softening mechanisms during the isothermal compression.
2. Evolution of participates
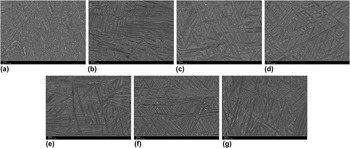
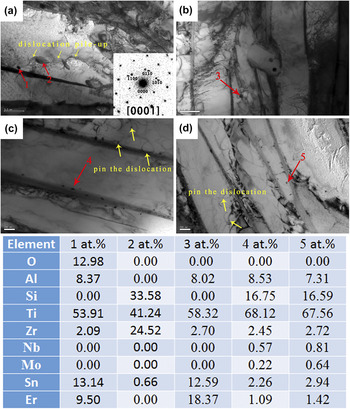
Figure 7 shows the microstructures of the Ti–Al–Sn–Zr–Mo–Nb–Ta–Si–Er titanium alloy compressed at a strain rate of 0.1 s−1 and temperatures ranging from 880 °C to 1080 °C. Numerous rod-like participated phases with an average length of 1.0 μm distributed in the samples deformed at a temperature of 880 °C and a strain rate of 0.1 s−1. To determine the phases, the detailed microstructure and chemical composites were analyzed using TEM. A fusiform phase, presented as rod-like phase in Fig. 8(a), distributed inside α phase. According to the energy dispersion spectrum and selected area diffraction, the fusiform phase was determined to be (Ti,Zr)6Si3. The dislocation pile-up occurred near the (Ti,Zr)6Si3 phase, which was caused by the barrier of this silicide. It is easier to generate cracks during the deformation and harmful to the workability of the alloy.
Microstructures of the Ti–Al–Sn–Zr–Mo–Nb–Ta–Si–Er titanium alloy compressed at a strain rate of 0.1 s−1 and temperatures of (a) 880 °C, (b) 920 °C, (c) 960 °C, (d) 1000 °C, (e) 1020 °C, (f) 1050 °C, and (g) 1080 °C.

Precipitated phases and distribution of the Ti–Al–Sn–Zr–Mo–Nb–Ta–Si–Er titanium alloy compressed at a strain rate of 0.1 s−1 and temperatures of (a) 880 °C, (b) 920 °C, (c) 960 °C, and (d) 1020 °C.

Meanwhile, Er-rich phases with an average diameter of 100 nm also existed in the samples deformed at a temperature of 880 °C and a strain rate of 0.1 s−1. As shown in the energy dispersion spectrum of the point marked by 2, the Er-rich phase also contained O, Sn, Ti, Al, and Ti elements. These Er-rich phase still existed in the matrix during the deformation at a temperature of 880 °C, which was easier to cause stress concentration.
As calculated by Thermo-Calc software, the thermo dynamic phase diagram showed that (α + β) was transformed to [α + β + (Ti,Zr)6Si3] at a temperature of 956 °C during the equilibrium solidification. Reference Chu, Hui, Zhang and Shen41 The initial cogging process was similar to a solid solution heat treatment. The silicate element was super-saturated dissolved into the matrix during the cogging process, and the silicide participated from the matrix at the temperature below 956 °C.
With the increase in temperature ranging from 920 °C to 1080 °C, the fusiform (Ti,Zr)6Si3 phases were not observed in Figs. 7(b)–7(g). As shown in Fig. 7, the Er-rich phases with an average diameter of 100 nm became less at a temperature of 920 °C, and were dissolved into the matrix above 950 °C. Therefore, it was not essential to perform homogenized heat treatment before the hot deformation, and the growth of β grain was restrained.
Moreover, numerous spherical phases with a main diameter of 20 nm existed at temperatures of 960 °C and 1020 °C, and most of them distributed along the α/β boundaries. The spherical phase was determined to be a silicide containing Er via the energy dispersion spectrum, which can pin the dislocations and α phase boundaries. In addition, the spherical phase was not sensitive to the temperature that was above 960 °C, indicated by Figs. 8(c)–8(d).
The erbium element has negligible solubility in α-titanium on basis of the Ti–Er binary phase diagram, and 0.2% erbium element is much higher than the maximum solubility of erbium in α-titanium. The maximum solubility of silicon element in β phase was higher than the one in α phase. As a result, the silicon was participated along α/β boundaries from β phase to α phase during the solidification. The erbium is easier to combine with Si and Sn to form a type of silicide containing Er. In addition, the silicide containing Er was not sensitive to the temperature and strain rate, shown in Figs. 7 and 8. However, the formation mechanism still need further study. Considering the spherical shape and finer size, the silicide containing Er has little effect on the workability of the alloy.
V. CONCLUSIONS
The hot deformation behavior and corresponding microstructure evolution of Ti–5.8Al–3Sn–5Zr–0.5Mo–1.0Nb–1.0Ta–0.4Si–0.2Er titanium alloy has been investigated during the isothermal compression at the temperatures of 880–1000 °C and strain rates of 0.001–10 s−1. The following conclusions can be drawn:
-
(1) The flow stress significantly increases with the decreasing temperature and increasing strain rates. The flow steady state is easier to be reached during the isothermal compression at the temperatures ranging from 920 °C to 1080 °C. Meanwhile, the flow stress increases with the increase in strain and is fast to reach a peak value, and gradually decreases to reach a steady state at a temperature of 880 °C, which is balanced by the work hardening and softening mechanism.
-
(2) The constitutive equation compensated by strain is developed considering the Arrhenius equation and Zener–Hollomon parameter, which can precisely reflect the hot deformation behavior of the alloy. The materials constants (α, n, ln A, and Q) versus strain curves are 8th order polynomial fitted. The deformation activation energies are 369760.93–699310.86 J/mol in α + β two-phase region and 268030.03–325800.41 J/mol in β single-phase region, which is related to the crystal structures of α and β phases.
-
(3) The dynamic recrystallization of β phase is the main softening mechanism during the deformation at temperatures of 920–1080 °C, including direct nucleation and growth of β phase. Meanwhile, the dynamic recrystallization and recovery of lamellar α colony is the main softening mechanism during the deformation at temperatures of 880 °C, which is controlled by the mechanical rotation of the sub-grain followed by dislocation climbing and annihilation by diffusion.
-
(4) The large Er-rich phases are dissolved into the matrix above a temperature of 920 °C, indicating that the isothermal compression process is comparable with the homogenization heat treatment. Silicide containing Er with an average diameter of 20 nm is generated along the α/β boundaries, which has little effect on the workability of the alloy.
ACKNOWLEDGMENTS
This research was supported by the Beijing Natural Science Foundation (Project No. 2162004), and National Natural Science Foundation of China (Project No. 51371013).