Introduction
Aflatoxin is a mycotoxin produced by Aspergillus fungi which can contaminate corn and other staple crops (Patriarca et al., Reference Patriarca, Medina, Pinto and Magan2014 and Payne, Reference Payne1992). It can cause liver cancer in humans and animals (Barrett, Reference Barrett2005) and the U.S.A Food and Drug administration have set a 20 ppb total aflatoxin limit for trade of food/feed (FDA, 2015). Contamination is primarily driven by high temperatures and drought conditions (Horn et al., Reference Horn, Sorensen, Lamb, Sobolev, Olarte, Worthington and Carbone2014). Summer corn crops in south eastern USA are highly susceptible to contamination due to the rainfall variability, high temperatures and light textured soils prevalent in the region (Widstrom et al., Reference Widstrom, Forster, Martin and Wilson1996). Aflatoxin assessment requires the collection of multiple corn samples, is expensive and conducted at harvest (Papadoyanis, Reference Papadoyanis1990) which does not allow the implementation of in-season adaptation strategies such as variable irrigation to reduce contamination risk. Given the cost of aflatoxin analysis, one role of extension services in precision farming is to identify the areas most at risk of such contamination in a given year so that farmers can know if irrigation or planting of more drought resistant varieties of corn would be worthwhile. Incorporating this ability into a web-based decision support tool also makes such information more widely available to farmers.
This paper investigates the development of a web-based decision support tool for aflatoxin contamination risk. A risk factors approach, developed by Kerry et al. (Reference Kerry, Ortiz, Ingram and Scully2017 b) is used in the tool and its implementation is illustrated using county level aflatoxin data for southern Georgia (GA) that were collected over a 30 year period. The approach uses county-level data on factors that have been associated with aflatoxin contamination risk: June maximum temperatures (Salvacion et al., Reference Salvacion, Ortiz, Scully, Wilson, Hoogenboom and Lee2011), June Rainfall (Salvacion et al., Reference Salvacion, Ortiz, Scully, Wilson, Hoogenboom and Lee2011), percentage of area in corn production, percentage of well and excessively drained soils (Palumbo et al., Reference Palumbo, O’Keeffe, Kattan, Abbas and Johnson2010, Damianidis et al., Reference Damianidis, Ortiz, Windham, Scully and Woli2015). For the online tool, the approach has been expanded to include average NDVI for the corn growing area.
Materials and methods
Several layers of data are included in online decision support tool and the following sections give details of the data included in these for the southern GA case study and how they were collected and processed.
Aflatoxin Data
Corn aflatoxin levels for 53 counties in southern GA were determined between 1977 and 2004. Samples came from 10 ears collected at harvest with an average of 3 replications per county. Aflatoxin levels (ppb) were determined by the USDA-ARS Crop Protection and Management Research Unit and the University of Georgia, Natural Products Laboratory in Tifton, GA. The aflatoxin data were not collected for every county in every year.
Weather Information
Monthly weather data for each year 1977–2004 were extracted from the Georgia Weather Network (http://georgiaweather.net) and summarized by county. June maximum temperatures (°C, June TMax) and June rainfall (mm, June RF) were used.
Corn Production Area
The percentage area of each county in corn production was determined using data on corn acreage extracted from https://quickstats.nass.usda.gov/. The exact locations where corn is grown are only available from http://nassgeodata.gmu.edu/CropScape/ from 2008, but these data were used for extracting soil and NDVI data for locations where corn is grown. The corn growing area is relatively consistent in time, but the exact fields in production will vary with rotations and expansion or depletion of land in corn production, so the soil and NDVI data will be affected by this unavoidable experimental error.
Soil Information
A geo-corrected soil association map (1:250,000, NRCS, 2006) was used to identify two soil drainage classes; excessively and well drained. Based on the pixels within each county identified as being in corn production in the 2008/2009 CropScape image, the percentage of the crop growing area in each county with well and excessively drained soils was calculated.
NDVI
Multi-band imagery from the second half of June 2010 available in the Landsat Thematic Mapper (TM) dataset were downloaded from https://earthexplorer.usgs.gov. They were geo-corrected and stitched together to create a large image covering the area of interest. The NDVI was then calculated for each pixel in the corn growing area based on the 2010 CropScape image. The quality assessment band was used to ensure that any pixels covered by cloud were discarded. The average NDVI value of corn growing, cloud free pixels was then calculated for each county.
Risk Factors Approach
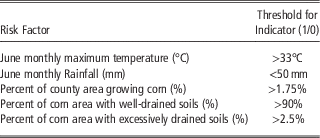
Information from each data layer was transformed into indicators based on the thresholds given in Table 1. Thresholds for June Tmax and June RF were chosen with respect to 30-year normal Tmax and RF in the area to show hotter and drier years than normal. Thresholds for the other risk factors were determined based on tails of the distribution of data in histograms. The indicators were then summed and counties with summed indicator scores ≥3 are considered high risk.
Threshold values used for Risk Factor Indicators

Website Details and Functionality
The website is available at: http://aflatoxin.ctha.cl/. The data for the website is stored using the popular PostGIS spatial extension of the PostgreSQL DBMS. The data along with relationships to spatial locations are stored in the database. To facilitate visualization of the data stored in the database, Geoserver was used to provide a Web Map Service (WMS) interface. The web-client uses OpenLayers to connect directly to the WMS. The site itself uses simple HTML, as well as Bootstrap which is used to give responsive web behavior. The number of layers that can be visualized on a map at any one time depends only on the user as the system permits layers of data to be dynamically added to the map.
Results and Discussion
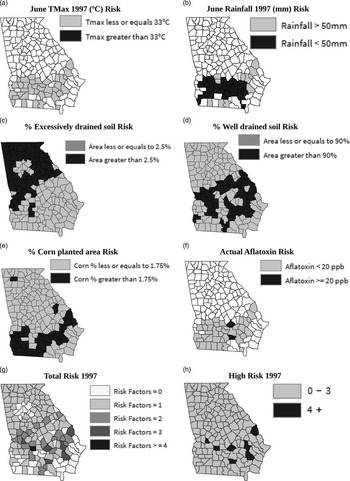
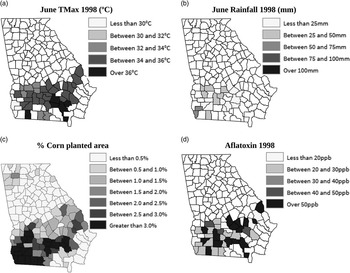
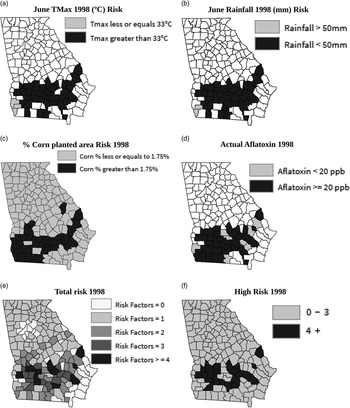
Figures 1 and 3 visualize the data layers used to determine risk for counties in southern GA in 1997 and 1998. Figures 2 and 4 show the contamination risk associated with each layer and the cumulative risk. 1997 was a relatively low risk year as maximum June temperatures were lower than normal (33°C, Figure 1a, 2a) while rainfall was lower than normal (50 mm, Figure 1b, 2b). The weather risk for 1998 was higher in more counties as temperatures were high (>33°C. Figure 3a, 4a), particularly in south eastern GA and rainfall was low (<50 mm. Figure 3b, 4b) throughout southern GA. The soil types of the counties are static in time (Figure 1c) so the risk of excessively (Figure 2c) and well-drained soils (Figure 2d) is the same for 1997 and 1998. The percentage of each county planted with corn varies slightly from year to year. Figures 1d and 2e show the percentage area planted in corn and the associated risk, respectively for 1997 and Figures 3c and 4c show the same information for 1998. Figures 1e and 3d show the actual aflatoxin levels measured in 1997 and 1998, respectively for verification and Figures 2f and 4d show the counties that exceeded the FDA 20 ppb aflatoxin contamination threshold. Finally, Figures 2g and 4e, show the total number of risks per county for 1997 and 1998 and Figures 2h and 4f show the location of high risk counties in both years. Figures 2 and 4 show, as expected, that 1997 was a lower risk year than 1998, but they also show the counties that are at greatest risk. For 1997, the risk factors approach identifies the same counties as being at high risk (Figure 2h) as measured aflatoxin levels suggest (Figure 1e) but also some others in addition. For 1998, the risk factors approach identified slightly fewer counties as high risk (Figure 4f) than actual measurements suggest (Figure 4d), but all the counties identified by the approach did have high aflatoxin levels. This slight overestimation of risk in low risk years and under-estimation in high risk years is probably due to some errors for historical years associated with not knowing the exact corn growing pixels and thus the soils for these areas. Threshold values used in the approach may also need some fine tuning.
Maps of (a) June Tmax, (b) June RF, (c) Soil type, (d) % corn planted area, (e) Aflatoxin for 1997 and (f) Average NDVI for 2010.

Maps of Risk associated with (a) June Tmax 1997, (b) June RF 1997, (c) % excessively drained soil, (d) % well-drained soil, (e) % corn planted area, (f) actual aflatoxin risk 1997 and (g) total number of risk factors for 1997 (h) high risk counties 1997.

Maps of (a) June Tmax, (b) June RF, (c) % corn planted area and (d) Aflatoxin for 1998.

Maps of risk associated with (a) June Tmax 1998, (b) June RF 1998, (c) % corn planted area, (d) actual aflatoxin 1998, (e) total number of risk factors for 1998 and (f) high risk counties 1998.

Data from remotely sensed images on average NDVI of the corn growing area has been incorporated into the online decision support tool. An example from 2010 is shown in Figure 1f and Kerry et al. (Reference Kerry, Ingram, Navarro, Ortiz and Scully2017)a found county average NDVI to be correlated with county June TMax, an important risk factor. Collecting NDVI data for the corn growing area in years prior to 2008 is not currently possible for southern GA as CropScape does not have coverage on where corn was grown before this time and the NDVI needs to be collected just for the corn growing area. Using NDVI and thermal IR data has the potential to be included as an additional risk factor once key thresholds of NDVI that indicate drought stress in corn are established. As NDVI data is also available for 20 m pixels, this also shows the potential for identifying areas smaller than counties that are at risk of contamination. Firstly, areas smaller than counties could be considered and then within the high risk areas, NDVI could be used to identify areas within fields most at risk of contamination and that require more irrigation or variable planting rates. The validity of using NDVI and thermal IR data for identifying drought risk at the sub-county level for aflatoxin contamination risk assessment is investigated as part of another paper at this conference (Kerry et al., Reference Kerry, Ingram, Navarro, Ortiz and Scully2017 a).
Conclusions
The results show that the risk assessment tool is largely successful in identifying years and counties most at risk of aflatoxin contamination. The slight over-estimation in low risk years and underestimation of high risk counties in high risk years is likely to be reduced for years post 2008 when CropScape data on actual corn growing pixels is available so the corn and soil risk factors can be more accurately assessed. Also fine tuning of the thresholds used may be necessary. In addition new factors can be investigated for addition to the risk factors tool such as cumulative rainfall for the rest of the year and irrigation infrastructure. Adding such data should give better indications of actual drought stress in a given year and such data are available at the county level. With some additional research, the use of NDVI and thermal IR data to indicate actual drought stress of the crop in a given season could allow this tool to be utilized to identify high risk areas at the sub-county level. This web-based tool could be adapted to be used in other locations and for assessing contamination risk for other crops and diseases.
Acknowledgements
This work was funded by NOAA RISA grant: NA10OAR4310215 and USDA-NIFA grant 2011-67003-30347. Thanks to Drs. D. Wilson, (University of GA), N. Widsrom (USDA-ARS), W. Wiseman (USDA-ARS) and K. Kreamer for data collection and support.