Introduction
What impact do economic crises have on civic engagement? The impact of economic conditions broadly, and economic crises specifically, on political behaviour has been extensively studied. In particular, prior research has demonstrated the effects of economic conditions on voting behaviour (Lewis-Beck and Stegmaier, Reference Lewis-Beck, Stegmaier, Dalton and Klingemann2007; Dassonneville and Lewis-Beck, Reference Dassonneville and Lewis-Beck2014) as well as protest (Kriesi, Reference Kriesi, Bermeo and Bartels2014; Kurer et al., Reference Kurer, Häusermann, Wüest and Enggist2019). A relatively understudied area is the effect of economic crises on civic engagement, in particular citizen involvement in voluntary associations. Voluntary association membership is a particularly good indicator to examine the effects of economic shocks on citizen participation in democratic societies, as it is relatively stable over time in comparison to voting and protest, which are influenced, respectively, by election timing and political opportunities (Tarrow, Reference Tarrow1998).
This paper examines the impact of the global financial crisis on voluntary association memberships, an important indicator of civic engagement (Putnam, Reference Putnam2000; Schofer and Fourcade-Gourinchas, Reference Schofer and Fourcade-Gourinchas2001). The global financial crisis that began in 2008 was at the time the greatest economic crisis since the Great Depression of the 1930s. The crisis led to severe recessions around the world, known as the Great Recession. The socio-economic effects of the crisis included rising unemployment, loss of retirement savings, home foreclosures, and decreasing opportunities for young people (Grusky et al., Reference Grusky, Western and Wimer2011). In the USA, for instance, over eight million people lost their jobs (Hout et al., Reference Hout, Levanon, Cumberworth, Grusky, Western and Wimer2011: 77), while in Spain and Greece youth unemployment rose to over 50% (World Bank, 2016). In Europe, the crisis led to the introduction of austerity policies with long-lasting effects (Gechert et al., Reference Gechert, Horn and Paetz2019). Although not all countries were affected equally by the crisis, in many countries the effects were both severe and long-lasting. The severe impact of this crisis provides a case in which to examine the impact of economic conditions, and specifically a major economic crisis, on civic engagement.
How might an economic crisis affect participation in voluntary associations? This paper tests two competing hypotheses about how citizens might respond to economic downturn. A retreat hypothesis suggests that the crisis would demobilize citizen participation in voluntary associations, drawing upon existing work on the inequality of participation that indicates those with fewer resources participate less. Alternatively, a mobilization hypothesis suggests that citizens would be mobilized to participate in civic organizations, or at least certain types of civic organizations, in response to the crisis – as a means to advocate for policy interests or provide support to those most in need.
These hypotheses are tested in cross-national comparison, using World Values Survey (WVS) data from before and after the crisis in 14 democratic countries. The results show support for the retreat hypothesis. There was an overall decline in voluntary association memberships following the crisis, and countries harder hit by the crisis were more likely to experience a decline. At the individual level, there was no evidence of mobilization among those most vulnerable to the crisis, with the profile of association members skewed towards those more privileged in society both before and after the crisis. These results were not particular to certain types of association – there was a close relationship between the trends in different types of association, whether old or new social movement associations, or non-political associations for leisure or sport.
This paper proceeds in five sections. The first section is a discussion of the broader concept of civic engagement and voluntary association membership, the operationalization of civic engagement in this paper. This section includes an overview of what prior research shows influences civic engagement, at both the individual level and country level. The second section develops a theoretical framework for the potential impact of an economic crisis on civic engagement. The third section is an overview of the research design including details on the WVS data, case selection, measures, and methods. The fourth section presents the results, beginning with an exploration of the cross-national trends in voluntary association membership from before and after the crisis, and then testing country and individual level predictors of membership using multilevel modelling. Overall, the results support the hypothesis that the global financial crisis depressed, rather than mobilized, participation in voluntary associations. The paper concludes with reflections on the implications of these findings for democratic participation in times of crisis.
Understanding civic engagement and voluntary association membership
Civic engagement has been defined and operationalized in a range of different ways. The most well-known study on the topic, Putnam’s Bowling Alone, did not explicitly define the concept although incorporated a wide range of aspects of community involvement including ‘club meetings, visits with friends, committee service, church attendance, philanthropic generosity, card games, and electoral turnout’ (Reference Putnam2000: 185). Other definitions are more narrowly focussed, Adler and Goggin put forward a definition of civic engagement as ‘the ways in which citizens participate in the life of a community in order to improve conditions for others or to help shape the community’s future’ (Reference Adler and Goggin2005: 236). Ekman and Amnå (Reference Ekman and Amnå2012: 292) describe civic engagement as consisting of ‘activities based on personal interest in and attention to political and societal issues’ as well as ‘voluntary work to improve conditions in the local community’. Several studies have discussed the wide range of definitions and problems with conceptual stretching (Adler and Goggin, Reference Adler and Goggin2005; Berger, Reference Berger2009; Ekman and Amnå, Reference Ekman and Amnå2012).
Whilst the civic engagement concept has been interpreted in a range of ways, many definitions and operationalizations focus on citizen participation in voluntary organizations (see Putnam, Reference Putnam2000; Schofer and Fourcade-Gourinchas, Reference Schofer and Fourcade-Gourinchas2001; Norris, Reference Norris2002). Within this approach, some studies have focussed on participation in associations that are political in their orientation (Uslaner and Brown, Reference Uslaner and Brown2005), while other studies incorporate association memberships more broadly, including sport, leisure, and social groups (e.g. Putnam, Reference Putnam2000; Schofer and Fourcade-Gourinchas, Reference Schofer and Fourcade-Gourinchas2001; Paxton, Reference Paxton2007). This paper will focus on this specific aspect of civic engagement – citizen membership and participation in a range of types of association, both political and non-political.
Among associations with a political purpose, there are more traditional organizations through which citizens engage with the state – unions, professional associations, and political parties – which have been classified as old social movement associations (see Norris, Reference Norris2002: 168–187; Schofer and Fourcade-Gourinchas, Reference Schofer and Fourcade-Gourinchas2001). These bodies, in various ways, act as conduits for interest articulation and aggregation. Additionally, since the 1960s, new social movement associations have emerged, oriented towards post-materialist concerns, such as the environment and humanitarian issues (Norris, Reference Norris2002: 137). These organizations can similarly seek to influence political outcomes, though their approaches may be less conventional. Thus, while the former are conducive to conventional political involvement through parties or unions, the latter can tend towards protest politics, with both contributing to citizen engagement in the political sphere. While some organizations are political in their orientation, others exist primarily for personal enrichment or social interaction, for example, a sport team, book club, or educational group. Newer typologies blur these more traditional classifications, for example, Kousis and Paschou (Reference Kousis and Paschou2017) situate types of ‘alternative forms of resilience’ on a continuum from policy oriented to social movement oriented organization types.
It has long been established that the more politically oriented civil society groups can directly enhance the functioning of democracy. De Tocqueville espoused the virtues of an active citizenry, working together in groups to improve their communities (Reference Tocqueville1966), while Almond and Verba argued that a ‘civic culture’ was conducive to democratic politics, characterized by citizens’ active participation in public life (Reference Almond and Verba1963). More recently, Putnam argued that participation in group associations that go beyond the political realm, such as bowling leagues and the Parent Teacher Association, generates social capital, which contributes to both the democratic health and economic well-being of a society (Putnam et al., Reference Putnam, Leonardi and Nanetti1993; Putnam, Reference Putnam2000). Participation in civic groups is widely viewed as beneficial, both for the individuals who participate and for the societies in which these individuals live (Putnam et al., Reference Putnam, Leonardi and Nanetti1993; Diamond, Reference Diamond1994; Putnam, Reference Putnam2000).
What explains citizen participation in associations? Whilst civic engagement is widely considered a positive attribute of societies, it is well established that there exists a bias in who participates in voluntary organizations. It tends to be wealthier, better educated citizens – those with higher human capital – who participate more, and thus have a greater influence in civic affairs. Prior studies point to a range of factors at the individual level that are associated with higher degrees of civic engagement. Those with higher levels of education and higher socio-economic status are more likely to participate (Scholzman et al., Reference Schlozman, Verba, Brady, Skocpol and Fiorina1999), while the unemployed are less likely to participate (Lim and Sander, Reference Lim and Sander2013). Men are more likely to participate than women (Knoke, Reference Knoke1986; Curtis et al., Reference Curtis, Grabb and Baer1992). Age is argued to have a curvilinear relationship with civic involvement, with the middle aged most likely to participate (Curtis et al., Reference Curtis, Grabb and Baer1992). Religious people, those more trusting of others, and postmaterialists are all more likely to participate, when controlling for a range of other factors (Moyser and Parry, Reference Moyser, Parry and van Deth1997; Schofer and Fourcade-Gourinchas, Reference Schofer and Fourcade-Gourinchas2001). As Schlozman, Verba, and Brady describe it, there is a problem of inequality in civic participation (Verba et al., Reference Verba, Schlozman and Brady1995; Schlozman et al., Reference Schlozman, Verba, Brady, Skocpol and Fiorina1999, Reference Schlozman, Verba and Brady2012); whilst a thriving civil society has benefits for both the individuals who participate and society at large, the benefits are skewed towards those already privileged in society.
Aside from individual level factors, ‘country of residence’ is a powerful predictor of citizen participation in associations, suggesting there are characteristics of states which lead individuals within them to be more or less active in civic life (Curtis et al., Reference Curtis, Grabb and Baer1992: 150; Putnam et al., Reference Putnam, Leonardi and Nanetti1993). This includes religion, it is frequently argued that historically Protestant societies have facilitated a work ethic that encourages citizens to work together for the improvement of their community, providing fertile ground for the emergence of civil society (Inglehart and Baker, Reference Inglehart and Baker2000: 49; Curtis et al., Reference Curtis, Baer and Grabb2001: 785). Democratic experience is also considered important – the longer a country has been democratic, the more a civic culture, which requires freedom of association, has an opportunity to flourish (Curtis et al., Reference Curtis, Baer and Grabb2001: 798). In particular, the post-communist countries of Eastern Europe have consistently weaker levels of civic engagement in comparison with more established democracies (Mondak and Gearing, Reference Mondak and Gearing1998; Howard, Reference Howard2002).
Work on national level predictors also explores the role of economic conditions in shaping civic engagement. Lipset’s work on the social requisites of democracy found that greater societal wealth was associated with ‘the presence of intermediary organizations and institutions which can act as sources of countervailing power, and recruiters of participants in the political process’ (Reference Lipset1959: 84). Inglehart and Baker, in an extensive cross-national analysis, find economic development is associated with cultural shifts towards norms of social trust and participation (Reference Inglehart and Baker2000: 19). Curtis et al. (Reference Curtis, Baer and Grabb2001) argue that individuals within more economically developed societies have a richer network of civic activity. These findings indicate that economic conditions affect the presence of civic associations and citizen participation within them.
The global financial crisis and civic engagement
What effect would a major economic crisis have on citizen engagement in voluntary associations? Prior research suggests the economic circumstances of both individuals and the societies they live within affect civic engagement. Building on previous research, a series of hypotheses are developed as to the expected impact of an economic crisis on voluntary association membership, at both the country and individual level. One set of hypotheses suggests citizens may retreat from engagement in voluntary associations at a time of crisis, whereas another suggests citizens may be mobilized to participate more in civic life in response to an economic shock. These hypotheses draw upon prior research on economic conditions and various types of participation. In particular, studies on political protest have long debated whether poor economic conditions have a mobilizing or demobilizing effect on political action (see Gurr, Reference Gurr1970; Grasso and Giugni, Reference Grasso and Giugni2016; Kurer et al., Reference Kurer, Häusermann, Wüest and Enggist2019: 867). This debate can be similarly considered in the context of citizen participation in voluntary organizations.
Retreat
Cross-national comparative research has shown that societies with lower economic growth have lower levels of citizen participation in voluntary associations (Curtis et al., Reference Curtis, Baer and Grabb2001). This would suggest that in the context of an economic crisis, where many countries go into recession, participation in associations may decline. A range of other studies would also lead to an expectation of retreat. A comparative study by Solt (Reference Solt2008) found that income inequality depresses political interest and participation. Research in the United Kingdom showed that the 2008–2009 recession led to a decline in volunteering behaviour (Lim and Laurence, Reference Lim and Laurence2015). Moreover, studies have found that civil society organizations faced declines in revenue following the 2008 financial crisis, particularly in countries severely impacted, which could affect the ability to attract memberships (Hanfstaengl, Reference Hanfstaengl2010; Simiti, Reference Simiti2017). As countries were affected by the global financial crisis to varying degrees, if the retreat hypothesis is correct, the decline in association memberships would be more evident in countries harder hit by the global financial crisis (Hypothesis 1).
The retreat hypothesis can also be considered at the individual level. Studies on inequality in civic life established that those with fewer resources, in terms of income, education, and employment status, are less likely to participate in voluntary groups (Schlozman et al., Reference Schlozman, Verba, Brady, Skocpol and Fiorina1999; Norris, Reference Norris2002; Laurence and Lim, Reference Laurence and Lim2013). Research on other areas of participation, including voting and protest, suggests a similar trend. Rosenstone tested a ‘withdrawal’ hypothesis and found that economic adversity, including ‘unemployment, poverty, and a decline in financial well-being’ suppressed voter participation. (Reference Rosenstone1982: 25). As he put it, ‘when a person suffers economic adversity his scarce resources are spent holding body and soul together, not on remote concerns like politics’ (Rosenstone, Reference Rosenstone1982: 25). Research by Karp and Milazzo on the global financial crisis (Reference Karp, Milazzo, Vowles and Xezonakis2016) similarly found that the crisis demobilized voter turnout among the most vulnerable in society. Studies on political protest have long debated whether participation is driven by economic grievances or economic resources (see Dalton et al., Reference Dalton, Van Sickle and Weldon2010; Kurer et al., Reference Kurer, Häusermann, Wüest and Enggist2019). The resource model emphasizes that protest participants tend to have higher incomes and higher education levels, due to the time, skills, and resources required to take part (Dalton et al., Reference Dalton, Van Sickle and Weldon2010). Translating this approach from protest to civic engagement would also lead to a retreat hypothesis in the context of an economic crisis where citizens have fewer resources.
On the basis of this prior research, as more citizens find themselves in financial hardship during an economic crisis, for example, through unemployment, underemployment, or other circumstances, it could be expected that these vulnerable subsets of the population would be less engaged with civic groups than those with greater resources (Hypothesis 2). As individuals experiencing economic hardship would be more numerous during a crisis, and as these individuals tend to participate less, this might also lead to effects at the country level, where countries harder hit by the crisis see a greater decline in civic engagement (as per Hypothesis 1).
Hypothesis 1: In countries harder hit by the crisis, voluntary association memberships would be more likely to decline after the crisis than in countries that were less hard hit.
Hypothesis 2: Individuals more vulnerable to the financial crisis, such as the unemployed, those on low incomes, and those with a lower level of education, would be less likely to participate in voluntary associations after the crisis.
Mobilization
Whilst some prior research indicates citizens may retreat from civic engagement during times of economic crisis, other theories point to a mobilization response, particularly in certain types of associations. The more politically oriented associations, including both old and new social movement associations, provide a channel for interest articulation and aggregation (Diamond, Reference Diamond1994: 8). In times of economic crisis, there may be a greater need for the functions fulfilled by various groups, including unions – which advocate on behalf of workers; political parties – which can aggregate and articulate interests; and NGOs – which could fulfil functions ranging from providing resources and support for those at greatest disadvantage in society (e.g. soup kitchens or homeless shelters) to providing an avenue for opposing government policy responses to the crisis, such as austerity measures (see Kousis and Paschou, Reference Kousis and Paschou2017). For these reasons, there could be a mobilization response if citizens join voluntary associations in order to respond to the crisis.
Recent research examining responses to the global financial crisis lends some support to the mobilization hypothesis. Grievance theories suggest that economic grievances can mobilize protest and other forms of participation (Grasso and Giugni, Reference Grasso and Giugni2016). Citizens were mobilized to participate in anti-austerity protests in response to the way governments handled the crisis, particularly in Europe (Beissinger and Sasse, Reference Beissinger, Sasse, Bermeo and Bartels2014; Kriesi, Reference Kriesi, Bermeo and Bartels2014; Cardoso et al., Reference Cardoso, Accornero, Lapa, Azevedo and Castells2018). Whilst participating in a protest does not necessarily entail membership in a formal association, protest movements are often associated with more formal organizations that draw in participants.
Some small-N qualitative studies in Greece and other southern European countries have argued that there was a mobilization of civil society in response to the economic crisis – including organizational activity to fill the void created by contraction of the welfare state (Sotiropoulos and Bourikos, Reference Sotiropoulos and Bourikos2014; Kousis, Reference Kousis2017; Simiti, Reference Simiti2017; Lahusen et al., Reference Lahusen, Kousis, Zschache and Loukakis2018). An Icelandic case study finds that membership in associations was higher after the global financial crisis; however, as the pre-crisis data preceded the post-crisis data by more than 10 years, this does not provide strong evidence that the increase in memberships resulted from the crisis (Growiec et al., Reference Growiec, Vilhelmsdóttir and Cairns2012). A comparative study of South European countries showed that civic engagement, as captured by work in a political party, action group, or other type of association, increased in Spain following the global financial crisis, although based on their data, mobilization was not evident in Greece or Portugal (Wosiek, Reference Wosiek2016).
At the country level, a mobilization response would mean that engagement in voluntary associations would have increased following the crisis, particularly in those countries that were hard hit (Hypothesis 3). At the individual level, if those who were disproportionately affected were more likely to be mobilized to respond, we might see the unemployed and other disadvantaged groups participate more than they would in non-crisis periods (Hypothesis 4).
Hypothesis 3: In countries harder hit by the crisis, voluntary association memberships would be more likely to increase after the crisis than in countries that were less hard hit.
Hypothesis 4: Individuals more vulnerable to the financial crisis, such as the unemployed, those on low incomes, and those with a lower level of education, would be more likely to participate in voluntary associations after the crisis.
Different types of associations
If there was a mobilization response, one might also expect to see differences across the different types of association. With many citizens facing extreme hardship, one might expect a decline in membership of leisure-based associations, such as sporting, art, or cultural groups, as these provide no means of response to the crisis, and perhaps become a lower priority for those struggling with job insecurity, unemployment, home foreclosures, or less disposable income. Association memberships typically require both time and money (Wessels, Reference Wessels and van Deth1997: 203), which are in shorter supply during a crisis. If citizens are mobilized by the crisis to participate in associations, it would be expected that this would pertain only to associations with a political orientation – which may provide an avenue of response to the crisis (Hypothesis 5). This could be through old social movement associations, new social movement associations, or both. Although, if there is no political mobilization as a result of the crisis, it could be expected that resource constraints would lead to declines in participation across the various association types (Hypothesis 6).
Hypothesis 5: After the crisis, membership in politically oriented voluntary associations would increase, while it would decrease in non-political associations.
Hypothesis 6: After the crisis, voluntary association membership would decline across all types of associations.
Data and methods
To investigate the effect of the global financial crisis on voluntary association membership, this paper uses data from the WVS, a major cross-national survey of public attitudes that has been running since the 1980s. The survey incorporates a question battery that captures citizen involvement in a range of types of voluntary organizations. The WVS has been fielded over a number of waves, with two of the most recent waves providing evidence from before and after the crisis. Specifically, Wave 5 was fielded over 2004–2007 and Wave 6 was fielded over 2010–2013. These two waves provide evidence on citizen participation in voluntary organizations from before and after the global financial crisis began in 2008.
From the WVS, a total of 14 countries have been selected for analysis on the basis of three criteria: (1) inclusion in both Waves 5 and 6 of the WVS; (2) country is considered democratic as indicated by a Freedom House ‘free’ classification; and (3) country is classified as having very high human development according to the Human Development Index (United Nations Development Programme, 2016). This enables comparison of the same countries from before and after the crisis began and excludes non-democracies where restrictions on freedom of association may hinder association memberships. The Human Development Index criterion excludes from the sample a very small number of countries that were outliers from the rest of the sample in terms of economic development. The set of 14 countries, listed in Appendix Table A1, includes those hard hit by the crisis, such as Spain and the USA, and those that managed to avoid falling into recession, including Australia. This facilitates comparison, not just within the same countries over time but also across countries affected by the crisis to varying degrees. The set of countries also incorporates variation in the degree of democratic experience, including countries with a long history of democracy such as New Zealand and Sweden, alongside those that democratized more recently such as Spain and South Korea.
The WVS asks respondents whether they are active members, inactive members, or not a member at all of nine types of voluntary organization across Waves 5 and 6 of the survey:
Now I am going to read off a list of voluntary organizations. For each organization, could you tell me whether you are an active member, an inactive member, or not a member of that type of organization?
-
Church or religious organization
-
Sport or recreational organization
-
Art, music, or educational organization
-
Labour union
-
Political party
-
Environmental organization
-
Professional association
-
Humanitarian or charitable organization
-
Other organization
-
(World Values Survey Association, 2012)
This set of questions enables the construction of various measures of civic engagement, operationalized as citizens’ membership and participation in voluntary organizations. As the survey asks about involvement in a wide range of associations, this also facilitates an investigation of membership trends for both old and new social movement associations, the former incorporating political parties, unions, and professional associations, the latter including environmental and humanitarian or charitable organizations (Schofer and Fourcade-Gourinchas, Reference Schofer and Fourcade-Gourinchas2001). As the same questions have been asked across survey waves cross-nationally, this facilitates a comparison of trends across countries and over time.
The main measure of civic engagement is based on Norris’ index of associational activism, a scale weighting active and inactive membership across nine categories of voluntary organization (Reference Norris2002: 147–148). The scale ranges from 0 to 18, with active membership contributing two points to the scale, whereas inactive memberships contribute one point.Footnote 1 To differentiate types of voluntary association, measures of membership in old and new social movement associations are also constructed, drawing upon the approach of Schofer and Fourcade-Gourinchas (Reference Schofer and Fourcade-Gourinchas2001). Old social movement membership includes membership in either a union, a political party, or a professional association, with active and inactive memberships weighted to produce a scale ranging from zero to six. New social movement membership reflects membership in either an environmental organization or a humanitarian/charitable organization and is constructed similarly resulting in a scale from zero to four. Together, the old and new social movement associations fit within the broader category of political associations. A similar scale is constructed for non-political associations, including membership in a religious organization, a sport or recreational organization, an art, music or educational organization, as well as an ‘other’ category, combined into a scale from zero to eight. Table 1 shows how the different association types are classified.
Classifying types of voluntary association

These measures of civic engagement, whilst providing a good indication of voluntary association membership, do have some limitations. Firstly, they cannot entirely reflect the total number of associational memberships a respondent has, as the survey asks whether respondents have one or more memberships in each category, meaning multiple memberships within the one category are not specified (Norris, Reference Norris2002: 147). It also may exclude participation in informal networks if survey respondents do not identify such networks as one of the listed organizational types. From this question battery, we also cannot distinguish between offline and online forms of associational activity. That said, the civic engagement scale provides a good indicator of associational membership that uses all the information available in the WVS. Similar operationalizations of the concept using the same battery of questions from the WVS have been used in other studies which seek to capture civic engagement (Brehm and Rahn, Reference Brehm and Rahn1997; Curtis et al., Reference Curtis, Baer and Grabb2001; Schofer and Fourcade-Gourinchas, Reference Schofer and Fourcade-Gourinchas2001; Jennings and Stoker, Reference Jennings and Stoker2004; Paxton, Reference Paxton2007).
To assess the effects of the economic crisis at the country level, GDP growth figures from the World Bank (2015) are used. Whilst the surveys in each wave of the WVS were fielded at different times for each country, at varying points over 2010–2013 for the latter wave, economic growth rates have been taken for the same time period for each country, to capture differential effects of the economic crisis, which hit hardest cross-nationally during 2008–2009. The measure of GDP growth used is the average annual growth rate for those 2 years. This avoids the growth figure being an artefact of the survey timing, rather than a reflection of crisis impact in comparison to other countries. For the earlier wave of the survey, World Bank GDP growth rates over 2003–2004 are used as an equivalent time period for comparison, prior to the first surveys being fielded.
At the country level, factors which previous research has demonstrated to be relevant in predicting civic engagement are also taken into account. This includes democratic experience – years of democratic experience are calculated as the difference between the survey year and the latest regime transition date (variable ‘PolityIV-durable’ in Norris, Reference Norris2015). As the distribution of years of democratic experience is positively skewed, this variable is log transformed. Protestant background is controlled for as historically Protestant nations are shown to have more vibrant civil societies than those influenced by other religious traditions including Catholicism (Curtis et al., Reference Curtis, Baer and Grabb2001).
At the individual level, factors which may indicate increased vulnerability to an economic crisis are taken into account, alongside a range of control variables. Income is on a scale from 1 to 10, with 10 being the highest income category. Employment status differentiates those in the paid labour force, from the unemployed, and an ‘other’ category which includes retirees, housewives, and students. Education is a dichotomous variable comparing those who completed a college degree or higher, compared to everyone else. Age is divided into three ranges, under 30, 30–49, and over 50. Gender is coded dichotomously. Marital status incorporates those who are married or living together in a de facto relationship. Trust has been shown to be an important predictor of civic engagement (Jennings and Stoker, Reference Jennings and Stoker2004; Uslaner and Brown, Reference Uslaner and Brown2005) and is incorporated in regression models, differentiating those who think ‘most people can be trusted’ from those who think you ‘can’t be too careful in dealing with people’. Religion differentiates those who consider themselves to be a religious person, compared to those who do not. Postmaterialism, which previous studies have identified as a predictor of participation in voluntary associations, is measured via the 12-item index (see Inglehart, 1977: 39–41; Schofer and Fourcade-Gourinchas, Reference Schofer and Fourcade-Gourinchas2001). Full details on question wording and variable coding (Table A2) is provided in the online Appendix.
The data are analysed first with an overview of descriptive trends, comparing aggregate levels of civic engagement in each country from before and after the crisis. To investigate the effects of country level and individual level factors on civic engagement, multilevel negative binomial regression modelling is used. Multilevel modelling reflects the hierarchical structure of the data which is individuals (level 1) nested within countries (level 2). There are debates regarding the appropriate number of level 2 units for multilevel modelling. Fourteen countries fall within many guidelines as to a sufficient number of group level units (Robson and Pevalin, Reference Robson and Pevalin2016: 26–27), although some caution should be exercised in interpreting country level coefficients (Bryan and Jenkins, Reference Bryan and Jenkins2016).
Negative binomial regression is appropriate for the dependent variable which is a cumulative count of memberships in voluntary organizations, with active memberships weighted to contribute twice as much to the total as inactive memberships. Negative binominal regression is similar to a Poisson regression model although allows for overdispersion as indicated by a non-zero alpha value (Rodríguez, Reference Rodríguez2018). Similar modelling approaches have been used in other studies with association memberships as a dependent variable (see, e.g., Curtis et al., Reference Curtis, Baer and Grabb2001; Schofer and Fourcade-Gourinchas, Reference Schofer and Fourcade-Gourinchas2001; Beyerlein and Hipp, Reference Beyerlein and Hipp2006; Karakoc, Reference Karakoc2013).
Results
Trends in civic engagement
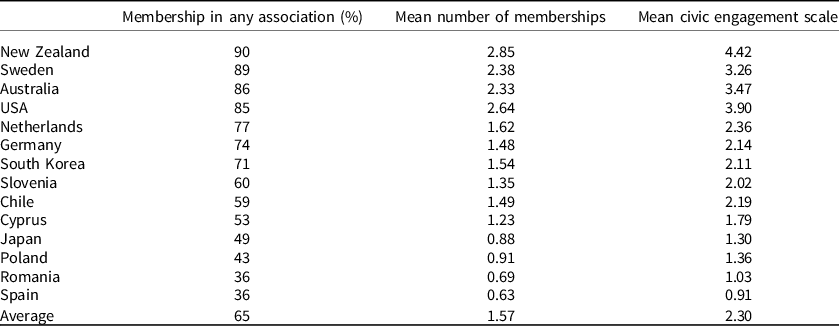
Before examining the effects of the global financial crisis on civic engagement, it is illustrative to view the trends in civic engagement across the 14 countries. Table 2 shows three measures of associational membership for each country, drawn from Wave 6 of the WVS fielded over 2010–2013. The three measures are drawn from Norris’ approach (Reference Norris2002: 147–148). The first column shows the percentage of respondents within each society who are members, either active or inactive, in one or more voluntary associations. The second column shows the average number of associations citizens are part of within each country. The third is the average civic engagement scale, which ranges from 0 to 18, weighting active and inactive membership across the 9 categories of voluntary organizations.
Measures of voluntary association membership

Note: The civic engagement scale (0–18) incorporates active (+2) and inactive (+1) memberships across nine types of voluntary association.
Source: Wave 6 World Values Survey (2015).
The results show considerable variation across the 14 countries. In New Zealand, 90% of the population is a member of at least one association, whereas in Spain, the figure is just 36%. The average across all countries is 65%. On the whole, countries that have been democratic for longer, including Sweden, Australia, and the USA, have much higher levels of civic engagement than those countries that democratized more recently, including the post-communist countries in the sample. The average number of memberships is highest again in New Zealand at 2.85, followed by Sweden, 2.38, and lowest in Spain at 0.63. The civic engagement scale in the final column follows a similar pattern and is the primary measure that will be used in this paper as it makes use of the entirety of information provided by respondents regarding their engagement in voluntary associations.
In addition to differences between countries, we can also examine variation within each country over time. Figure 1 plots the mean score on the civic engagement scale for all 14 countries at each time the question set on voluntary association membership has been fielded in the WVS. These results again demonstrate that in countries with a longer history of democracy, such as New Zealand, Sweden, and Australia, citizens tend to be more active in civic life than in newer democracies, such as Poland and Romania. For the few countries that incorporate long-term trends from the 1980s, Australia, South Korea, and Japan, the trajectory tends to be upwards over time, although in many countries there is a more recent decline over the 2000s.
Trends in civic engagement over time. Notes: Charts plot the mean civic engagement scale (0–18) for each country over time. The scale is constructed from questions worded identically in each survey on active and inactive membership in nine types of voluntary associations. Surveys were fielded in some countries on more occasions than others. Sources: World Values Survey waves 1, 3, 5 and 6.

Mobilization or retreat?
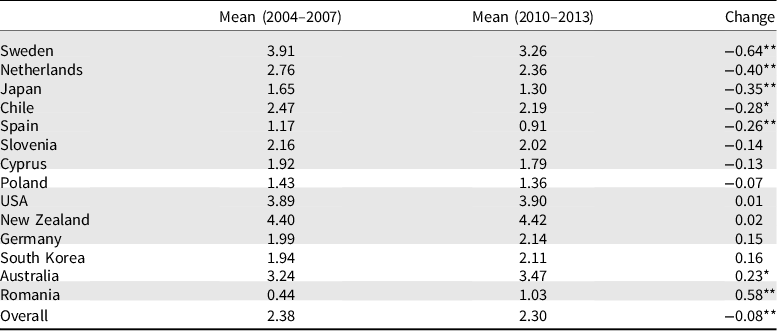
To investigate how associational membership may have been shaped by the global financial crisis, we can first compare the scores on the civic engagement scale from the pre-crisis and post-crisis surveys. Independent samples t-tests were conducted to assess whether there are significant differences between the civic engagement scale before and after the crisis. The results are presented in Table 3 and show mixed findings. There is a statistically significant decline in five countries, no significant change in half of the sample, and a significant increase in two countries. Across the sample as a whole, there is a significant decline in civic engagement since the global financial crisis. The two countries where civic engagement increased were unique; Australia was one of few countries to avoid severe impacts of the global financial crisis,Footnote 2 while in Romania, civic engagement increased from the lowest level in the sample, a reflection of its communist history (Howard, Reference Howard2002). None of the countries that avoided a recession (those unshaded in Table 3) experienced a significant decline in civic engagement.
Trends in civic engagement

*P < 0.05, **P < 0.01.
Note: The table presents means of the civic engagement scale, which is constructed using weighted responses to the questions regarding active or inactive membership across nine types of voluntary organizations. Scale ranges from 0 to 18, with each active membership contributing two points to the scale, and each inactive membership, one point. Shaded countries experienced a recession during the global financial crisis.
Source: Wave 5 and Wave 6 World Values Surveys (2014, 2015).
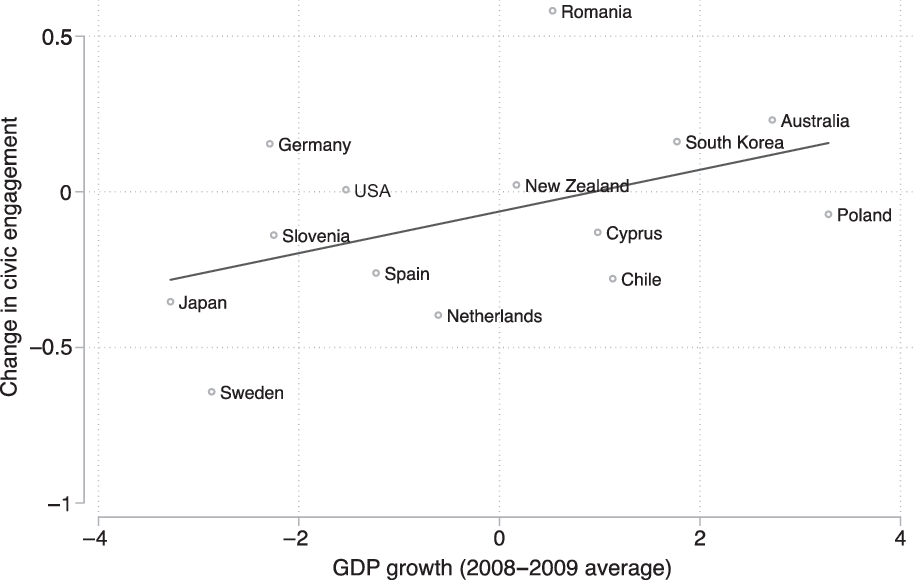
As countries in the sample were affected by the crisis to varying degrees, we can better examine whether the crisis led to mobilization or retreat at the country level, by factoring in this variation in crisis impact. Figure 2 plots growth rates over 2008–2009, the peak of the crisis, against the change in the civic engagement scale between the two survey waves. Using GDP growth from the crisis peak accounts for variation in crisis impacts between countries. The relationship is positive although falls narrowly short of statistical significance (r = 0.45, n = 14, P = 0.10). This evidence is broadly consistent with the retreat Hypothesis 1 – in countries harder hit by the crisis, civic engagement was more likely to decline than in those countries that fared relatively well in the crisis, such as Australia. Although this does not rule out that other factors could have contributed to the observed trend, the evidence in Figure 2 aligns with the retreat hypothesis. We can reject the mobilization hypothesis at the country level (Hypothesis 3) that countries that experienced greater crisis impacts would see an increase in civic engagement.
Economic crisis impact and change in civic engagement. Note: Change in civic engagement measures the difference in the civic engagement scale country means (0–18) between WVS Wave 5 (2004–07) and Wave 6 (2010–13). Sources: Civic engagement from the Wave 5 and 6 World Values Surveys (2014; 2015); GDP growth from the World Bank (2015).

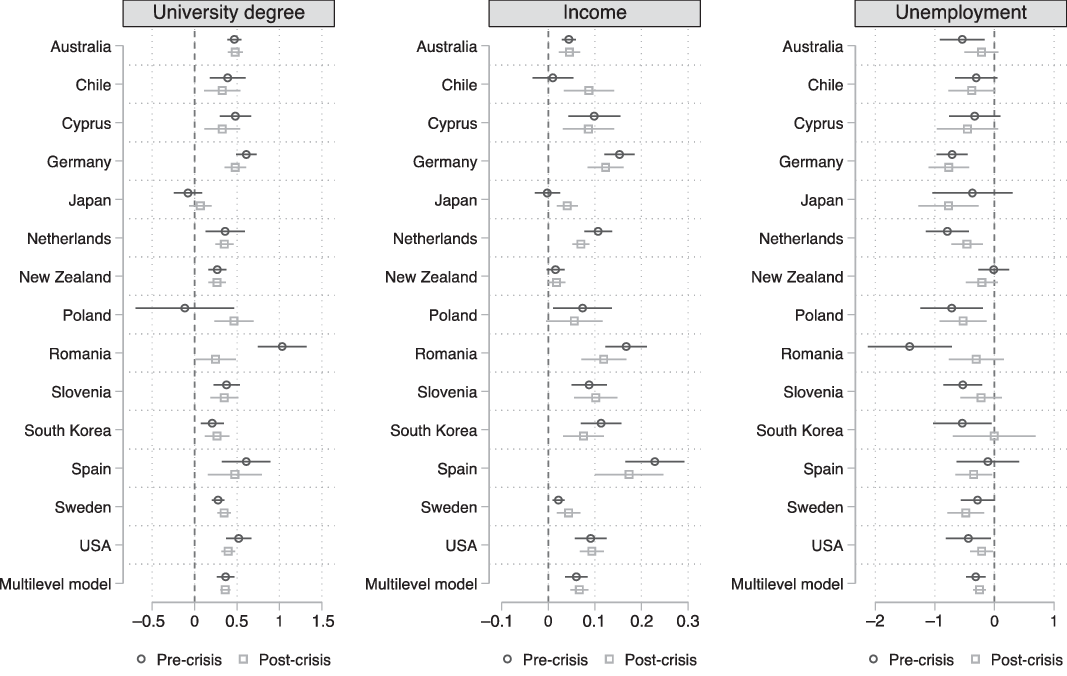
The retreat and mobilization hypotheses can also be examined at the individual level. Figure 3 presents the results of bivariate negative binomial regression models to investigate the effect of various socio-economic indicators – university degree, income, and employment status – on civic engagement. The plots show the results for each of the 14 countries, as well as a multilevel model incorporating all countries, distinguishing the pre-crisis and post-crisis results. Looking first at education, in the majority of countries having a university degree has a significant positive affect on civic engagement. Higher incomes are also associated with higher levels of civic engagement. The unemployed are less involved in voluntary associations than those in the labour force. In each of the plots, the direction of relationships is, for the most part, consistent cross-nationally.
Effect of resources on civic engagement.
Note: Charts plot coefficients and 95% confidence intervals for negative binomial regression models before and after the crisis. The models regress university degree, income, and unemployment, respectively, on the civic engagement scale (0–18). University degree is dichotomous. Income is on a 10-point scale. The unemployed are compared against labour force participants.
Source: Wave 5 and Wave 6 World Values Surveys (2014, 2015).

Comparing the effects of the socio-economic indicators over time shows that they are having a similar effect before and after the crisis, as indicated by overlapping confidence intervals. The data reveal a pattern of continuity rather than change – it continues to be those with university educations, higher incomes, and those in the labour force who are more engaged in civic associations. There was no mobilization of those more vulnerable to the crisis, so Hypothesis 4 can be rejected. There is support for Hypothesis 2 which suggested those with fewer resources would remain less likely to participate in civic groups. Those more vulnerable in society did not become further demobilized, rather they remained similarly inactive in associations, relative to those with greater resources.
To build upon these descriptive trends, a multilevel model taking into account predictors at the country and individual level, alongside a range of control variables, will provide a stronger test of these hypotheses. Figure 4 presents the results of a negative binomial multilevel regression model investigating what explains civic engagement. The same model has been run on the WVS data from before (2004–2007) and after the crisis began (2010–2013). This enables a comparison of the impact of various independent variables at the two time points.
Explaining civic engagement in cross-national comparison. Note: Chart plots coefficients and 95% confidence intervals for a multilevel negative binomial regression model with random intercepts produced using the Stata menbreg command. The dependent variable is the civic engagement scale (0–18). The base category for age is 18–29. The base category for employment status is labour force participants. Sources: Wave 5 and Wave 6 World Values Surveys (2014, 2015), with country level indicators from the World Bank (2015) and Norris (Reference Norris2015).

The analysis of country level predictors of civic engagement is largely consistent with previous research (Curtis et al., Reference Curtis, Grabb and Baer1992, Reference Curtis, Baer and Grabb2001; Schofer and Fourcade-Gourinchas, Reference Schofer and Fourcade-Gourinchas2001) and does not suggest any major change following the crisis. Democratic experience is positively associated with civic engagement both before and after the crisis, although the effect is weaker after the crisis. GDP growth is not significant in the multilevel model. Historically Protestant societies have higher levels of civic engagement both before and after the crisis. Due to a smaller sample size at the country level, coefficients at this level should be treated with some caution, as a larger sample size would allow for more precise estimates (Bryan and Jenkins, Reference Bryan and Jenkins2016). Nevertheless, these results are indicative of relationships at the country level.
At the individual level, the results show that those with higher incomes and higher levels of education participate more, while the unemployed participate in civic associations less than those in the labour force. Women are significantly less likely to participate than men, while civic engagement is higher among those who are more trusting, religious, and postmaterialist, respectively. There are no significant differences based on age group or marital status. These results are largely consistent with previous research findings, though other studies have found significant differences between age groups (Curtis et al., Reference Curtis, Grabb and Baer1992; Schofer and Fourcade-Gourinchas, Reference Schofer and Fourcade-Gourinchas2001) and have found married people participate more (Scott, Reference Scott1957; Knoke and Thomson, Reference Knoke and Thomson1977; Schofer and Fourcade-Gourinchas, Reference Schofer and Fourcade-Gourinchas2001). There is little change in these relationships between the two time points, both in terms of direction and magnitude. The unemployed have lower levels of civic engagement than those in the labour force both before and after the crisis, although the difference was greater before the crisis. These results echo previous research on the global financial crisis that examined other dimensions of political engagement, including protest and voting, where the pattern of political behaviour following the crisis was one of continuation, with ‘surprisingly muted and moderate’ responses, rather than considerable change (Bermeo and Bartels, Reference Bermeo and Bartels2014: 31).
That the predictors of civic engagement remain largely similar before and after a major economic crisis does have consequences for understanding political behaviour during times of crisis. The data do not support the mobilization Hypothesis 4, that those at an economic disadvantage would be mobilized to participate in civic associations as a result of the crisis. Rather, the data support the hypothesis that those more vulnerable would remain less engaged in voluntary groups (Hypothesis 2). These findings are consistent with the results at the country level which showed a greater decline in civic engagement in countries harder hit by the crisis, in line with the retreat Hypothesis 1. As economic crises lead to more citizens experiencing economic disadvantage, and as disadvantaged individuals tend to participate less in associations – one would expect a decline in civic engagement overall during times of crisis, even though the socio-economic profile of participants has not changed.
Different types of associations
The analyses so far have examined civic engagement across all measured voluntary association types. There may be reasons to expect that some types of associations may be affected by the crisis in different ways to others. The previous literature makes distinctions between old and new social movement organizations (see Wessels, Reference Wessels and van Deth1997; Schofer and Fourcade-Gourinchas, Reference Schofer and Fourcade-Gourinchas2001; Norris, Reference Norris2002). We can also distinguish politically oriented associations, whether new or old social movement associations, from those associations that serve no direct political purpose, for example, art and sport groups.
Examining the change in the different types of association memberships before and after the crisis shows indications that the different association types trended in the same direction. The scatterplots in Figure 5 show that the relationship between the change in old and new social movement memberships was positive and significant (r = 0.78, n = 14, P < 0.01). Similarly, there is a positive relationship between the change in political associations and non-political associations (r = 0.68, n = 14, P < 0.01). The overall change between the two survey waves is significantly negative for old social movement organizations and non-political associations, and there was no significant change for new social movement organizations (see Appendix Table A3). While half of the sample experienced a significant decline in one or more types of association memberships, Romania, the country with the lowest levels of civic engagement to begin with, was the only country to see a significant increase in civic engagement in any type of association. Overall, there is no evidence of mobilization within politically oriented associations, so Hypothesis 5 can be rejected. The similarity of trends across different association types, and a primarily downward trend, provides further support for the retreat Hypothesis 6. These results align with Wessels (Reference Wessels and van Deth1997: 216) who found that income and education mattered for civic engagement overall, though did not have particularized effects for different types of associations.
Change in different types of association memberships. Note: The classification of different association types is detailed in Table 1. Active memberships contribute two points towards each scale, and inactive memberships, one point. The change is the difference in the country means between Wave 5 and Wave 6 of the World Values Survey. Source: Wave 5 and Wave 6 World Values Surveys (2014, 2015).

Conclusion
This paper has examined whether an economic crisis would mobilize or demobilize civic engagement. To do so, it tested the impact of the global financial crisis on voluntary association membership in a comparative study of 14 democratic countries. Using data from Waves 5 and 6 of the WVS, the paper has compared levels of associational membership in the same set of countries before the crisis (2004–2007) and after the crisis began (2010–2013), combining analysis of aggregate cross-national trends, alongside multilevel modelling. This paper has tested competing hypotheses, as to whether the crisis led to mobilization or retreat from engagement in voluntary associations. The results lend support to the retreat hypothesis. Those countries that were harder hit by the global financial crisis were more likely to see declines in civic engagement across their societies as a whole. At the individual level, there was no evidence of mobilization amongst those most vulnerable to an economic crisis. Rather, the predictors of voluntary association membership remained similar before and after the crisis. Participants had higher levels of education, higher incomes, and were more likely to be in employment. Looking at trends across different types of associations – old social movement, new social movement, and non-political associations – showed that the primarily downward trends in association membership were similar across different association types.
These results contribute to our understanding of how political engagement and participation may be affected by an economic shock. Whilst prior studies have shown that economic crises can mobilize political participation, such as protest (Beissinger and Sasse, Reference Beissinger, Sasse, Bermeo and Bartels2014; Kriesi, Reference Kriesi, Bermeo and Bartels2014), the results presented here find that crises can depress other kinds of participation, including associational memberships. This study builds on previous research examining the impacts of the global financial crisis on civic engagement by examining this question in cross-national comparison in a sample that extends beyond Europe; using representative surveys to reflect trends across populations as a whole; comparing trends within the same set of countries over time; factoring in a range of association types; and accounting for both country and individual level predictors. This approach provides a rigorous test of the hypotheses with the results lending support to the retreat hypotheses. This finding is consistent with resource-based models of participation (Dalton et al., Reference Dalton, Van Sickle and Weldon2010) including a UK study showing a reduction in voluntarism following the crisis (Lim and Laurence, Reference Lim and Laurence2015).
This finding of a retreat response is not to discount the work on new repertoires of civic engagement in response to the crisis in particular contexts, such as Greece (Sotiropoulos and Bourikos, Reference Sotiropoulos and Bourikos2014; Kousis and Paschou, Reference Kousis and Paschou2017). Crises may mobilize in particular ways while demobilizing participation overall. A shift in repertoires does not necessarily entail an increase in levels of participation, and mobilization within segments of society does not necessarily reflect mobilization in that society as a whole. Moreover, trends in a particular country do not necessarily travel to other country contexts. What this study shows is that a cross-national examination of trends in associational membership across populations does not lend support to the mobilization argument.
Whilst this study enhances our understanding of the impact of a major economic shock on civic engagement, there are some limitations of this study which may provide avenues for further research. Firstly, although there is a negative correlation between the degree of crisis impact and the change in civic engagement between the two waves of the WVS, it cannot be ruled out that other factors not considered here could be responsible for the change. Second, whilst this study has examined the global financial crisis, we do not know if these findings would apply to other periods of economic crisis or other types of crises. Although the post-crisis data covered here are from a few years after the crisis onset, we do not know whether the effect observed is temporary or would have longer term effects. Third, as the WVS measures are focussed on association memberships, they do not necessarily capture informal networks or online forms of civic engagement. Despite these limitations, this study advances our understanding of how the global financial crisis affected civic engagement, by examining trends in associational membership in cross-national comparison.
This paper’s finding that the global financial crisis depressed civic engagement has a number of important implications for understanding the political impacts of economic shocks. Civic engagement is more stable over time than electoral participation and protest. An analysis of civic engagement therefore provides a more reliable test of crisis impacts on participation, adding to previous research that has focussed on voting and protest (see, e.g., Dassonneville and Lewis-Beck, Reference Dassonneville and Lewis-Beck2014; Grasso and Giugni, Reference Grasso and Giugni2016; Kurer et al., Reference Kurer, Häusermann, Wüest and Enggist2019). It is well established that civic engagement has broader benefits for democratic societies (Diamond, Reference Diamond1994; Putnam, Reference Putnam2000), so understanding the effects of an economic shock on civic engagement has important implications for the health of democracy during times of crisis. One implication of these findings is that during times of hardship when the functions provided by voluntary associations – from political activism to humanitarian support – may be of greater need, this need will not necessarily be matched by greater degrees of citizen engagement and voluntarism.
Acknowledgements
This research was supported by the University of Sydney’s School of Social and Political Sciences and the Australian National University’s School of Politics and International Relations. In particular, I would like to thank Lisa Adkins (Sydney) and Ian McAllister (ANU). Thanks also go to Madeline Cameron Wardleworth for reviewing an earlier version of this paper and support with editing. An earlier version of this paper was presented at the LIVEWHAT Summer School on Citizens’ Resilience in Times of Crisis at Scuola Normale Superiore in Florence, with support from the LIVEWHAT project. Many thanks to the organizers Lorenzo Bosi and Lorenzo Zamponi, as well as discussants and participants.
Supplementary material
To view supplementary material for this article, please visit https://doi.org/10.1017/S1755773921000060.