INTRODUCTION
Ruminal acidosis has been shown to depress animal performance and welfare in intensive beef cattle production systems (Nagaraja et al. Reference Nagaraja, Galyean and Cole1998; González et al. Reference González, Manteca, Calsamiglia, Schwartzkopf-Genswein and Ferret2012). This pathology generally occurs in the early fattening period as a result of a shift from high-forage to high-concentrate diets (Bevans et al. Reference Bevans, Beauchemin, Schwartzkopf-Genswein, McKinnon and McAllister2005) or in situations when older animals consume large amounts of readily fermentable carbohydrates (Nagaraja & Titgemeyer Reference Nagaraja and Titgemeyer2007). Several studies have been focused on the microbiological changes during acidosis episodes (Nagaraja & Titgemeyer Reference Nagaraja and Titgemeyer2007; Mao et al. Reference Mao, Zhang, Wang and Zhu2013; Petri et al. Reference Petri, Schwaiger, Penner, Beauchemin, Forster, McKinnon and McAllister2013) and on prevention strategies, including feed additives (Castillo et al. Reference Castillo, Benedito, Mendez, Pereira, Lopez-Alonso, Miranda and Hernandez2004) and feeding management (Castrillo et al. Reference Castrillo, Mota, Van Laar, Martin-Tereso, Gimeno, Fondevila and Guada2013). Streptococcus bovis is considered one of the main lactic acid producers (Chaucheyras-Durand et al. Reference Chaucheyras-Durand, Chevaux, Martin, Forano and Rigobelo2012) and has been traditionally involved in the aetiology of the acute form of acidosis (DiLorenzo et al. Reference DiLorenzo, Diez-Gonzalez and DiCostanzo2006), although sometimes rumen acidosis symptoms do not match with increased concentrations of S. bovis (Blanch et al. Reference Blanch, Calsamiglia, DiLorenzo, DiCostanzo, Muetzel and Wallace2009). This process is characterized by the accumulation of lactic acid in the rumen and therefore lactic acid utilizers such as Selenomonas ruminantium (Chaucheyras-Durand et al. Reference Chaucheyras-Durand, Chevaux, Martin, Forano and Rigobelo2012) may play an important role in its modulation. However, lactate does not accumulate in sub-acute acidosis (SARA) conditions, characterized by rumen pH between 5·0 and 5·6 and volatile fatty acid (VFA) over 150 mm/l (Krause & Oetzel Reference Krause and Oetzel2006; Nagaraja & Titgemeyer Reference Nagaraja and Titgemeyer2007), so other microorganisms could be also implicated in SARA.
In its unprocessed form, the starch of cereals is incompletely fermented in the rumen (Svihus & Zimonja Reference Svihus and Zimonja2011), thus cereal processing such as grinding, pelleting or rolling improve its availability (Owens et al. Reference Owens, Secrist, Hill and Gill1997). However, if an excessive degradation rate of starch is promoted, the risk of ruminal acidosis may increase (Svihus et al. Reference Svihus, Uhlen and Harstad2005). Increasing the particle size of feeds (González et al. Reference González, Manteca, Calsamiglia, Schwartzkopf-Genswein and Ferret2012) or the pellet diameter (Castrillo et al. Reference Castrillo, Mota, Van Laar, Martin-Tereso, Gimeno, Fondevila and Guada2013) may slow down the intake pattern and/or the starch degradation rate of concentrate, resulting in more balanced rumen fermentation.
In a previous experiment (Gimeno et al. Reference Gimeno, Al Alami, Abecia, de Vega, Fondevila and Castrillo2015), it was observed that beef calves fed high-grain diets from 150 to 250 kg showed more stable rumen fermentation and a lower proportion of individual ruminal traits indicative of SARA when cereals were offered dry-rolled. These effects were probably due to the larger particle size of dry-rolled cereals and maintenance of the integrity of either the endosperm protein matrix of maize or the fibrous pericarp of barley (Offner et al. Reference Offner, Bach and Sauvant2003), together with a more homogeneous pattern of concentrate intake throughout the day in animals fed dry-rolled cereals.
Nevertheless, changes in rumen conditions with the age of calves, such as the increase in rumen volume and in the density and size of rumen papillae because of the continuous presence of VFA (Heinrichs Reference Heinrichs2005), as well as the gradual adaptation of microbiota to high-grain diets (Fernando et al. Reference Fernando, Purvis, Najar, Sukharnikov, Krehbiel, Nagaraja, Roe and Desilva2010), might allow for an increased resistance to acidosis. On the other hand, the increased intake of concentrate in older animals may increase the risk of SARA. The balance between these two situations would render a different response to the type of cereal used and its form of processing in animals in the late fattening period compared with those in the early stage.
The current paper aimed to study the effect of the type of cereal (maize or barley) in the concentrate and its processing form (ground to 3·5 mm or dry-rolled) on the feed intake and rumen fermentation patterns and on the concentration of total bacteria and target microorganisms involved in lactic acid metabolism of beef calves in the late fattening period.
MATERIALS AND METHODS
Animals, diets and experimental design
All procedures were carried out in the facilities of the Servicio de Experimentación Animal (University of Zaragoza) and approved by the Ethic Committee for Animal Experimentation (reference PI03/09). Care and management of animals agreed with the Spanish Policy for Animal Protection RD 53/2013, which complies with EU Directive 2010/63 on the protection of animals used for experimental and other scientific purposes.
Eight 6-month-old Holstein–Friesian male calves provided with an 88-mm long, 10-mm internal diameter (i.d.) cannula (DIVASA Farmavic S.A., Vic, Barcelona, Spain) fitted in the dorsal sac of the rumen were individually housed in 5·44 m2 pens with separate feeders for concentrate and roughage. Animals, which were previously used in a similar study, were fed ad libitum with a cereal-based concentrate plus barley straw for a month as an adaptation period. Then, they were allocated randomly to one of four experimental treatments, beginning the experimental period with 282 ± 5·2 kg body weight (BW).
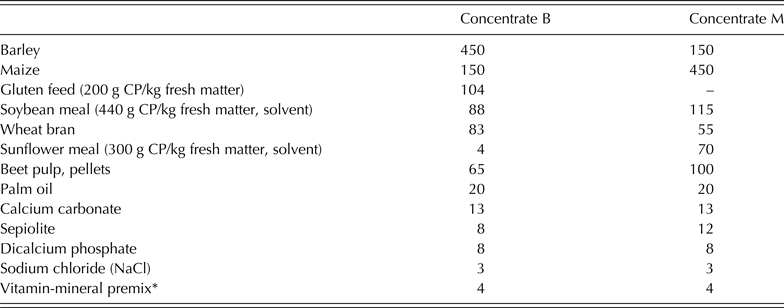
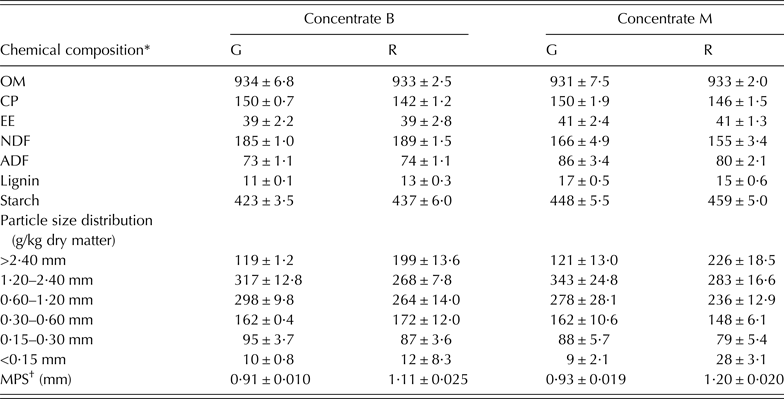
Two compound feeds were formulated to provide similar contents of protein and energy (Table 1), containing 600 g/kg of a maize and barley mixture in the following proportions: 75:25 (concentrate M) and 25:75 (concentrate B). Cereals were either ground to 3·5 mm pore size sieve (G) or dry-rolled (R), whereas the rest of ingredients were ground to 3·5 mm in both G and R. Thus, four experimental compound feeds (MG, MR, BG and BR) were offered together with chopped barley straw following a 2 × 2 factorial arrangement. Four calves received concentrate M and the other four received concentrate B throughout the whole experiment, which were offered to each animal in the two presentation forms (R and G) in two periods of 35 days, following a cross-over arrangement. The first 14 days of each period were for diet adaptation, from day 15 to 28 for feed intake recording and the last week for rumen content sampling and determination of the feed intake pattern. The concentrate and the straw were offered once (08·00 h) and twice (08·00 and 17·00 h) a day, respectively, and the amounts were daily adjusted to ensure ad libitum access. The amounts of concentrate and straw offered as well as the refusals were individually recorded weekly, and representative samples were dried at 105 °C for 24 h to determine dry matter (DM) intake. Representative samples of the compound feeds and straw were collected weekly and pooled by period (n = 2). Table 2 shows the chemical composition and particle size distribution of concentrates. The chemical composition of barley straw was (g/kg DM): organic matter (OM) 889; crude protein (CP) 27·5; neutral detergent fibre (NDF) 737; acid detergent fibre (ADF) 523; and lignin 100. Animals were weighed weekly.
Ingredient composition (g/kg fresh matter) of the experimental concentrates formulated with a 600 g/kg mixture of barley and maize in proportions 75:25 (B) or 25:75 (M)

Crude protein.
* Vitamin–mineral premix composition (per kg): 2·5 × 106 IU vitamin A, 0·5 × 106 IU vitamin D3, 2·5 g alpha-tocopherol, 20 g sepiolite, 0·225 g etoxiquin, 0·225 g butylhydroxytoluene, 10 g Mn oxide, 2·1 g Fe sulphate, 25 g Zn oxide, 0·125 g Ca iodate, 0·075 g Co sulphate, 0·600 g Cu sulphate and 0·050 g Na selenite.
Chemical composition (g/kg dry matter) and particle size distribution (g/kg dry matter) of the concentrates formulated with a 600 g/kg mixture of barley and maize in proportions 75:25 (B) or 25:75 (M) and subjected to grinding (G) or dry-rolling (R).
± indicates the s.e. of the mean for n = 2.
* OM, organic matter; CP, crude protein; EE, ether extract; NDF, neutral detergent fibre; ADF, acid detergent fibre.
† Mean particle size: theoretical sieve size that would retain 50% of the particles.
Rumen sampling
Rumen contents were sampled in two non-consecutive days (days 33 and 35 of each period), before the morning feeding and 4 and 8 h later. On each sampling, 200 ml were collected from the rumen of each animal using a customized vacuum device connected to a 6-mm i.d. semi-rigid tube with 2-mm pores. Rumen fluid was strained through a 1-mm mesh stainless steel sieve, and pH was immediately measured using a portable pH-meter (model 507, CRISON Instruments S.A., Barcelona, Spain). Subsamples (0·3 ml) of the filtered rumen fluid were transferred to Eppendorf tubes, weighed and immediately frozen in liquid nitrogen and stored at −80 °C until further molecular analysis. Three 4-ml subsamples were pipetted to tubes containing 1 ml of a solution made up of 20 ml/l of ortophosphoric acid and 2 ml/l of 4-methylvaleric acid, 4 ml of HCl 0·2 m or 1 ml of HCl 0·2 m, which were stored at −20 °C until further analyses of VFAs, ammonia and total lactic acid concentrations, respectively. Daily offer and refusals of the concentrates and straw at each sampling time were also recorded during the sampling days to determine the intake pattern.
Chemical analyses, particle size distribution and in vitro gas production of feeds
The composited samples of compound feeds and straw were ground in a hammer mill fitted with a 1-mm pore size screen and analysed for DM by drying at 105 °C for 24 h and for OM by ashing at 550 °C for 8 h. The CP and ether extract (EE) contents were determined using a 2300 Kjeltec Analyser Unit (Foss Tecator AB, Höganäs, Sweden) and an Ankom XT15 Extraction System (Ankom Technology, NY, USA), respectively, following the manufacturer's instructions. The NDF was analysed using an Ankom 200 Fibre Analyser (Ankom Technology) as described by Mertens (Reference Mertens2002) using α-amylase but not sodium sulphite, and the result is expressed exclusive of residual ashes. The ADF and lignin were determined as described by AOAC (2005) and Robertson & Van Soest (Reference Robertson, Van Soest, James and Theander1981), respectively. Starch content of the concentrates was determined by the optical polarimetric method proposed by the European Commission (2009). All analyses were carried out in duplicate.
The determination of the particle size distribution of concentrates was carried out by dry-sieving 300 g of the period-pooled samples, in triplicate. Each sample was placed on a sieve shaker provided with 2·40, 1·20, 0·60, 0·30 and 0·15 mm pore sizes sieves, shaken horizontally for 40 min and the residual DM on each one was determined. Mean particle size of feeds, considered as the theoretical sieve size that would retain 50% of the particles, was estimated by fitting the percentage of cumulative DM oversized from each sieve to the exponential model proposed by Pond et al. (Reference Pond, Tolley, Ellis, Matis and Kennedy1984).
The fermentation rates of the compound feeds were characterized in vitro, applying the gas production technique of Theodorou et al. (Reference Theodorou, Williams, Dhanoa, McAllan and France1994), without adding microminerals and resazurin, and with cysteine hydrochloride as the reducing agent (Mould et al. Reference Mould, Kliem, Morgan and Mauricio2005), in two consecutive 24 h incubation series. Two bottles per substrate (500 mg of the two pooled concentrate samples, ground to 1 mm) were filled with 72 ml of incubation medium and 8 ml of strained rumen inoculum collected from two cattle receiving a high concentrate diet, plus three bottles without substrate as blanks, were incubated at 39 °C in a water bath, shaking occasionally. The internal pressure of bottles was recorded after 2, 4, 6, 8, 10, 12, 16 and 24 h incubation using a HD2124·2 manometer with a TP704 pressure gauge (Delta OHM, Caselle di Selvazano, Italy) and converted into volume using a pre-fixed linear regression equation (n = 103; r = 0·996). The gas volume for each incubation time was expressed per gram of incubated OM. Cumulative gas production was fitted to the simple exponential model from Ørskov & McDonald (Reference Ørskov and McDonald1979), modified as: Y = A (1− exp−kt); where Y (ml) is the gas volume at time t (h) of incubation, A (ml) is the potential gas production and k (/h) is the rate at which the gas is produced.
Rumen fluid metabolites and quantitative polymerase chain reaction analyses
The concentration of ammonia in rumen samples was determined colorimetrically following the method described by Chaney & Marbach (Reference Chaney and Marbach1962). The VFA were determined by gas chromatography in an Agilent 6890 apparatus (Agilent Technologies España S.L., Madrid, Spain) fitted with a capillary column (ref. HP-FFAP polyethylene glycol TPA-treated, 30 m × 530 µm i.d. × 1 µm film thickness). Total lactic acid concentration was measured using the colorimetric method proposed by Barker & Summerson (Reference Barker and Summerson1941), in samples from 0 and 8 h, since no differences between 4 and 8 h were detected in a previous experiment (Gimeno et al. Reference Gimeno, Al Alami, Abecia, de Vega, Fondevila and Castrillo2015). All rumen fluid analyses were performed in duplicate.
Following the same criteria, only rumen samples collected at 0 and 8 h after feeding in the first day of sampling of each experimental period were chosen for quantitative polymerase chain reaction (PCR) analyses. The 16S rDNA gene copy number of total rumen bacteria was determined using the primers proposed by Maeda et al. (Reference Maeda, Fujimoto, Haruki, Maeda, Kokeguchi, Petelin, Arai, Tanimoto, Nishimura and Takashiba2003). The quantification of S. ruminantium and S. bovis was done using the primers proposed by Stevenson & Weimer (Reference Stevenson and Weimer2007). Extraction of DNA from samples was performed using the QIAamp DNA Stool Mini Kit (Qiagen Ltd., West Sussex, UK) according to the manufacturer's instructions, except that the first lysis incubation was carried out at 95 °C instead of 70 °C. The concentration and purity of the extracted DNA were verified using a NanoDrop ND-1000 Spectrophotometer (NanoDrop Technologies, Inc., Wilmington, DE, USA) to ensure a DNA concentration higher than 15 ng/μl and a purity ratio close to 2·0 in all samples. The DNA samples were used as templates to quantify the copy number of 16S rDNA gene by quantitative PCR using an iQ2 two-colour real-time PCR detection system (BioRad Laboratories Inc., Hercules, CA, USA). Two microliters of extracted DNA were added to the amplification reactions (25 µl) containing 0·2 µl of each primer (50 µm) (Biolegio BV, Nijmegen, The Netherlands) and 12·5 µl of iQ SYBR Green Supermix (BioRad Laboratories, Inc.). Two replicates of each extract were used, and a negative control was loaded on each plate to screen for possible contamination or dimer formation. Cycling conditions were: one cycle of 95 °C for 5 min; 40 cycles of 95 °C for 15 s, 60 °C for 30 s and 72 °C for 55 s; and one cycle of 95 °C for 1 min and 75 °C for 1 min. The threshold cycle (C t) of each sample was determined during the exponential phase of amplification. In case of total rumen bacteria, sets of 10-fold dilutions of standards with known concentration of gene copies (2·5 × 1011 copies/ml) were prepared according to the procedure described by Abecia et al. (Reference Abecia, Toral, Martín-García, Martínez, Tomkins, Molina-Alcaide, Newbold and Yáñez-Ruiz2012) and included in triplicate on each plate. The quantification of S. ruminantium and S. bovis was expressed relative to total bacteria according to the equation proposed by Denman & McSweeney (Reference Denman, McSweeny, Makkar and McSweeny2005). Results of absolute quantification were normalized per gram of rumen fluid and transformed to a logarithmic basis before statistical analysis.
Statistical analyses
All statistical analyses were conducted using the SAS statistical package (SAS 2008). Data from rumen fermentation variables, PCR analyses and feed intake pattern were analysed by ANOVA using the mixed procedure (PROC MIXED). The effects of the two dietary factors and either sampling time or after-feeding interval in case of feed intake data, were analysed considering the mean value of the two sampling days of each period as the experimental unit, except for PCR data, where only samples of the first sampling day were analysed. The type of cereal (CER), its processing form (PRO) and the sampling time were considered as fixed effects, whereas animal nested to CER and animal × period nested to (CER × PRO) were considered as random. The effect of CER was tested using the mean square of the animal nested to CER as the error term (6 degrees of freedom (d.f.)); the effects of PRO and CER × PRO were analysed using the animal × period nested to (CER × PRO) as the error term (4 d.f.); and the effects of sampling time and all its possible interactions were compared with the residual error (24 d.f.). When adequate, the same model was utilized to analyse the changes in rumen variables from 0 to 4 h and from 4 to 8 h after feeding. The main effect of time and its interactions were removed from the model to analyse the daily feed intake data. In all analyses, the Kenward–Roger's method was used for the calculation of the d.f.. Bonferroni's correction was used for pre-planned comparisons between means of the studied factors. A chi-square test was performed on individual data of pH and total VFA to analyse the effects of experimental treatments on the proportion of observations with pH below 5·6 and VFA concentration above 150 mm/l. Differences between treatments were considered significant if P ⩽ 0·05 and as a trend to significance when 0·05 < P ⩽ 0·10.
RESULTS
The animals showed an average daily gain of 1·51 ± 0·036 kg/day throughout the experimental period, and finished the experiment with a final BW of 387 ± 7·1 kg. On average, the concentrates formulated with maize as the main cereal showed higher starch content (454 ± 4·5 v. 430 ± 5·1 g/kg DM), ADF (83·2 ± 2·18 v. 73·4 ± 0·73 g/kg DM) and lignin (16·3 ± 0·54 v. 12·2 ± 0·35 g/kg DM), and lower content in NDF (161 ± 3·5 v. 187 ± 1·1 g/kg DM), than B (Table 2). Larger mean particle sizes in the concentrates were observed when dry-rolling was compared with grinding (on average, 1·16 v. 0·92 mm), mainly due to a higher proportion of particles over 2·40 mm (213 ± 16·1 v. 120 ± 9·1 g/kg DM). A higher potential in vitro gas production was observed with M compared with B concentrates (293 ± 2·2 v. 272 ± 1·3 ml/g OM, P < 0·001), whereas the barley-based concentrates showed a higher fractional gas production rate (0·093 ± 0·0007 v. 0·079 ± 0·0014/h, P < 0·001). The processing method did not significantly affect the potential gas production, but MR promoted a higher fractional rate than MG (0·082 v. 0·077; P < 0·01).
Feed intake
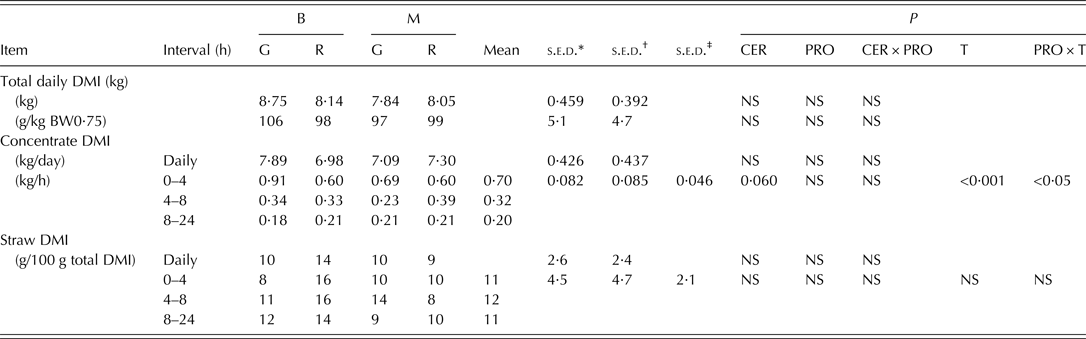
Throughout the two control weeks, daily concentrate intake for BG, BR, MG and MR averaged 7·27 ± 0·705, 6·82 ± 0·833, 6·57 ± 0·545 and 6·36 ± 0·319 kg DM and that of straw was 0·10 ± 0·049, 0·12 ± 0·042, 0·08 ± 0·028 and 0·09 ± 0·009 of total DM intake (DMI), respectively. The daily intake of concentrate and straw during rumen sampling days (on average, 7·31 kg DM and 0·11 of total DMI, respectively) agreed with those figures, and accordingly were not affected by the experimental treatments (Table 3). The highest rate of concentrate intake was observed during the first 4 h after feeding, in which animals consumed on average 0·38 of total daily intake. The concentrate intake during this first interval was significantly lower in animals receiving R cereals compared with G (0·597 v. 0·800 kg/h, P < 0·05), differences that were more evident within diet B.
Effect of the majority cereal in the concentrate (CER), its processing (PRO) and post-feeding interval time (T) on daily feed dry matter intake (DMI) and intake patterns of concentrate and straw of 282–387 kg Holstein calves fed concentrates formulated with a 600 g/kg mixture of barley and maize in proportions 75:25 (B) or 25:75 (M) and subjected to grinding (G) or dry-rolling (R) on rumen sampling days.
d.f., degrees of freedom; NS, not significant.
Interactions CER × T and CER × PRO × T were not significant in any studied variable. 1 d.f. for CER, PRO and CER × PRO, and 2 d.f. for T, CER × T, PRO × T and CER × PRO × T.
*, †, ‡s.e. of the difference between cereals within presentations and sampling times; between presentations within cereals and sampling times; and between sampling times, respectively.
Rumen environment
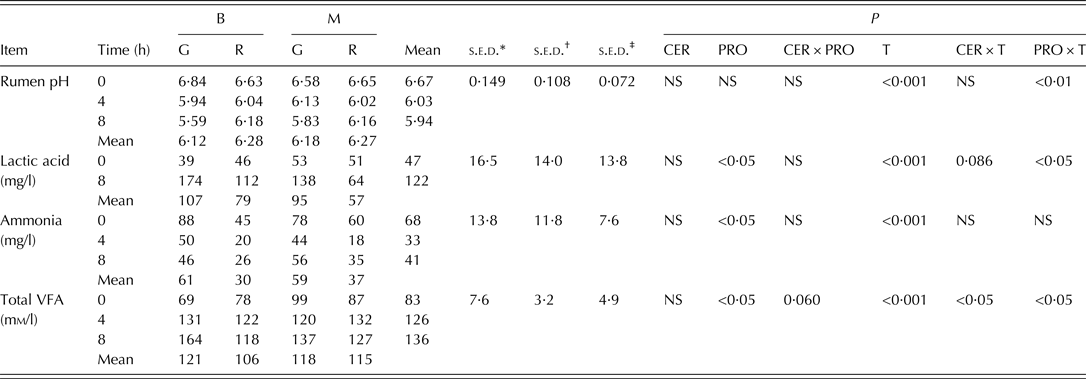
The pattern of ruminal fermentation metabolites from 0 to 8 h after feeding (Table 4) was scarcely affected by the main cereal used to formulate the concentrates, decreasing (P < 0·001) the pH and ammonia concentration from 0 to 4 h and increasing (P < 0·001) the total VFA and lactic acid concentrations from 0 to 4 h and 0 to 8 h, respectively. At all sampling times, animals receiving G cereals showed higher ammonia concentrations than those fed R (mean daily concentrations of 60·2 v. 33·9 mg/l, P < 0·05). In case of rumen pH, lactic acid and total VFA, no differences due to the processing method were observed before feeding or 4 h later; however, dry-rolled cereals resulted in higher rumen pH (6·17 v. 5·71, P < 0·01) and lower lactic acid concentration (88·1 v. 156 mg/l, P < 0·01) at 8 h after feeding. Total VFA concentration at 8 h was also lower with BR than BG (P < 0·01), but it did not differ in M diets. The proportion of pH records below 5·6 was lower for R compared with G (0·00 v. 0·25 of total records in animals receiving high barley diets, P < 0·05; and 0·00 v. 0·13 in those fed M diets, P = 0·074). Similarly, the proportion of individual VFA observations above 150 mm/l was significantly lower for BR compared with BG (0·05 v. 0·29 of total cases, P < 0·05) but not for MR compared with MG (0·08 v. 0·13, P > 0·10).
Effect of the majority cereal in the concentrate (CER), its processing (PRO) and time of sampling (T) on rumen pH and lactic acid, ammonia and total volatile fatty acid (VFA) concentrations in rumen liquor of 282–387 kg Holstein calves fed concentrates formulated with a 600 g/kg mixture of barley and maize in proportions 75:25 (B) or 25:75 (M) and subjected to grinding (G) or dry-rolling (R).
d.f., degrees of freedom; NS, not significant.
Interaction CER × PRO × T was only significant for total VFA (P < 0·05). 1 d.f. for CER, PRO and CER × PRO, and 2 d.f. (except in case of lactic acid in which was also 1 d.f.) for T, CER × T, PRO × T and CER × PRO × T.
*, †, ‡s.e. of the difference between cereals within presentations; between presentations within cereals; and between sampling times, respectively.
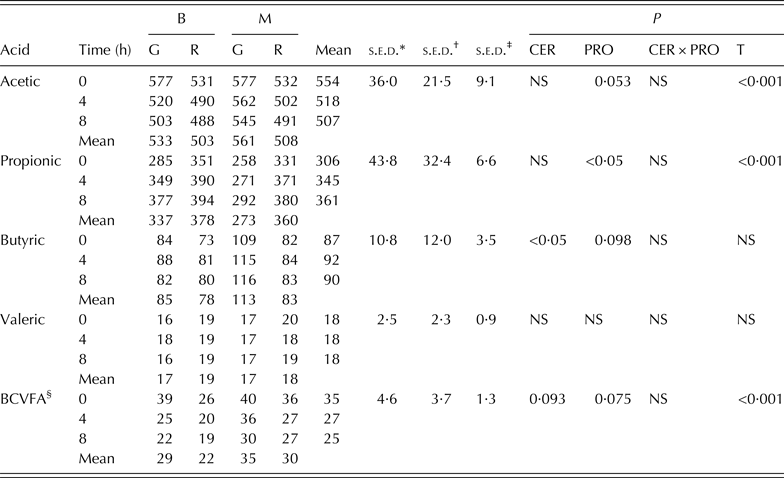
Regarding the molar proportions of the main VFA (Table 5), a decrease in the acetic acid proportion and an increase on that of propionic acid was observed during the first 4 h (P < 0·001), resulting in a significant decrease of the acetic to propionic (A:P) ratio from 1·81 to 1·50 (P < 0·001). A decrease in the branched-chain VFA concentration was also observed in the first hours after feeding (P < 0·001). Concentrates richer in maize tended to promote higher mean daily concentrations of butyric acid (98·2 v. 81·3 mm/m, P < 0·05) and branched-chain VFA (32·6 v. 25·1 mm/m, P = 0·093) than those based on barley. Concerning the processing method, G tended to promote higher A:P ratios than R at all sampling times (1·95 v. 1·45, P = 0·052) due to their higher (P = 0·053) and lower (P < 0·05) proportions of acetic and propionic acids, respectively.
Effect of the majority cereal in the concentrate (CER), its processing (PRO) and time of sampling (T) on molar proportions (mm/m) of main volatile fatty acids in rumen liquor of 282–387 kg Holstein calves fed concentrates formulated with a 600 g/kg mixture of barley and maize in proportions 75:25 (B) or 25:75 (M) and subjected to grinding (G) or dry-rolling (R).
d.f., degrees of freedom; NS, not significant.
Interactions CER × T and PRO × T were not significant for any studied variable. Interaction CER × PRO × T was only significant for propionic acid and BCVFA (P = 0·085). 1 d.f. for CER, PRO and CER × PRO, and 2 d.f. for T, CER × T, PRO × T and CER × PRO × T.
*, †, ‡s.e. of the difference for comparisons between cereals within presentations; between presentations within cereals; and between sampling times, respectively.
§ Branched-chain volatile fatty acids.
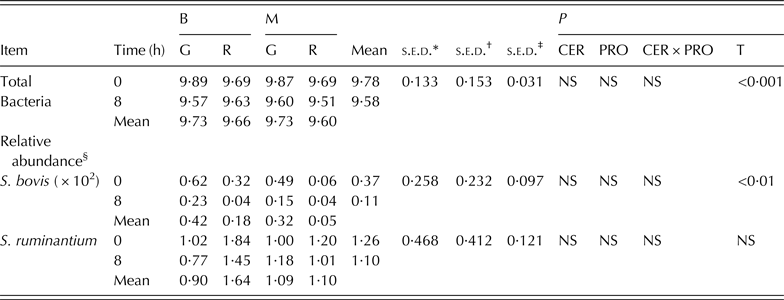
Results of rumen bacterial quantification are shown in Table 6. The logarithmic expression of the number of copies of the 16S rDNA gene per gram of rumen liquor decreased from 0 to 8 h after feeding (P < 0·001), as well as the concentrations of S. bovis (P < 0·01). Dietary factors did not affect total rumen bacteria and differences in the relative abundance of S. ruminantium and S. bovis were not detected, which averaged 1·18 and 0·002% of total bacteria, respectively.
Effect of the majority cereal in the concentrate (CER), its processing (PRO) and time of sampling (T) on total rumen bacteria (Log10 16S rDNA copy number/g fresh matter) and relative abundance of S. bovis and S. ruminantium in rumen liquor of 282–387 kg Holstein calves fed concentrates formulated with a 600 g/kg mixture of barley and maize in proportions 75:25 (B) or 25:75 (M) and subjected to grinding (G) or dry-rolling (R).
d.f., degrees of freedom; NS, not significant.
Interactions CER × T, PRO × T and CER × PRO × T were not significant in any studied variable. 1 d.f. for CER, PRO, CER × PRO, T, CER × T, PRO × T and CER × PRO × T.
*, †, ‡s.e. of the difference for comparisons between cereals within presentations; between presentations within cereals; and between sampling times, respectively.
§ Calculated as explained in ‘Materials and methods’.
DISCUSSION
According to the starch content of the feed ingredients (de Blas et al. Reference De Blas, Mateos and García-Rebollar2010), approximately 0·72 and 0·20 of total starch would have been provided from maize and barley in diet M, and 0·25 and 0·64 in diet B, respectively. The contribution of other feed ingredients to total starch, included to match diet composition, was of minor importance. Dietary differences in the in vitro fermentation pattern, showing a higher potential gas production but a lower fractional gas production rate of M compared with B concentrate, can be attributed to the higher starch content of maize and its higher resistance to microbial digestion because of the protein matrix of the starchy endosperm (McAllister et al. Reference McAllister, Phillippe, Rode and Cheng1993). Differences in chemical composition and gas production kinetics as a result of the processing method were small since heat, moisture or pressure were not applied during dry-rolling and therefore no chemical alterations by gelatinization can be expected (Dehghan-banadaky et al. Reference Dehghan-banadaky, Corbett and Oba2007).
None of the animals was at risk of acute acidosis, since no rumen pH values below 5·0 or lactic acid concentrations above 50 mm/l were recorded (Nagaraja & Titgemeyer Reference Nagaraja and Titgemeyer2007); however, several values indicative of SARA were observed, mainly in animals fed ground cereals 8 h after the morning feed. However, in comparison with the previous experiment using animals fed the same diets from 150 to 250 kg BW (Gimeno et al. Reference Gimeno, Al Alami, Abecia, de Vega, Fondevila and Castrillo2015), the proportion of pH observations indicative of SARA was lower (0·097 v. 0·378) and the mean pH higher (6·21 v. 5·93) in the current experiment with older calves, despite the higher concentrate intake recorded here (7·32 v. 5·87 kg DM). This could be due to an increased rumen buffer capacity as animals grow and an associated adaptation of the rumen and its microbiota to a high-grain diet, which would result in lower susceptibility to acidosis (Nagaraja & Titgemeyer Reference Nagaraja and Titgemeyer2007). Besides, the higher proportion of straw consumed during the current experiment (10·7 v. 7·01 g/100 g of total DMI) would increase chewing and ruminating activities and saliva production, thus improving rumen buffer capacity (González et al. Reference González, Manteca, Calsamiglia, Schwartzkopf-Genswein and Ferret2012).
Effect of cereal type and its processing on rumen fermentation and feed intake pattern
No differences on rumen fermentation variables were manifested by the main cereal included in the concentrate, except for a greater molar proportion of butyric acid in animals fed maize-based diets (P < 0·05). This is consistent with the in vitro study carried out by Cone & Becker (Reference Cone and Becker2012), in which cereals that were fermented faster resulted in lower values of butyric acid at all incubation times. The inclusion of a combination of two cereals as sources of starch instead of a single one may be partly responsible for the small effect of type of cereal on the variables studied.
Cereal processing had a major impact on rumen fermentation. The pattern of rumen fermentation through the day was more stable with dry-rolled compared with ground cereals. Thus, pH values and total VFA concentration stabilized from 4 to 8 h after feeding in animals fed R, whereas it continued changing in those fed G; moreover, the increase of lactic acid concentration from 0 to 8 h after feeding was also higher with ground cereals. The A:P ratio reached values consistent with those recorded by others in cattle fed high-grain diets (Devant et al. Reference Devant, Ferret, Gasa, Calsamiglia and Casals2000; Castrillo et al. Reference Castrillo, Mota, Van Laar, Martin-Tereso, Gimeno, Fondevila and Guada2013). A decrease in this ratio is a common finding when high-grain diets are fed, due to an increased rumen fermentation that, combined with a reduction of rumen pH, changes the VFA profile towards more propionate and less acetate (Russell Reference Russell1998; Calsamiglia et al. Reference Calsamiglia, Blanch, Ferret and Moya2012). Surprisingly, feeding the R cereals resulted in a trend to a lower ratio (P = 0·052) compared with G.
These results might be partly due to the more homogeneous pattern of concentrate intake promoted by dry-rolled compared with ground cereals, characterized by a 25% lower intake with R during the first 4 h after feeding, since both high levels (Nagaraja & Titgemeyer Reference Nagaraja and Titgemeyer2007) and high rates of concentrate intake (González et al. Reference González, Manteca, Calsamiglia, Schwartzkopf-Genswein and Ferret2012) are main causes of rumen acidosis. This regulation of concentrate intake could be related to the larger particle size of rolled cereals that would require more time for chewing, decreasing the eating rate and promoting a higher saliva secretion. More difficult access for bacterial enzymes to the starch contained in the dry-rolled cereals, with a lower proportion of fine particles than the ground cereals (Dehghan-banadaky et al. Reference Dehghan-banadaky, Corbett and Oba2007) and a greater integrity of the endosperm protein matrix and fibrous pericarp (Offner et al. Reference Offner, Bach and Sauvant2003) that slow down its fermentation rate, may have also contributed to a more favourable environment for fermentation. In any case, these results correspond to cereals ground at 3·5 mm pore size sieve, commonly used in practical feeding situations; obviously, different results might be obtained with a different particle size since such processing affects rumen kinetics.
From the obtained results, it is apparent that the effect of processing on ruminal fermentation metabolites was in general quantitatively more evident in animals fed high-barley than high-maize concentrates. Further, the number of individual observations indicative of SARA was also more affected by the method of processing when barley was the main cereal. Theoretically, as reviewed by Offner et al. (Reference Offner, Bach and Sauvant2003), a larger impact of processing would be expected in maize, which starch is bound to insoluble protein (Owens et al. Reference Owens, Secrist, Hill and Gill1997), than in barley that has a rapidly fermentable starch regardless its processing form. This apparent contradiction with our results may be explained by the 13% higher daily concentrate intake and the 45% lower straw intake observed in animals receiving BG in comparison with BR, both facts contributing to a higher acidogenic potential of this diet. In contrast, minor differences in concentrate and straw intake were observed between dry-rolled and ground maize concentrates.
Effect of dietary factors on the rumen microbiota
In general, dietary factors scarcely affected the total rumen bacteria concentration and the proportion of bacterial species chosen as target microorganisms involved in lactic acid metabolism. The mean concentration of total rumen bacteria (4·78 × 109 16S rDNA gene copies/g fresh matter or 7·49 × 105 copies/ng DNA) was similar to those described by Chen et al. (Reference Chen, Oba and Guan2012) and Wallace et al. (Reference Wallace, Rooke, Duthie, Hyslop, Ross, McKain, De Souza, Snelling, Waterhouse and Roehe2014) in beef cattle fed high-concentrate diets. The decrease of total rumen bacterial concentration from 0 to 8 h after feeding could be due to the ingestion of feed and water during this interval, which would result in a dilution of rumen contents and therefore of microbiota (Leedle et al. Reference Leedle, Bryant and Hespell1982).
Significant changes in the rumen bacterial population structure have been reported as calves are fed increasing amounts of concentrate during the adaptation to high-grain diets (Fernando et al. Reference Fernando, Purvis, Najar, Sukharnikov, Krehbiel, Nagaraja, Roe and Desilva2010; Mao et al. Reference Mao, Zhang, Wang and Zhu2013), although recent studies demonstrate that the core rumen microbiome is rather stable across a range of diets and even during an acidotic event (Petri et al. Reference Petri, Schwaiger, Penner, Beauchemin, Forster, McKinnon and McAllister2013). This may explain why the concentrations of S. ruminantium and S. bovis were not affected by the experimental diets, which were very similar in terms of concentrate to forage ratio and starch content, coupled with the fact that the animals were previously long-term, well-adapted to high-grain feeding. Besides, other microorganisms might play an important role in the acidosis development, such as Megasphaera elsdenii (Henning et al. Reference Henning, Horn, Leeuw, Meissner and Hagg2010) or Lactobacillus spp. (Nagaraja & Titgemeyer Reference Nagaraja and Titgemeyer2007), but they were not analysed in the current study.
The low relative abundance of S. bovis observed is consistent with the experiment of Khafipour et al. (Reference Khafipour, Li, Plaizier and Krause2009), in which rumen pH conditions typical of SARA were promoted by alfalfa pellets. Accordingly, Nagaraja & Titgemeyer (Reference Nagaraja and Titgemeyer2007) concluded that once the animal is adapted to high-grain feeding the proportion of S. bovis decreases and is similar to that of forage-fed cattle. In any case, cereal grinding promoted numerically, though not significant, greater abundances of S. bovis at all sampling times compared with dry-rolling (on average 0·0037 v. 0·0011% of total bacteria), which may be related to a higher starch availability in ground cereals.
CONCLUSION
Overall, no relevant effects on rumen fermentation or on feed intake pattern were promoted by providing either maize- or barley-based concentrates. However, dry-rolling of cereals resulted in a lower intake of concentrate during the first 4 h after feed offering, accompanied by less acid rumen fermentation after 8 h, compared with grinding. The minor impact of dietary factors on the target rumen bacterial species chosen to study the lactic acid metabolism may be due to combined effects of the high similarity between diets, the previous adaptation of animals to high-grain feeding and the stability of the core rumen microbiome. These results suggest that the use of dry-rolled cereals in the late fattening feeding period of beef cattle would promote a more favourable rumen fermentation compared with 3·5 mm ground cereals, and thus this practice could be helpful to reduce the risk of appearance of SARA by slowing the intake of concentrate and/or its fermentation rate.
The present work was funded by the Spanish Ministry for Science and Innovation (MICINN; project AGL2009-12026), with the participation of the Department of Industry and Innovation of the Government of Aragón, and the European Social Fund. Mr. A. Gimeno was granted by the FPI from the MICINN and Dr A. Al Alami was awarded a fellowship of the Spanish Agency for International Cooperation and Development. The authors thank Belén Hernando, Jesús Artajona and Elisabeth Jiménez for their valuable help in the laboratory analyses and Dr Llorenç Badiella from the Servei d'Estadística Aplicada of the Universitat Autònoma de Barcelona for his valuable help in the statistical analysis of results.