The release of CO2 and other greenhouse gases due to human activities has contributed to increased atmospheric temperature and subsequent climate change (Chevallier et al., Reference Chevallier, Crotwell, Gerbig, Jordan, Lan and Loh2023). To limit CO2 release into the atmosphere, various strategies are being studied. Great efforts are being devoted to developing CO2 capture and storage (CCS) technologies (Bui et al., Reference Bui, Adjiman, Bardow, Anthony, Boston and Brown2018). In addition to CCS, CO2 capture and utilization (CCU) is also being considered. The possibility of using CO2 released from one industrial process to generate new chemicals in another process fits well within the circular economy principle. Thus, CCU technology development is also an attractive strategy in the efforts to limit CO2 emissions. For example, CO2 can be used to produce methane in a heterogeneous catalytic process called methanation or the Sabatier reaction. Methane can then be used further as a fuel or as a feedstock for the production of chemicals. The Sabatier reaction requires moderate temperature and pressure conditions (<400°C, 1 bar), and CO2 conversion is achieved with a presence of a catalyst (Vogt et al., Reference Vogt, Monai, Kramer and Weckhuysen2019). Recently, integrated CCU technologies have been proposed, where CO2 is captured and then converted in a single fixed-bed reactor under isothermal conditions (Omodolor et al., Reference Omodolor, Otor, Andonegui, Allen and Alba-Rubio2020). Such systems are more economically viable than using two separate units because they reduce the energy required for sorbent regeneration, CO2 storage and transport. In such systems, a dual-functional material (DFM) can be used. DFMs exhibit at the same time a considerable CO2 capture capacity and favourable catalytic properties for CO2 conversion. DFMs combine together a catalyst that is sufficiently efficient for CO2 conversion and a supporting material that exhibits relatively high CO2 capture capacity.
In the literature, layered double hydroxide (LDH)-derived mixed oxides and MgO are reported as CO2 sorbents at intermediate temperatures (200–400°C) such as those corresponding to the Sabatier reaction (Wang et al., Reference Wang, Huang, Yang, Zhang, Wu and Gao2014). Although clay minerals have been investigated as sorbents of CO2 at low temperatures (<200°C), their CO2 adsorption capacity has not yet been assessed at intermediate temperatures. Indeed, most CO2 sorbents that are efficient at low temperatures lose their stability upon heating (e.g. amines and metal–organic frameworks). Tri-octahedral (Mg-rich) clay minerals remain stable at an intermediate temperature range, and thus their CO2 adsorption capacity should be evaluated and compared to those of LDHs. The abundance and low cost of clay minerals make them an attractive CO2 sorbents for industry even if their CO2 adsorption capacity is lower than those of other sorbents. This study investigated CO2 adsorption on Laponite, a tri-octahedral commercial clay with a high surface area (Christidis et al., Reference Christidis, Aldana, Chryssikos, Gionis, Kalo and Stöter2018) at 200°C. Its CO2 adsorption is expected to decrease with increasing temperature; thus, the lowest limit (i.e. 200°C) was chosen to assess the potential of Laponite for use in such processes. The sample was modified using simple cation exchange to assess the effects of various exchangeable cations on CO2 sorption capacity.
Materials and methods
Preparation of the cation-exchanged samples
Various chloride solutions were prepared to saturate commercial hectorite Laponite RD® with various cations such as Mg2+, Ca2+, Co2+ and Ni2+. Laponite RD® (BYK-Chemie GmbH), magnesium chloride hexahydrate, MgCl2.6H2O (Sigma-Aldrich, ≥99.0 wt.%), calcium chloride dihydrate, CaCl2.2H2O (Sigma-Aldrich, ≥99.0 wt.%), nickel chloride hexahydrate, NiCl2.6H2O (Thermo Scientific, 99.3 wt.%), cobalt chloride hexahydrate, CoCl2.6H2O (Acros Organics, 98.0 wt.%) and deionized water of 18 MΩ cm–1 (Aquadem, PF 210, Veolia Water Technologies) were used. The cation-exchange process consisted of saturating the material with a highly concentrated chloride solution. Then, 2.00 g (Precision Series, Fisherbrand) of Laponite RD® was impregnated with 30 mL of 1 M chloride solution containing the exchangeable cation in a centrifuge tube. The tube was then agitated for at least 7 h before centrifugation at 8000 rpm (9946 × g) for 10 min to remove the liquid phase (Rotanta 460, Hettich Zentrifugen). This step was repeated two times. Then, the solid phase was washed with deionized water to remove the excess of chloride anions, which was verified by adding Ag+ to the supernatant (AgNO3, Fluka, 99.0 wt.%). The final product was oven-dried at 60°C for 2 days (oven ED 056, Binder).
Physicochemical characterization methods
The structural properties of the samples were investigated using X-ray diffraction (XRD) with a PANalytical MPD X’Pert Pro diffractometer (Almelo) equipped with a Pixcel real-time multiple strip detector and operating with an angular aperture of 3.347°2θ in the 2–70°2θ range, and using Cu-Kα radiation with a 0.15418 nm wavelength. XRD traces were taken at 22°C with a step size of 0.013°2θ and a time per step of 218 s, with the total time for acquisition of 1.25 h. The divergence slit, the anti-scatter slit and the two Soller slits were at 0.0625°, 0.125° and 2.3°, respectively.
The chemical composition of samples was determined using a Zetium wavelength-dispersion X-ray fluorescence (XRF) spectrometer from PANalytical (Almelo). XRF experiments were carried out on pellets composed of 0.3 g of the sample pressed at 4 tons for 2 min.
Thermogravimetric analysis (TGA) of the samples was performed using a Mettler-Toledo TGA/DSC1 LF1100 apparatus in alumina sample holders and under air, with a flow rate of 100 mL min–1 from 30°C to 1000°C and a heating rate of 10°C min–1. An empty sample holder was recorded as a reference to correct the baseline deviation.
Fourier-transform infrared (FTIR) spectroscopy measurements were conducted using an Equinox IFS 55 apparatus (Karlsruhe) equipped with a deuterated triglycine sulfate (DTGS) detector from Bruker. The samples were mixed with KBr at a weight ratio of 1:100 and pressed at 4 bar for 2 min, followed by oven-heating at 200°C. The spectrum obtained was the average of 200 scans with a resolution of 4 cm–1. The spectrum was recorded using the software OPUS, which was also used to subtract the CO2 and H2O contributions.
N2 adsorption–desorption isotherms were obtained on Micrometrics ASAP 2420 equipment at –196°C. Prior to analysis, the samples were degassed at 300°C for 15 h and then again for 2 h in the measurement emplacement. The degassing vacuum was 10–6 bar. The Brunauer–Emmett–Teller (BET) equation (0.01 < P/P 0 < 0.40) was used to calculate the specific surface area (SSA). The data were analysed using the software MicroActive 5.02.
CO2 adsorption tests
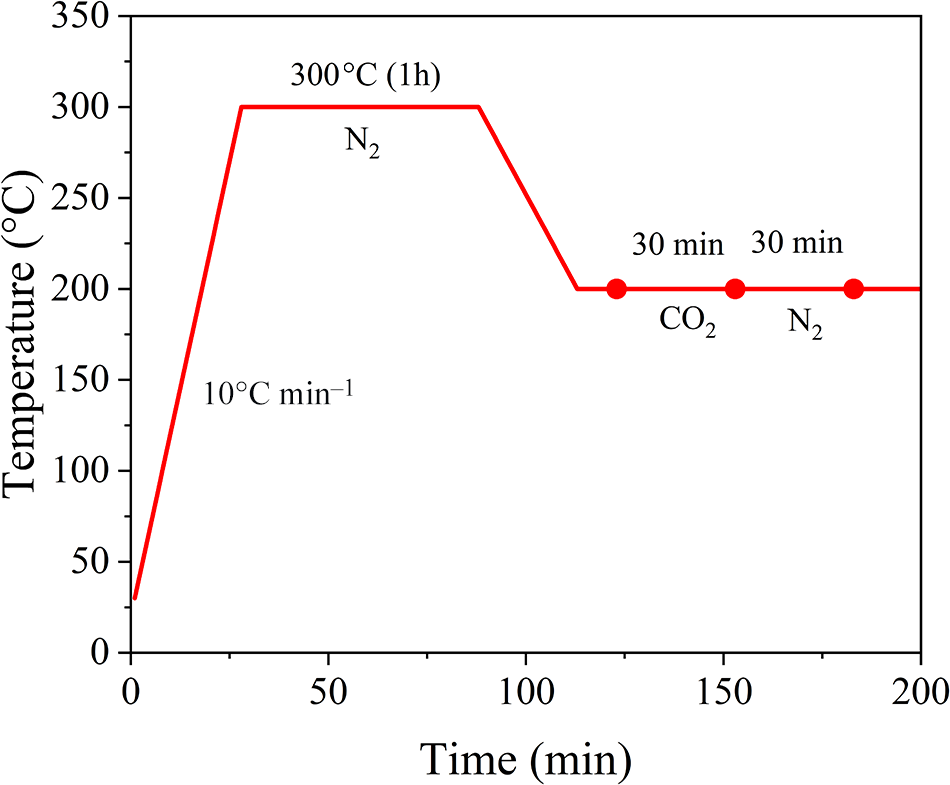
The CO2 adsorption capacity of the samples was measured using a Setaram Sensys thermogravimetry-differential scanning calorimetry (TG-DSC) apparatus. The samples (∼15 mg) were first dehydrated at 300°C under pure N2 flow (30 mL min–1), then the temperature was decreased and stabilized to the adsorption temperature (200°C), always under N2 flow. Once the mass was stabilized, the gas was switched to CO2 with a constant flow of 30 mL min–1 and maintained during the CO2 sorption experiments (30 min) until complete saturation of the samples was achieved. Finally, the gas was switched back again to N2 for 30 min (Fig. 1). The changes in mass were recorded to evaluate the CO2 adsorption capacity of the materials. The pressure of the gases during the CO2 adsorption experiments was 3 bar. The specification of the gases used in the experiment was: CO2 N45 (purity of 99.995% and impurities less than 50 ppm) provided by AirLiquid and N2 4.5 (purity ≥99.995%) provided by Linde. Each experiment was performed twice, and the variation between the experiments did not exceed 5%.
Temperature profile for CO2 adsorption and desorption at 200°C.

Results and discussion
Characterization of the exchanged materials
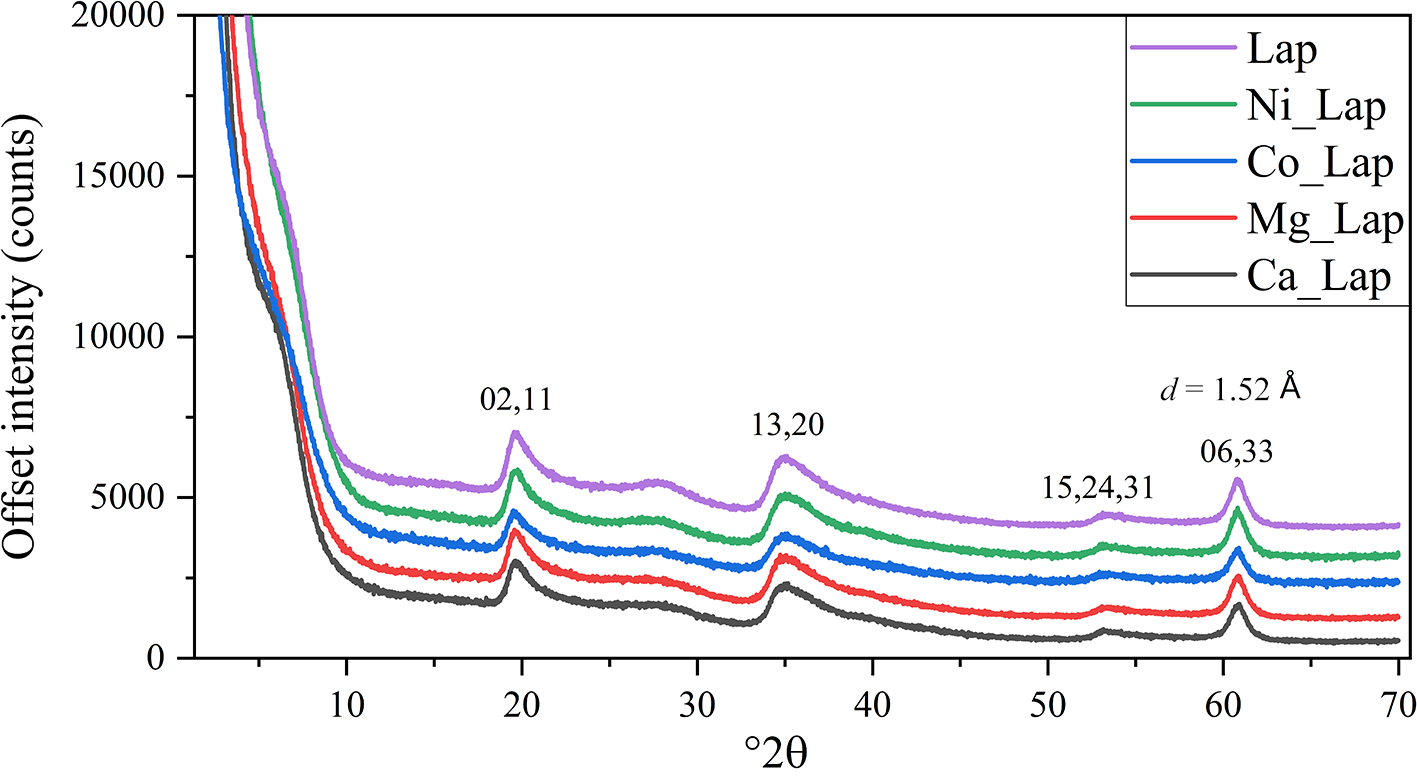
All samples displayed a similar structure, with characteristic diffraction peaks corresponding to tri-octahedral swelling clay minerals (Fig. 2; Brindley & Brown, Reference Brindley and Brown1982). The (00ℓ) reflections were almost absent, suggesting disordered stacking and/or low crystallinity. The broad peaks corresponding to (hkl) planes confirmed that all of the samples had small, coherent scattering domain sizes. The similarity in the XRD traces of Laponite RD and the exchanged samples showed that the crystal structure of the original material was not impacted by the exchange protocol. No other additional crystalline-phase precipitation occurred.
Powder XRD traces of Laponite RD® (Lap) saturated with various cations.

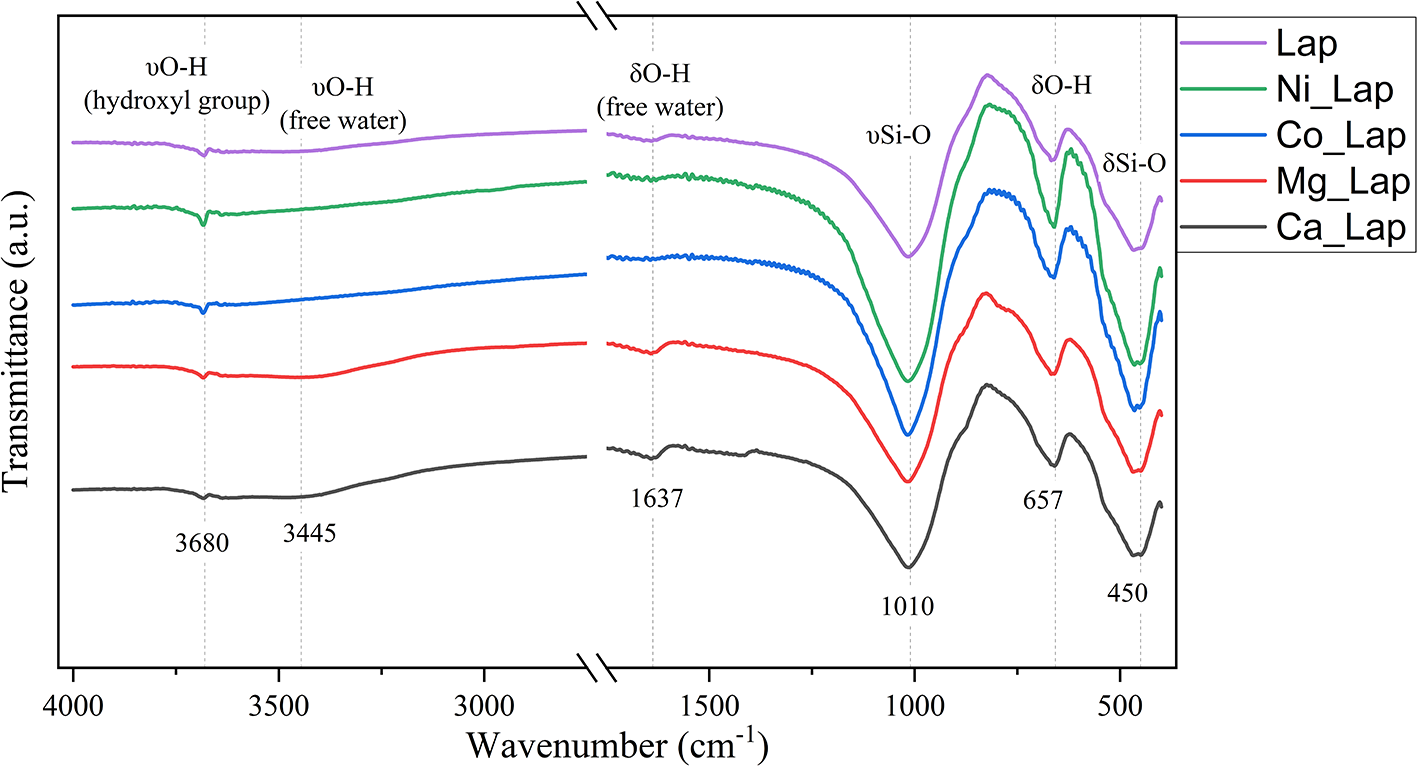
FTIR spectroscopy analysis confirmed that all of the peaks were similar between the samples, indicating that the basic structure of Laponite was not altered during the exchange process (Fig. 3). The absorption bands such as stretching of O–H at 3680 cm−l, stretching of Si–O at ∼1010 cm−l, bending of O–H at 657 cm−l and bending of Si–O at 450 cm−l could be observed, which are characteristic of hectorite (Ogawa et al., Reference Ogawa, Matsutomo and Okada2008; Yuan et al., Reference Yuan, Annabi-Bergaya, Tao, Fan, Liu and Zhu2008; Yang et al., Reference Yang, Chen, Hong, Cui and Li2022). Despite drying the pellets at 200°C before the analysis, the bands attributed to bound water at 3445 and 1637 cm–1 were still present; however, their intensity was not significant compared to other characteristic bands of the samples.
FTIR spectra of Laponite RD® (Lap) saturated with various cations.

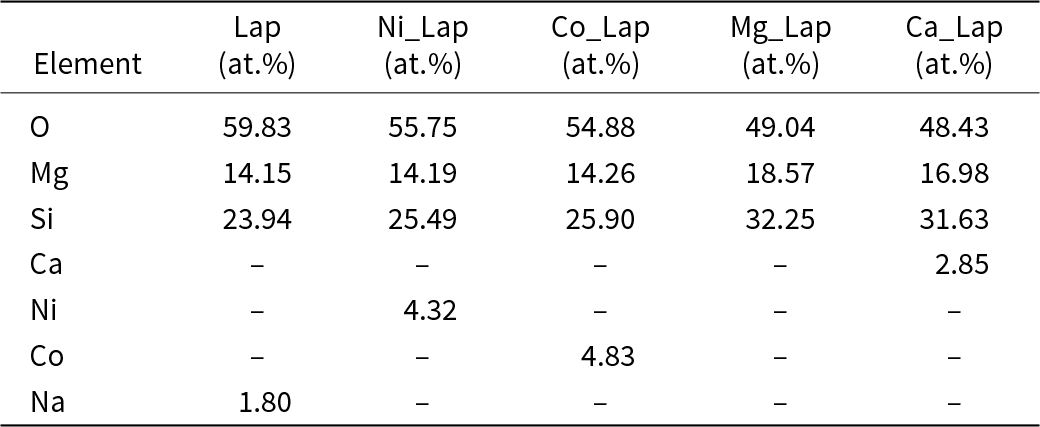
The chemical composition of the samples determined using XRF (Table 1) confirmed that the exchangeable Na+ present in Laponite RD® was replaced by Ni2+, Co2+, Mg2+ and Ca2+. No sodium was detected using XRF in the exchanged samples.
Chemical composition of Laponite RD® (Lap) saturated with various cations determined using XRF.

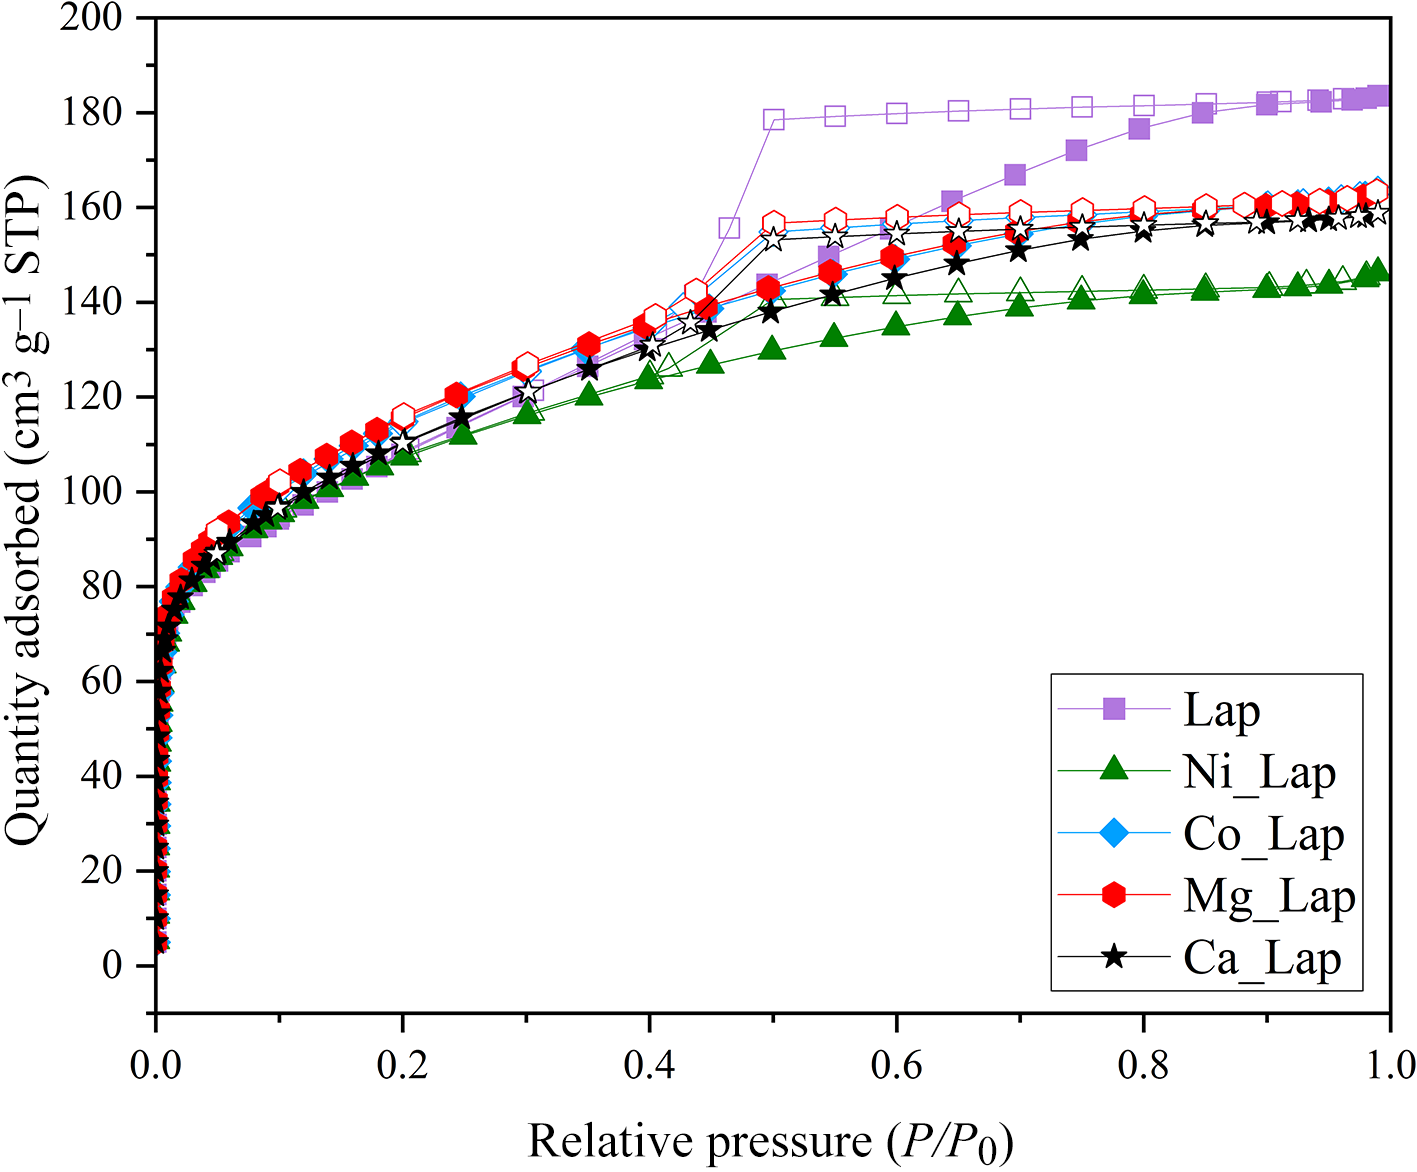
The N2 physisorption isotherms of the Laponite samples were collected to determine their SSA (Fig. 4). According to the International Union of Pure and Applied Chemistry (IUPAC) classification (Thommes et al., Reference Thommes, Kaneko, Neimark, Olivier, Rodriguez-Reinoso, Rouquerol and Sing2015), all sample isotherms were of type IVa and hysteresis loops were of type H3, indicating the presence of a mesoporous network with lamellar particles and fissure structures (Chen et al., Reference Chen, Du, Zhu and Zhou2013). The samples showed relatively high surface areas of 377–408 m2 g–1 (Table 2) compared to other common clay minerals. For Na-montmorillonite the SSA was reported to be 23 m2 g–1 (Dogan et al., Reference Dogan, Dogan, Onal, Sarikaya, Aburub and Wurster2006). Such a high surface area of Laponite (a synthetic material) compared to natural samples was due to the production process (producing smaller particle sizes and greater particle dispersion with the application of particular drying techniques). Laponite’s improved adsorption of CO2 compared to other common clay minerals could thus be expected to be due to its greater contact area with CO2 molecules. Cation exchange had an insignificant effect on the surface area of the samples.
N2 adsorption (filled symbols)/desorption (empty symbols) isotherms of Laponite RD® (Lap) saturated with various cations. STP = standard temperature and pressure.

SSA and amount of CO2 adsorbed (ads)/desorbed (des) by Laponite RD® (Lap) saturated with various cations.

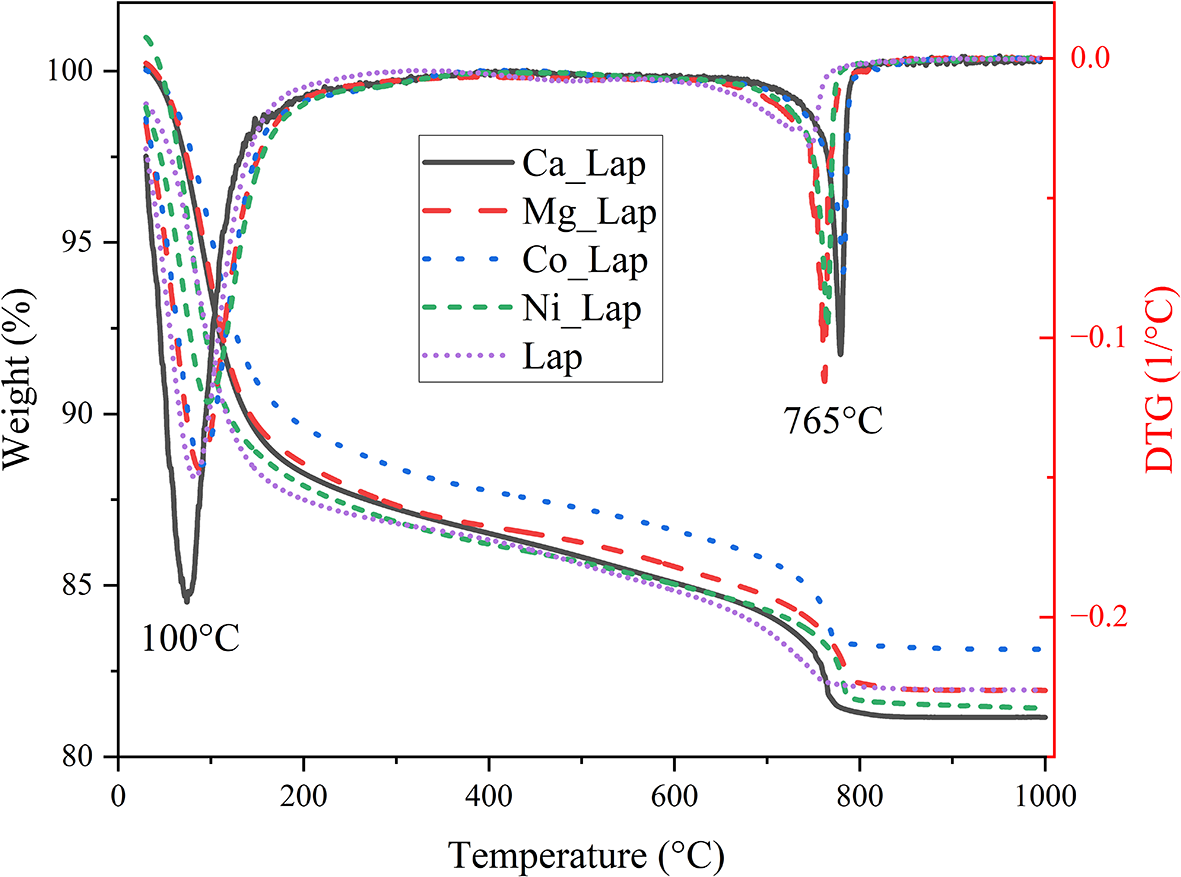
To evaluate the thermal stability of the samples, TGA was performed and the profiles recorded (Fig. 5). All samples exhibited similar profiles, with the first mass loss at ∼100°C of ∼13–14 wt.%, which was related to dehydration of the materials. The second mass loss at ∼765°C of ∼4–5 wt.% was related to dehydroxylation of the materials to form the corresponding mixed oxides (Earnest, Reference Earnest1983a, b). In general, all of the samples had a thermal stability of between 200°C and 650°C, which is desirable for their potential application as CO2 sorbents in DFMs.
TG curves and their derivatives of Laponite RD® (Lap) saturated with various cations. For all of the samples, the TG profiles are shown on the left-hand y-axis and the DTG profiles are shown on the right-hand y-axis.

CO2 adsorption tests
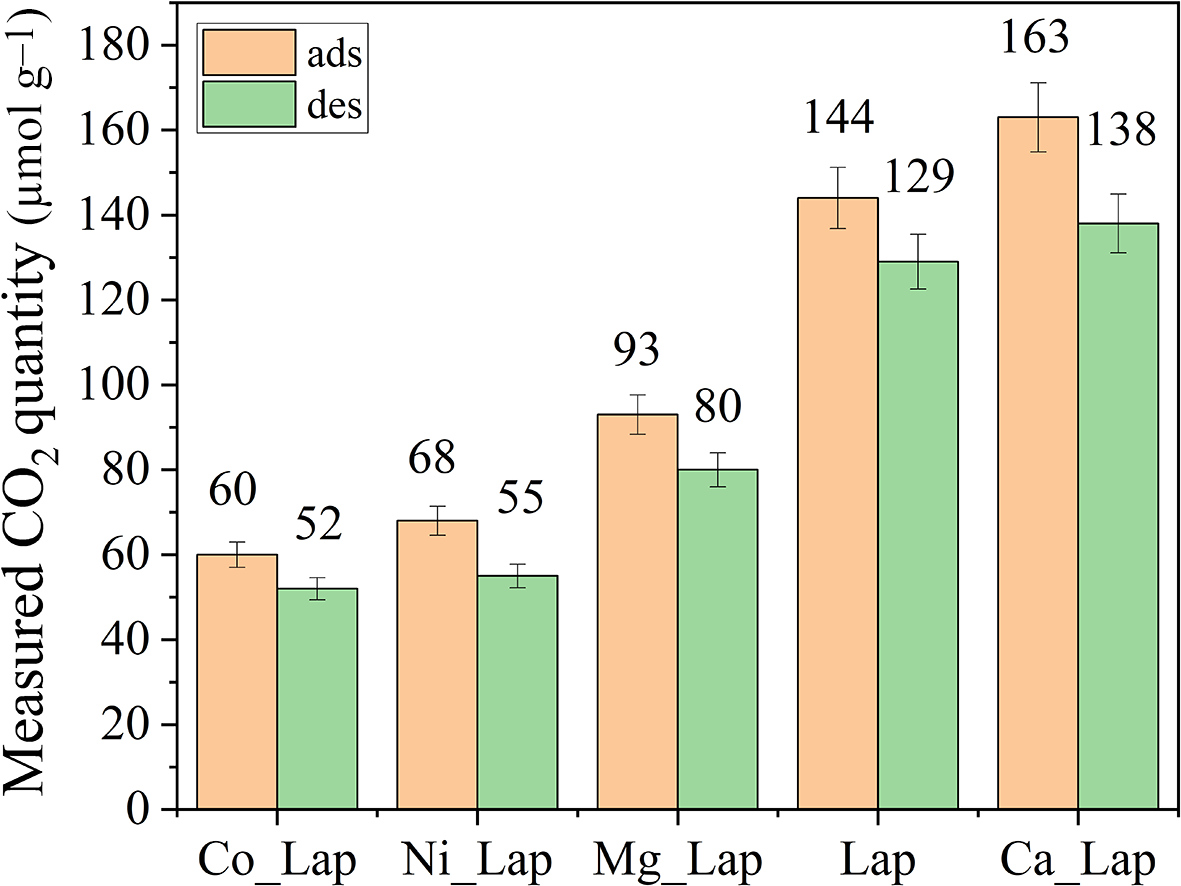
Figure 6 illustrates the amount of CO2 adsorbed and desorbed at 200°C for Laponite and cation-exchanged samples. Laponite adsorbed 144 µmol CO2 g–1. As the cations were exchanged, a significant change appeared in the CO2 adsorption capacities of the samples. The samples Co_Lap and Ni_Lap showed an adsorption capacity that was reduced to less than half (60–68 µmol CO2 g–1) of that of Laponite. Mg_Lap performed better than the previous two samples but still adsorbed less CO2 than Laponite. The only sample that surpassed Laponite was Ca_Lap, which adsorbed 163 µmol CO2 g–1 (13% greater than the value for Laponite). These results showed that, among the cations that were exchanged, Ca2+ proved to have the best affinity for CO2 molecules.
Amount of CO2 adsorbed (ads)/desorbed (des) at 200°C by Laponite RD® (Lap) saturated with various cations after a pre-treatment at 300°C under N2.

As can be seen in Table 2, the CO2 adsorption capacity was not correlated with the SSA of the samples. The Ca_Lap sample demonstrated the greatest adsorption of CO2 while it represented only an average SSA. Thus, the differences in CO2 adsorption capacities of the various materials were not due to the SSA but were influenced by the affinity of the various cations towards CO2. It must be noted that the SSA determined with N2 physisorption represented only the external surface of the material, as the N2 molecules were not able to enter the interlayer space. However, the adsorbed CO2 molecules could be potentially adsorbed not only on the external surface, but also on the interlayer surface due to the fact that CO2 molecules are much smaller in size that N2 molecules. Sample characterization using XRD and FTIR spectroscopy showed that the structure of the material remained the same; thus, the type of site on the surface would also be expected to remain the same, with the only difference being the exchangeable cations. Therefore, we hypothesize that the differences in CO2 adsorption among the samples were related to the basicity of the respective cations. Indeed, as CO2 is considered a Lewis acid, it tends to react with the most ‘basic’ cation among those present after exchange. pKa values provide insights into the basicity of the cations in solution, where a higher pKa value indicates greater basicity. With a pKa of 12.70, the Ca2+aq/CaOH+aq pair exhibits greater basicity compared to the corresponding pairs of Mg (pKa = 11.40), Ni (pKa = 9.86) and Co (pKa = 9.80). Consequently, Ca2+ demonstrates the strongest affinity for CO2 molecules due to its superior basicity. The Laponite sample contained Na+ and Mg2+ as exchangeable cations. For this reason, the adsorption of CO2 by the Laponite sample was greater than that of the Mg_Lap sample, which did not contain Na+ but only Mg2+. The adsorbed amount of CO2 was smaller for the Ni_Lap and Co_Lap samples compared to those of Mg_Lap, Lap_(Mg + Na) and Ca_Lap samples due to the smaller basicity of Ni2+ and Co2+ as compared to Mg2+, Ca2+ and Na+.
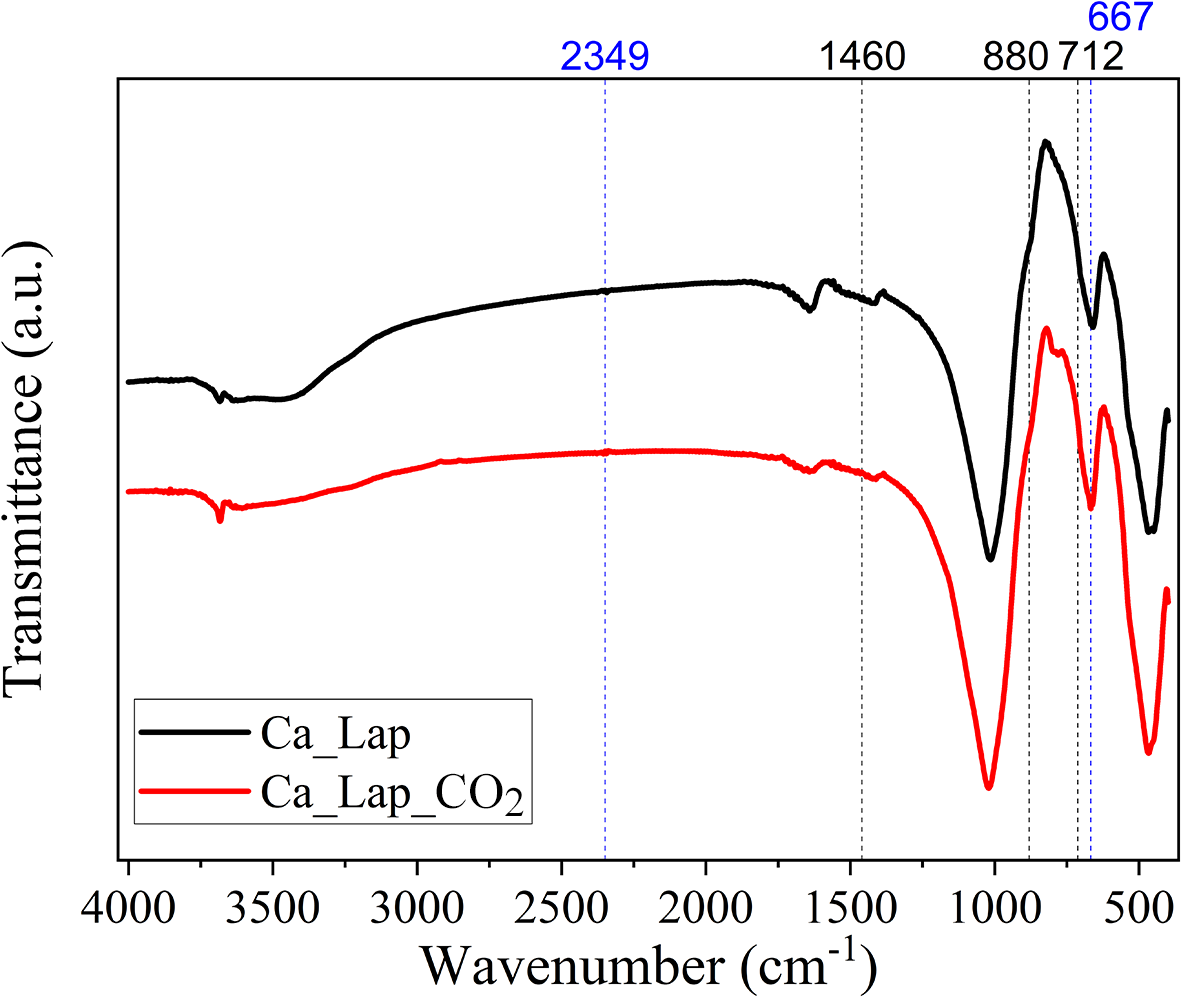
The CO2 desorption was performed by switching the inlet gas back to N2 for 30 min. As is shown in Fig. 6, all samples desorbed 80–90% of the amount of CO2 adsorbed. These CO2 molecules could then be expected to be physiosorbed. The remaining 10–20% of CO2 molecules could either be trapped within the porous structure or bonded chemically with the cations to form the corresponding carbonates. A FTIR spectroscopy analysis was performed on the Ca_Lap sample after it underwent the CO2 adsorption–desorption test. A comparison between the same sample before and after CO2 adsorption–desorption test is shown in Fig. 7. It can be seen that main band corresponding to carbonate at 1460 cm−1 (Munawaroh et al., Reference Munawaroh, Muharrami, Triwikantoro and Arifin2019) was not observed. Calcium carbonate has two additional bands that are less intense at 880 and 712 cm−1. A small change was observed for the Ca_Lap sample after CO2 adsorption at ∼800 cm–1, but the absence of the most intense carbonate band suggested that there were no carbonates formed.
FTIR spectra of Ca_Lap before (black line) and after (red line) the CO2 adsorption–desorption test.

The CO2 gas phase band values are 2349 and 667 cm–1, respectively, but no band was observed at ∼2349 cm–1 in our study, and the band at 667 cm–1 overlapped with the strong band of O–H bending in the material structure.
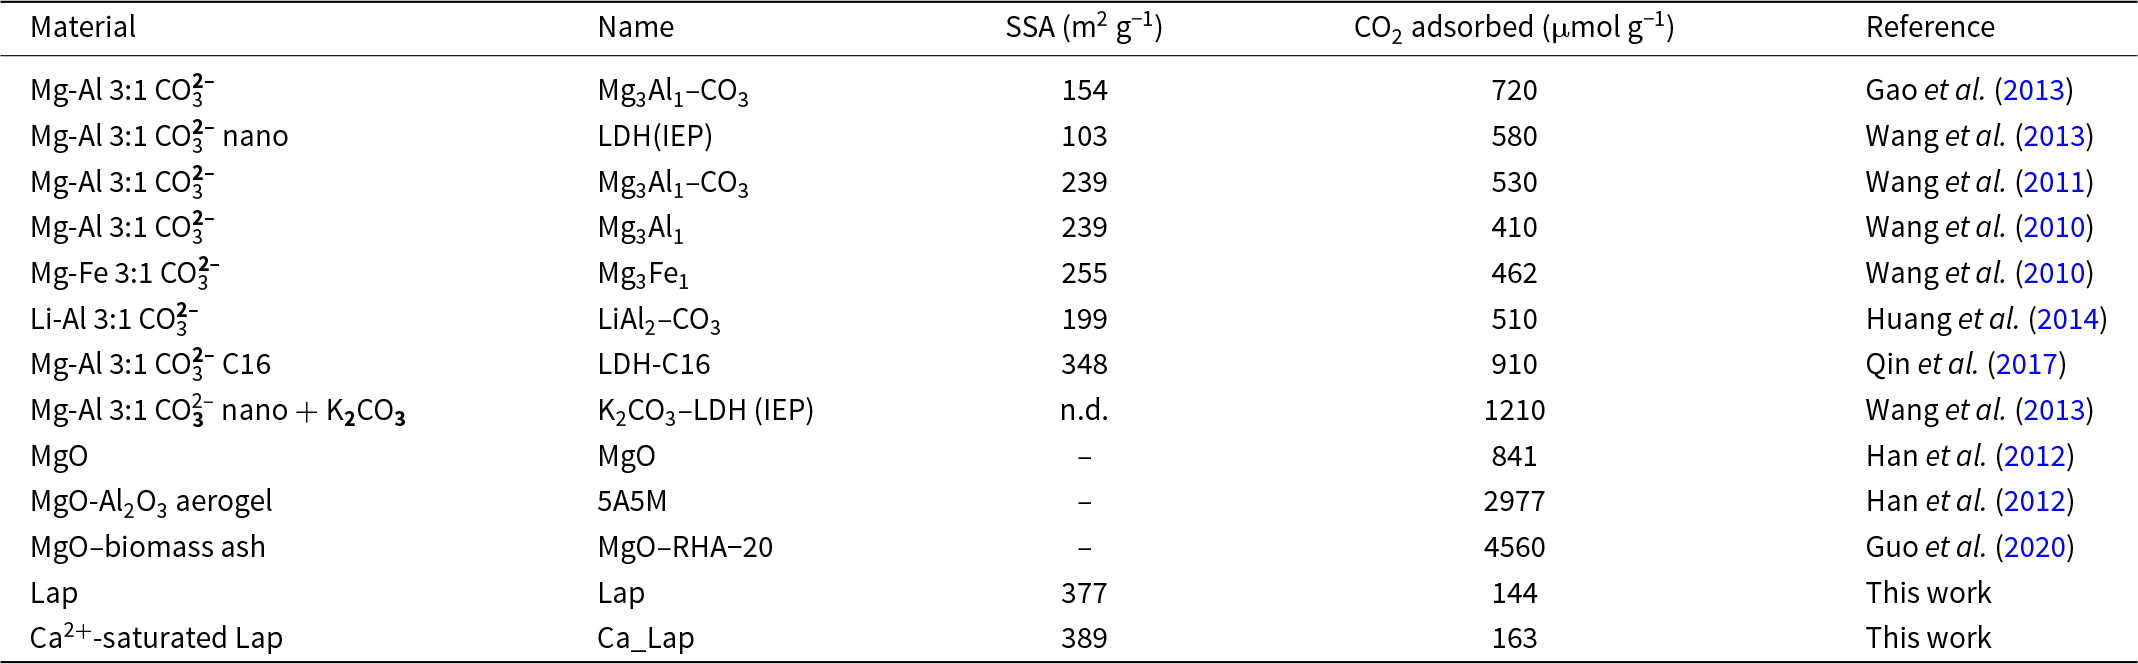
The materials studied in this paper were compared to other potential materials for CO2 adsorption (Table 3). For intermediate temperatures (200–400°C), two types of materials have been reported in the literature as CO2 sorbents: mixed oxides derived from LDH and MgO.
Comparison of the CO2 adsorption capacity at 200°C/1 atm between Laponite RD® (Lap) cation-exchanged materials in this work and other materials from the literature.

IEP = isoelectric point; n.d. = not determined.
LDH with a Mg:Al molar ratio of 3:1 and CO32– as a charge-compensating anion was reported to adsorb 410–720 µmol g–1 of CO2 (Table 3). Other charge-compensating anions such as nitrates or chlorides showed decreased CO2 adsorption capacity (Wang et al., Reference Wang, Wu, Tay, Chen, Liu and Chang2011). Replacement of Mg by Li or Al by Fe as well as the incorporation of organic acids slightly increased CO2 adsorption capacity. The most efficient LDH modification was with K2CO3, where the material’s capacity to adsorb CO2 was doubled from 600 to 1210 µmol g–1. Further combination of alkali doping and organic acid modification increased the LDH-based materials’ adsorption to 1930 µmol g–1 (Qin et al., Reference Qin, Wang, Zhou, Zheng, Huang and Zhang2017). Another material reported for intermediate-temperature CO2 capture was MgO. In a form of an aerogel, it demonstrated a much higher CO2 adsorption capacity (2977 µmol g–1) compared to that of LDH. Modification with biomass ash increased the material’s CO2 adsorption capacity even more (4560 µmol g–1). Despite excellent CO2 adsorption values, MgO was reported to present sintering problems, which would decrease its CO2 adsorption capacity over long term (Zhao et al., Reference Zhao, Wang, Huang, Musyoka, Xue, Rabeah and Wang2024).
The pristine Laponite tested in this study had approximately four times less CO2 adsorption capacity than LDH and MgO. The modifications, such as the cation exchange tested here, slightly increased its CO2 adsorption capacity, but the results were still not competitive with LDH.
To compare Ca_Lap with other clay mineral materials for which CO2 adsorption had been assessed at room temperature or lower, additional CO2 adsorption experiments were performed. The pretreatment was done at 300°C under N2 flow as previously, but the adsorption of CO2 was performed at 100°C and 30°C instead of 200°C. As expected, the amount of CO2 adsorbed increased. At 100°C, Ca_Lap adsorbed 360 µmol g–1, and at 30°C the adsorbed CO2 value was 692 µmol g–1. This value is similar to or slightly higher than the values reported in the literature. Stevens et al. (Reference Stevens, Williams, Han, Drage, Snape, Wood and Wang2013) reported a CO2 adsorption capacity of 490 µmol g–1 at 25°C for a K10 montmorillonite sample, and Azzouz et al. (Reference Azzouz, Ursu, Nistor, Sajin, Assaad and Roy2009) reported a CO2 adsorption capacity of 685 µmol g–1 for Na-montmorillonite.
Thus, Laponite had a CO2 adsorption capacity that was close to those of other smectites, but the amount of CO2 adsorbed per gram of material was significantly lower compared to those of other materials reported previously at intermediate temperatures (200–400°C; e.g. LDH and MgO).
Conclusion
In this work, we investigated the effects of various cations exchanged with Na+ of Laponite RD® on CO2 adsorption capacity. The samples were characterized through a series of physicochemical methods that confirmed that the sample structure was not altered during the cation-exchange process and that the Na+ was replaced by Co2+, Ni2+, Mg2+ and Ca2+, respectively. With a CO2 adsorption capacity at 200°C of 163 µmol g–1, the Ca2+-saturated laponite (Ca_Lap) outperformed the other prepared samples and also was the only sample that outperformed Laponite itself. This difference in CO2 adsorption was related to the affinity of the cation for CO2, and as Ca2+ had the best affinity, Ca_Lap adsorbed the most CO2 among the samples. Furthermore, evidence from the infrared analysis after CO2 adsorption indicated that the CO2 molecules were mostly physically adsorbed. A high CO2 adsorption capacity at 200°C is one of the criteria for selecting materials for CCU processes. Laponite had a CO2 adsorption capacity that was close to those of other similar clay minerals, but the amount of CO2 adsorbed per gram of material was significantly lower compared to those of other materials previously reported at intermediate temperatures (200–400°C; e.g. LDH and MgO).
Supplementary material
The supplementary material for this article can be found at https://doi.org/10.1180/clm.2025.2.
Author contributions
MHN: Data curation; Resources; Methodology; Investigation; Formal analysis; Visualization; Writing – original draft; Writing – review & editing. LD: Conceptualization; Funding acquisition; Project administration; Supervision; Resources; Methodology; Formal analysis; Validation; Writing – review & editing. SB: Conceptualization; Resources; Funding acquisition; Project administration; Supervision; Validation; Writing – review & editing. All authors have read and agreed to the published version of the manuscript.
Acknowledgements
All physicochemical characterizations were performed on IS2M technical platforms. The authors are very grateful to L. Michelin (XRD, XRF) and H. Nouali (ATG) for their contributions.
Financial support
This research was funded by the French National Research Agency, Project n° ANR-21-CE05-0023-02.
Conflicts of interest
The authors declare none.
Data availability statement
Data will be made available on request.