INTRODUCTION
Soft bottoms cover large surfaces and constitute the habitat of numerous organisms that are important in the coral ecosystem (Jones et al., Reference Jones, Ferell and Sale1990). Of the studies carried out on atolls and barrier reefs, few have investigated sublittoral soft bottom communities of tropical lagoons (Alongi, Reference Alongi1989a & Reference Alongib for a review) and studies on meiobenthic diversity, particularly nematodes species assemblages, the dominant group of meiofauna, are the exception (Alongi, Reference Alongi1986 & Tietjen, Reference Tietjen1991 in the Great Barrier Reef; Boucher & Gourbault, Reference Boucher and Gourbault1990 in Guadaloupe, Gourbault & Renaud-Mornant, Reference Gourbault and Renaud-Mornant1990 in Polynesia; Boucher, Reference Boucher1997 in New Caledonia; Netto et al., Reference Netto, Warwick and Attrill1999 in Brazil; Kotta & Boucher, Reference Kotta and Boucher2001 in Japan, New Caledonia, Fiji and Polynesia). Nematodes, as bioindicators, are known to present several potential advantages to characterize the environment (Dale & Beyeler, Reference Dale and Beyeler2001) and their species assemblages integrate complex interactions of the water column and sediment.
This paper describes diversity and spatial patterns of nematode assemblages of Uvea Atoll (Loyalty Islands) in the south-west Pacific which belongs to the Territory of New Caledonia. The atoll of Uvea has been investigated for sedimentology, plankton production, macrophytes, abundance and diversity of macrobenthic fauna, ecological functioning and fish resources. Kulbicki (Reference Kulbicki, Dalzell and Adams1995) proposed a synthesis of the available data on spatial distribution of the different communities and parameters in the lagoon. There are several features in the functioning of this atoll which suggest a high predation of benthic carnivorous fish on benthos and an increased production in terms of ATP and chlorophyll in the zones with the thinnest sediment layer.
The aim of the present investigation was to assess the specificity of atoll nematode species assemblages compared to other barrier reef lagoons and to check the efficiency of meiofauna indicators compared to macrofauna indicators in order to characterize an ecosystem.
Study site
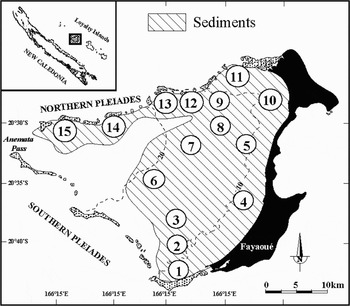
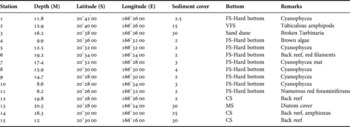
The atoll of Uvea situated north-east of New Caledonia is a triangle of 35 nautical miles across (Figure 1). Its lagoon covers 872 km2 and the reef only 40 km2. The main island covers 130 km2 and its leeward west coast largely comprises sandy beaches. The northern part of the lagoon is delimited by a line of barrier reefs and islands, the Northern Pléiades which run for 37 km. The southern part of the atoll is also limited by a line of reefs and islands (Southern Pléiades) which are exposed to the trade wind. Water enters west of the lagoon by the Anemata passage and flows out by the different channels of the Northern and Southern Pléiades. The bottom of the lagoon slopes slightly westward and reaches a maximum depth of about 40 m near the Anemata passage. Average depth is ~15 m. Hard grounds (31% of the lagoon surface) consist of a fairly smooth limestone table with scattered small coral structures. Sediments are always of a light colour, have high carbonate content and a low mud percentage. Sediment thickness is generally low with a mean value of ~5 cm and an average content of 3.83% organic matter content (Chevillon et al., Reference Chevillon, Clavier and Garrigue1992).The grid of meiofauna sampling, position of the stations and bottom characteristics of the lagoon of Uvea are shown in Table 1 and Figure 1.
Geographical position of the 15 stations investigated in the atoll of Uvea (Loyalty Islands, south-west Pacific).

Grid of benthos sampling and position and depth of the 15 investigated stations in the lagoon of Uvea (Loyalty Islands). Bottom: VFS, very fine sand; FS, fine sand; MS, medium sand; CS, coarse sand.

In a previous study, four macrofauna and flora species assemblages have been identified (Garrigue et al., Reference Garrigue, Clavier and Chevillon1998). Group I stations, leeward of the island, show the highest macroflora and macrobenthos biomass and correspond to shallower areas with a thin layer of fine to coarse sand. Main taxa are algae (Halimeda) and gastropods (Cerithium tenuifilosum, Vasum turbinellus and Rhinoclavis aspersa), bivalves (Cardium enode and Arcopagia robusta) and holothurians (Halodeima atra). Group II stations correspond to hard grounds at medium depth in the central part of the atoll (10 to 20 m) with a very thin layer of coarse sediment covered with cyanophytes settled on hard substrate and dominated by sessile species (Sarcocophyton and sponges) together with holothurians and gastropods (Cerithium tenuifilosum). Group III stations correspond to the back reef sand dune of the North Pléiades, at intermediate depths, with a cover of relatively thick medium to coarse sand dominated by bivalves (Fimbia fimbriata and Trachycardium enode) and gastropods (Rhinoclavis fasciata and Strombus gibberulus). Group IV stations correspond to deep hard grounds (more than 20 m) almost devoid of sediment cover and inhabited by sessile species such as sponges, cnidarians and gastropods.
MATERIALS AND METHODS
Sampling and processing of the samples
the investigation was performed on a meiofauna collection sampled during a cruise on OV ‘Alis’ in June 1994 at 15 stations (Table 1 and Figure 1). Samples were kept in the collections of the Natural History Museum of Paris and are presently studied. Due to SCUBA diving limitations by depth and meiofauna sorting time, a more limited number of stations (15) than the grid previously used for macrofauna (62 stations) was investigated. As a result, stations in the deeper central and western part of the lagoon, corresponding to bottoms characterized by macrobenthos Groups II and IV, were not investigated in this study. Stations 1, 2, 3, 4, 5, 6, 7, 8, 9, 10 and 11 belonged to macrobenthos Group I and stations 12, 13, 14 and 15 to Group III.
At each station, some physicochemical, biogeochemical parameters were immediately measured during or after the cruise. Subsamples were taken on the first centimetre of sediment of a core pushed into the substrate by SCUBA diving. Sediment was deep-frozen on board and later lyophilized for the analysis of amino acids, total carbon and nitrogen. Chlorophyll and phaeopigments were extracted in 90% acetone during 24 hours of dark in the refrigerator and their concentration measured by the spectrophotometric method of Lorenzen (Reference Lorenzen1967). Silt content and median grain size were measured by the traditional method using the Wentworth scale by sieving dried samples of the top centimetres. Median grain size and silt content of sediment were determined using cumulative weight-percentage histograms.
For meiofauna, three replicate 10 cm−2 hand-cores had been taken at each station. The five first centimetres were collected when possible or fewer when the sediment cover on the hard ground was lower. Volume of the collected sediment was measured. Samples were fixed immediately in 5% formalin for later analysis. In the laboratory, fauna were extracted with Ludox™ and the major taxa were counted in a Petri dish after dilution in a Motoda box splitter (Motoda, Reference Motoda1959) in order to obtain ~150 nematodes. Densities were expressed per unit of surface (10 cm2) and volume (10 ml). A hundred nematodes were randomly selected and identified to the species level. Supplementary taxonomic information (genera, family and order), based on the classification of Platt & Warwick (Reference Platt, Warwick, Kermack and Barnes1988), was added into an Access database (MARBEF, Manuela data base Bougainville). The feeding types of nematodes were also determined according to the classification of Wieser (Reference Wieser1953).
Data analysis
Multivariate data analyses were performed with the statistical program PRIMER whose techniques are discussed in Clarke & Warwick (Reference Clarke and Warwick1994). Three data sets were used to characterize the environment at the 15 investigated stations: physicochemical parameters, density and composition of the main meiofauna groups on 45 replicates and mean abundance of the dominant nematode species on 15 stations.
Cluster analysis and multidimensional scaling (MDS) analysis on quadratic-root transformed data of nematode abundance per unit of surface was used to quantify the similarities between nematode species assemblages. The Bray–Curtis similarity measure was used to construct the dissimilarity matrices of nematode abundance data and Euclidean distance was used to construct the similarity matrix for non-transformed environmental data. The statistical differences in meiofauna density and nematode assemblages between study regions were calculated by the Kruskal–Wallis test and Mann–Whitney U-test, and ANOSIM permutation test (Clarke, Reference Clarke1993). This limited set of 15 meiofauna samples was assigned to each of the macrofauna groups previously described by Garrigue et al. (Reference Garrigue, Clavier and Chevillon1998), i.e. Groups I and III, in order to test difference of nematode composition between each group.
Similarity percentage analysis (SIMPER) of √-transformed nematode species abundance was used to determine the contribution of individual species to the Bray–Curtis dissimilarity between groups (Clarke, Reference Clarke1993). A Spearman rank correlation (ρW) was computed between the similarity matrices of nematode abundance and environmental data to examine the ecological significance of environmental variables on nematode assemblages (Clarke & Ainsworth, Reference Clarke and Ainsworth1993). A permutation procedure was essential here because classical statistical approaches to significance testing are not valid for typical community matrices.
Univariate measures of diversity were computed according to Hill (Reference Hill1973) on each of the 45 samples. The effect of location on nematode abundance and diversity indices was estimated by the Kruskal–Wallis test and two sample Mann–Whitney U-test since most of the data did not conform to requirements of normality and homogeneity. Univariate parametric correlation coefficients were computed between the numeric environmental parameters, the abundance of meiobenthic taxa and different diversity indices.
Randomization of site sequence for the calculation of species accumulation curves was done using EstimateS software (R.Caswell, http://viceroy.eeb.ucom.edu/estimates). The rarefaction method allowed to calculate the expected number of species and to test the effect of different sample size. Labelling of species restricted to a single site or ‘uniques’ and labelling of species restricted to a single individual or ‘singletons’ follows the terminology of Colwell & Coddington (Reference Colwell and Coddington1994). Similarly, ‘doubletons’ are species represented by exactly 2 individuals in a sample and ‘duplicates’ are species occurring at 2 localities only.
RESULTS
Environmental parameters and meiofauna density
water temperature in the lagoon ranged from 21.4°C to 22.4°C and salinity from 34.97‰ to 35.38‰ during the investigation. Most of the sampled stations were characterized by a thin cover of white coral sand on a hard bottom constituted by the accretion of sand grains (Table 1). Only 3 stations located on the back reef sand dune near the Northern Pléiades reef (Stations 13, 14 and 15), and 2 stations near the main passage of the lagoon (Stations 2 and 3), had a significant sediment cover. As a result, space available for meiofauna was restricted to some centimetres and varied according to sediment depth cover.
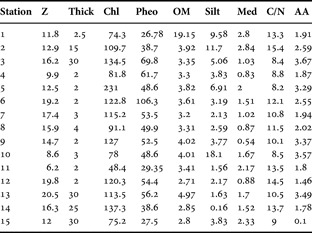
Table 2 indicates the value of 9 environmental parameters: water depth, sediment thickness, phaeophytin and chlorophyll pigments, grain size (silt content and median), organic matter content and quality (carbon/nitrogen ratio, amino acid content). Spearman correlations between environmental parameters were quite low and the highest correlations were calculated between depth and phaeopigments (0.530), phaeopigments and median grain size (−0.505), organic matter and median (0.480), depth and silt (−0.469), chlorophyll and amino acids (0.429).
Environmental parameters measured at 15 stations in Uvea Atoll: Z, depth (metres); sediment cover, thick (cm); Chl & Pheo, chlorophyll and phaeopigment content (mg · m−2); OM, organic matter content (gm−2); Silt, silt content (%); Med, median (mm); C/N, carbon/nitrogen ratio; AA, amino acids (mg · g−1).

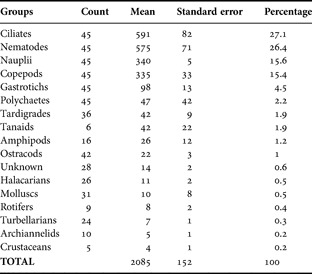
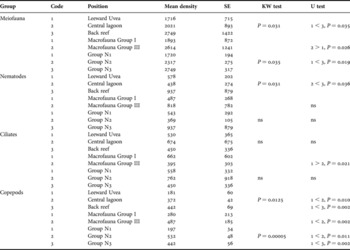
Density of total meiofauna was quite high for such a thin layer of sediment and ranged in the different stations from 1121 ± 83 to 4560 ± 224 individuals 10 cm−2 with a mean value of 2085 ± 307 individuals 10 cm−2 for the whole data set. The dominant meiofauna taxa were ciliates (591 ± 165 individual 10 cm2 and 27.1 ± 2.2%) followed by nematodes (575 ± 143 individual 10 cm2 and 26.4 ± 1.9%) and harpacticoid copepods (335 ± 67 individual 10 cm2 and 15.4±1.4%). The contribution of interstitial polychaetes, gastrotrichs and tardigrades was also noticeable (Table 3).
Frequency of occurrence (count), mean density and standard error of the mean of the different meiofauna taxa sorted in the 45 samples collected in the atoll of Uvea. The dominance of ciliates in coral sand is quite uncommon.

As depth penetration of the cores was different according to the thickness of the sediment cover, density per unit of volume (10 ml) was calculated as well but did not seem to be a better estimation of density since the bulk of meiofauna is present in the upper layers of the sediment and penetration into the sediment column depends on the physiological adaptation of the different meiofauna groups to anoxic conditions. Nematodes and ciliates are known to penetrate deeper into the sediment than harpacticoid copepods. As a matter of fact, density per unit of surface explained a limited part of density per unit of volume: r2 of the linear regression between both metrics was 0.447 and 0.422 for nematodes and ciliates respectively but only 0.101 and 0.341 for total meiofauna and copepods respectively. Density per unit of volume always decreased with the volume of collected sand. The relationships explained a similar low percentage of variance (r2 = 0.483, 0.390, 0.167, 0.120 for meiofauna, nematode, ciliates and copepods respectively) and suggested that counts corrected from volume was not a better estimate of density than counts per unit of surface.
Three sets of parameters were considered in order to detect significant density differences between stations (Table 4). Vicinity in relation to the coastline, but also sediment cover, seemed to have some influence on total meiofauna, nematode and harpacticoid copepods densities but not on ciliate density. Median of meiofauna densities was significantly lower in the stations leeward of the Island than in the back reef stations of North Pléiades (Kruskal–Wallis and Mann–Whitney U-test significant at P < 0.05). Median of nematode densities was significantly lower in the central part of the lagoon than in the back reef stations. Median of harpacticoid copepod densities was significantly lower leeward of the island than in the back reef stations. The relationship of meiofauna density with the type of macrofauna community (Groups I and III) was also tested. Significant differences were obtained for total meiofauna, ciliates and copepods (Mann–Whitney U-test test significant at P < 0.05) but not for nematodes. As well, the relationship of meiofauna density with the type of nematode species assemblage was tested. Significant differences between Groups N1, N2 and N3 (see further for the definition of nematode species assemblages) were detected for total meiofauna, nematodes and copepods but not for ciliates (Kruskal–Wallis test significant at P < 0.05). Median of densities was significantly lower for total meiofauna and harpacticoid copepods.
Density of meiofauna groups according to location (leeward Uvea: 4, 5, 10 and 11; central lagoon: 1, 2, 3, 7, 8, 9 and 12; back reef North Pléiades: 13, 14 and 15), macrofauna species assemblages (Group I, 1 to 11; Group III, 12 to 15) and nematode species assemblages (Group N1, 1, 5, 7, 8, 9, 10 and 11; Group N2, 2, 3, 4, 6, 12; Group N3, 13, 14 and 15).

KW test, Kruskal–Wallis test; U test, Mann–Whitney U-test; ns, not significant.
In order to test differences between groups of multivariate samples, the null hypothesis of ANOSIM was that there was no difference between meiofauna density of stations located in Groups I and III macrofauna communities previously detected in the lagoon. For meiofauna and environmental parameters, R values were low (0.171 and 0.291 respectively) indicating that there was no significant difference in the density of meiofauna main taxa into Groups I and III macrofauna assemblages (P = 0.16) but that there was a significant difference in the environmental parameters (P = 0.04) between the two groups.
Linking meiofauna community to environmental variables by the BIOENV procedure allowed to identify the subset of parameters whose pattern best matches the meiofauna taxa assemblage. The largest match correlations were obtained with four parameters on nine: depth, OM, C/N ratio and sediment thickness (0.457) but only two parameters, OM and sediment thickness, explained a similar match (0.447) and thickness alone explained most of the correlation (0.369). The meiofauna main taxa which were the more characteristic of the macrofauna assemblages I and III were total meiofauna density, nematode, ciliates, harpacticoid copepods and polychaetes (0.949) but both nematode and ciliate densities also gave a quite good indicator (0.802) of the grouping.
Structure of the nematode species assemblage
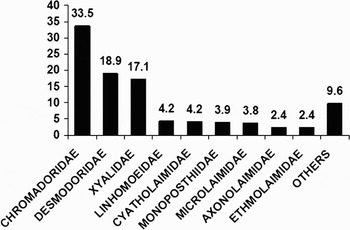
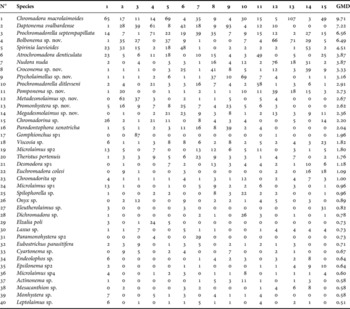
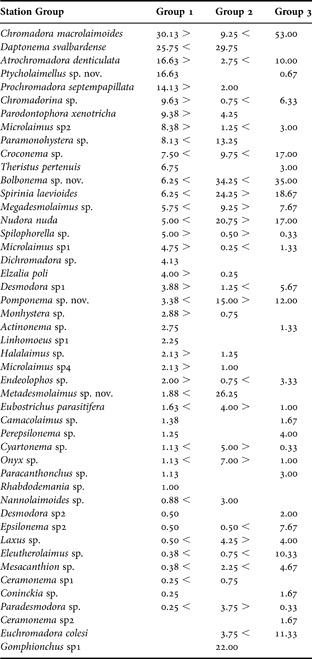
35 families and 134 nematode species were identified in the 45 samples of 100 individuals collected at 15 stations. Chromadoridae, Desmodoridae and Xyalidae averaged 69.5% of the whole nematode assemblage (Figure 2). Twenty-one species had a mean general dominance higher than 1% and 40 species had dominance higher than 0.5% (Table 5). Four species (Chromadora macrolaimoides, Daptonema svalbardense, Prochromadorella septempapillata and an undescribed species of Bolbonema) had a dominance higher than 5%.
Contribution (%) of the dominant families of the nematode fauna.

Faunistic list of nematode species with a general mean dominance (GMD) larger than 0.5% in the Uvea Atoll.

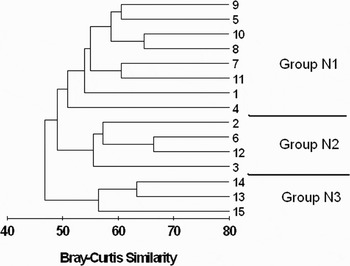
Cluster analysis (Figure 3) of species abundance data indicated that three nematode assemblages were present in the 15 stations presently studied of this lagoon. The differences between these assemblages were however quite low since the dendrogram derived from the matrix was remarkably flat with divisions occurring at similarities of 50.88 (Group N1), 55.45 (Group N2) and 56.44% (Group N3). The species assemblages characterized three biotopes as:
Dendrogram showing arbitrary division into three nematode species assemblages at 50.88 (Group N1), 55.45 (Group N2) and 56.44% (Group N3) similarity; analyses of Bray–Curtis similarities from fourth-square-root transformed abundances of nematodes between each station.

Group N1, shallow areas with a thin layer of medium to coarse sand (8 stations: 1, 4, 5, 7, 8, 9, 10, 11) corresponding to the stations leeward of the Island previously defined in group I for macrofauna;
Group N2, hard grounds with a thin layer of medium to coarse sand at intermediate depth corresponding to Groups I (Stations: 2, 3 and 6) and III (Station 12) previously defined for macrofauna;
Group N3, back-reef sand dune with at least 20 cm sediment cover close to the Northern Pléiades (3 stations: 13, 14 and 15) corresponding to Group III previously defined for macrofauna.
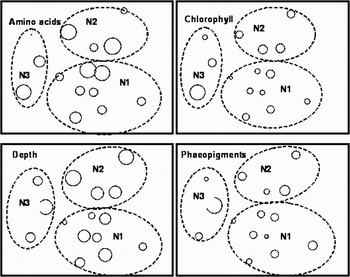
Ordination of samples by non-metric MDS (Figure 4) indicates that the null hypothesis can be rejected and the species assemblages of these three groups of stations were significantly different at P < 0.001. ANOSIM pairwise test between the three different groups was respectively Group N1–Group N3: 0.79, Group N1–Group N2: 0.62, Group N3–Group N2: 0.72. R statistic values above 0.75 indicate that N1 and N3 are well separated and clearly different and values above 0.50 indicates that N1–N2 and N2–N3 are overlapping but clearly different.
MDS ordination (stress = 0.14). Superimposed clusters are divisions into three groups based on cluster analysis. Superimposed bubble plots on MDS ordination for different parameters (amino acids, chlorophyll, depth and phaeopigments) indicating that no single factor can explain the pattern.

A selected set of important parameters was obtained from nematode species composition and environment parameters matching (BIOENV procedure). The highest correlation (r = 0.948) between biotic patterns and environmental parameters, which best explain these patterns, was obtained with 5 parameters: chlorophyll, phaeopigments, OM, silt and sediment thickness (0.908). Sediment thickness alone explained most of the biota/parameters matching (r = 0.603) since it characterizes the potential depth penetration of the fauna in the sediment but also the result of particle deposition. However, bubble plots superimposed on MDS plots derived from nematode abundancy for different parameters (amino acids, chlorophyll, depth and phaeopigments) indicated that no single factor can explain the pattern (Figure 4).
The contribution of the different species to the average sample dissimilarity between the groups was implemented in the SIMPER procedure (Table 6). Groups N1 & N2, N1 & N3, N2 & N3 had respectively an average low dissimilarity of 23.03, 23.74 and 18.65% indicating that environmental variables show no obvious correlation with the biotic data.
Summary of similarities (SIMPER) analysis. Differences in average abundances of species contributing to Bray–Curtis dissimilarities between selected pair of groups of stations identified in the cluster analysis based on root-transformed weighted average abundances. A cut-off at a cumulative per cent dissimilarity of 50% was applied.

The species contributing mostly to these groups were:
– for Group N1: Chromadora macrolaimoides, Daptonema svalbardense, Atrochromadora denticulata, Ptycholaimellus sp. and Prochromadora sp.
– for Group N2: Bolbonema sp., Daptonema svalbardense, Metadesmolaimus sp., Spirinia laevioides and Nudora nuda.
– for Group N3: Chromadora macrolaimoides, Bolbonema sp., Spirinia laevioides, Croconema sp. and Nudora nuda.
Difference between the nematode species composition of stations located in Groups I and III macrofauna communities was also tested by ANOSIM. R = 0.577 is larger than could be expected by chance and the null hypothesis was rejected at the P = 0.03 level. Nematode assemblages found in the macrofauna Group I stations were thus significantly different from those corresponding to macrofauna Group III.
Diversity and trophic structure
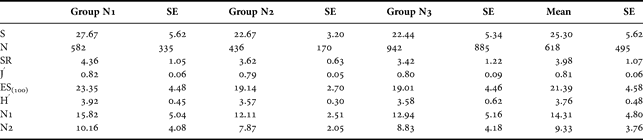
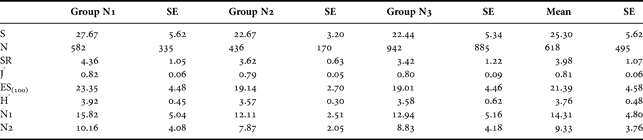
Diversity indices were calculated on the 45 samples of 100 nematodes collected in 15 stations on data obtained from 100 individuals. In order to take into account sample size, rarefaction was also applied to data standardized from actual density per unit of surface (Table 7). Estimated number of species in density corrected samples was lower than in 100 individual samples. Species richness indices (S, SR and ES100) were significantly different in the 3 nematode assemblages (Kruskal–Wallis test, P = 0.0067; 0.0065; 0.0066 respectively) and group N1 had a higher median than groups N2 and N3 (Mann–Whitney U-test significant at P < 0.05). Dominance indices (H′, J′, H0 and H1) were not significantly different.
Mean values and standard error of diversity indices in the three nematode assemblages and in the whole Uvea lagoon. S, number of species; N, sample size; SR, species richness; J′, evenness; ES100, estimated number of species for 100 individuals; H′, Shannon index (log2); Hill numbers N1, Exp(H′); N2, 1/Si.
Trophic structure of the nematode assemblage was dominated by epigrowth feeders (70%) followed by non-selective deposit feeders (22%). No difference of trophic structure was found between the 3 species assemblages except for predators/omnivores (Kruskal–Wallis test significant at P < 0.04) which were more abundant in the back reef sediments of the North Pléiades (Group N3).
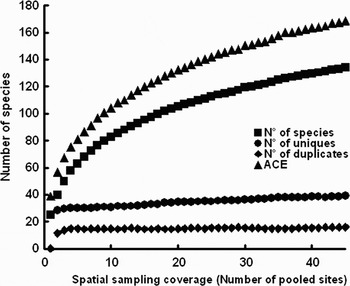
Sampling effect
Among the 134 species recorded in the lagoon, respectively 32 and 17 were singletons and doubletons (species with only one or two individuals) whereas respectively 38 and 21 were uniques or duplicates (species that occur in only one or only two samples). Low sampling intensity is known to underestimate the range-sizes of species that occur at low local density even though their real distribution coincides with those of the more dominant species (Hanski et al., Reference Hanski, Kouki, Halkka, Ricklefs and Schluter1993). Increase of sampling intensity at the local scale makes the accumulation curve approach an asymptote (Figure 5). For meiofauna, 3 replicates are the minimum requirement and the present results show that species restricted to one site or two sites stabilize very quickly. Spot endemism (Schlacher et al., Reference Schlacher, Newell, Clavier, Schlacher-Hoenlinger, Chevillon and Britton1998) represents range-size estimates at the smallest spatial scale possible. Estimates of total species richness show little sign of stabilizing toward asymptotic values, thus the number of spot endemics was adequately estimated. Common species were added with increasing sampling coverage rather than restricted range species.
Species accumulation curves for nematodes. Estimators of richness are the total number of species (square), the number of species restricted to a single site (unique), the number of species found at exactly 2 sites only (duplicates) and ACE, abundance based coverage. Plotted values are means of 50 random reshuffles of sample order.

DISCUSSION
Meiofauna densities are commonly expressed per unit of area in a constant volume of sediment. In this study, the variability of sediment thickness did not allow to sample at each station a constant volume of sediment as usually done in most meiofauna studies. Standardization of the numbers per unit of sediment volume remained however inadequate to better explain the pattern since density of the dominant taxa per unit of surface was not correlated with the volume of collected sand. Calculation of density per unit of surface is more convenient to evaluate meiofauna productivity of this atoll.
According to the classification proposed by Chardy et al. (Reference Chardy, Chevillon and Clavier1988) and Chardy & Clavier (Reference Chardy and Clavier1988) in the south-west lagoon of New Caledonia, the floor of the Uvea lagoon can be roughly classified as a mixture of white sand and grey sand bottoms without significant sea grass beds. However, most of the stations located on a beach rock with a moderate sediment cover were colonized by patchy cyanophyte mats. Many investigators (Chevallier et al., Reference Chevallier, Denizot, Plessis and Salvat1968; Colin, Reference Colin, Devarney, Reese, Purch and Helfrich1987; Intes & Caillart, Reference Intes and Caillart1994) have noticed these mats to be characteristic of atoll lagoon floors, a feature which is quite uncommon in barrier reef lagoons.
Depth, mean grain size and sediment thickness have been suggested to be the main factor affecting macrofauna density (Garrigue et al., Reference Garrigue, Clavier and Chevillon1998) whereas meiofauna was mostly affected by sediment thickness and, at a lower level, by pigments, organic matter and silt content. Meiofauna is obviously more affected than macrofauna by the size of the habitat since most of the meiobenthonts (mainly nematodes and ciliates) are able to colonize the deeper layers of the sediment. The lower influence of water depth on meiofauna density could however be due to a lower depth range of the stations investigated for meiofauna than for the stations investigated for macrofauna. Stations near the back reef of the Northern Pléiades and in the central part of the lagoon are more productive than the other stations since they have more chlorophyll and amino acid content due to higher sediment thickness and/or water circulation. The previous studies of Garrigue et al. (Reference Garrigue, Clavier and Chevillon1998) and Kulbicki (Reference Kulbicki, Dalzell and Adams1995) have shown that the ATP pool, which is a proxy of living biota, and pigments which are a proxy of primary production, are very significantly correlated to sediment thickness but not with depth and grain size.
Comparison of meiofauna and macrofauna spatial patterns was hampered by a more limited sampling in this study than in the previous macrofauna study. Our results detected three nematode species assemblages within the two macrofauna assemblages which were previously proposed by Garrigue et al. (Reference Garrigue, Clavier and Chevillon1998). Nematode Group N3 corresponded to macrofauna Group III in the back reef stations. Nematode Groups N1 and N2 were overlapping but clearly different within macrofauna Group I. However, stations that are placed in Group N2 are localized at higher depth (16.2 to 20.5 m) than most of the stations of Group I on the basis of macrofauna species assemblages. The boundaries of the meiobenthic communities are thus not the same as those identified for the macrofauna communities.
Similar coral sand biotopes have been previously investigated in barrier reef lagoons of New Caledonia (Clavier et al., Reference Clavier, Boucher, Bonnet, Di Matteo, Gérard and Laboute1990; Boucher, Reference Boucher1997), and Fiji and Polynesia (Kotta & Boucher, Reference Kotta and Boucher2001). In spite of a more reduced sand cover, total meiofauna density in Uvea was in the same range as the values found in white sand and grey bottoms of other high barrier reef lagoons. This suggests that a thin cover of white sand on a beach rock can be very productive. However, nematode density and dominance of nematodes was lower to the benefit of ciliates (26.4%/49.7%). Although the same preservation techniques were used in both biotopes, such a high dominance of ciliates was never found in previous studies on different reefs of the Pacific (Boucher, Reference Boucher1997; Kotta & Boucher, Reference Kotta and Boucher2001). Cyanophyte mats could favour a proliferation of this taxon or some ciliate species that are not damaged by formalin fixative.
Although Uvea is only 60 miles from the east coast of New Caledonia, species composition and dominance between both sites were quite different. Mean nematode species number was significantly lower in Uvea than the mean value found in the three main communities of the south-west lagoon of New Caledonia but, however, in the range of white sand bottoms (25 ± 5.5 versus 28.7 ± 2.05).
Family composition of nematodes was similar to the previous finding in tropical coral sand investigated in New Caledonia, Fiji and Moorea (Boucher, Reference Boucher1997; Kotta & Boucher, Reference Kotta and Boucher2001) and Chromadoridae and Desmodoridae prevailed. Among the dominant species, Chromadora macrolaimoides and an undescribed species of Bolbonema were found in all locations. Prochromadorella septempapillata was also dominant as in Fiji and Moorea lagoon. Stilbonematidae (15%) with Laxus cosmopolitus, which was the most dominant species in the south-west lagoon of New Caledonia, appeared quite rarely in the Uvea lagoon. This suggests that bacterial ectosymbiosis of nematodes is less necessary in such an environment where cyanophyte mats prevails and when sediment thickness is lower.
Hill diversity indices are sample size dependent and give absolute taxon diversity whereas the estimated species number is not sample size dependent. Taking into account sample size indicated no significant difference between nematode assemblages of N1 and N2, and N2 and N3. Thus, an increased diversity of the shallow stations leeward of the island was the only significant trend.
An interregional study of nematode assemblages in coral sands of the Pacific (Kotta & Boucher, Reference Kotta and Boucher2001) has shown that the effect of sediment characteristics on species composition is more important at the local scale than at the regional scale. However, in the Uvea Atoll, grain size (median and silt content) is not the prime factor in structuring benthic assemblages, as previously shown for macrobenthos in the lagoon of Fiji (Schlacher et al., Reference Schlacher, Newell, Clavier, Schlacher-Hoenlinger, Chevillon and Britton1998). High spatial variability is a key feature of the benthic biota in atoll lagoons. Of the total of 134 taxa recorded in Uvea, 28.4% were rare being restricted to a single sample. Only one species spanned the entire lagoon (Prochromadorella septempapillata). Obviously a reduced number of replicates, as it is commonly done in meiofauna studies, could inflate estimates of locally restricted species. Total species richness showed no sign of stabilizing toward asymptotic values but spot endemics stabilized very quickly. Only common species were added with increasing sampling coverage rather than restricted range species. Thus diversity of nematodes in atoll lagoons results from a mosaic of different species assemblages which suggests patch dynamics as observed for the deep-sea benthos (Rice & Lambshead, Reference Rice, Lambshead, Giller, Hildrew and Raffaeli1994). However, in the case of a highly productive lagoon such as Uvea, organic input variability is certainly not the key factor and other causes of disturbance such as fish or macrofauna grazing and excretion have to be taken into account.
ACKNOWLEDGEMENTS
The authors are grateful to the crew of the OV ‘Alis’ and the IRD team for their help during the cruise directed by J. Clavier. Some environmental parameter analyses were performed at the IRD Center of Noumea, namely by C. Chevillon, C. Garrigue, for grain size and pigments and at the CEFREM University of Perpignan, namely by R. Buscail, for organic matter analysis.