Introduction
Microsporidia are unicellular obligate parasites that infect nearly all orders of insects, as well as many other invertebrate and vertebrate species including humans (Mathis Reference Mathis2000; Keeling and Fast Reference Keeling and Fast2002; Franzen Reference Franzen2008; Troemel and Madhani Reference Troemel and Madhani2011). The European honey bee, Apis mellifera Linnaeus (Hymenoptera: Apidae), is currently infected by two described species of Microsporidia, Nosema ceranae Fries and Nosema apis Zander, causing Nosema disease and resulting in decreased honey production, foraging activity, and consequently reduced pollination productivity (Fries et al. Reference Fries, Ekbohm and Villumstad1984; Anderson and Giacon Reference Anderson and Giacon1992; Higes et al. Reference Higes, Martín-Hernández, Botías, Bailón, González Porto and Barrios2008; Antúnez et al. Reference Antúnez, Martín Hernández, Prieto, Meana, Zunino and Higes2009). For years it was assumed that Nosema disease of honey bees was exclusively attributed to N. apis (Fries Reference Fries1988, Reference Fries2010; de Graaf et al. Reference de Graaf, Raes, Sabbe, De Rycke and Jacobs1994; Webster et al. Reference Webster, Pomper, Hunt, Thacker and Jones2004). However, during the last decade, it appears that N. ceranae has increased its distribution worldwide and now has been detected in all continents (Fries et al. Reference Fries, Martin, Meana, Garcia-Palencia and Higes2006; Higes et al. Reference Higes, Martín-Hernández and Meana2006; Chauzat et al. Reference Chauzat, Higes, Martín-Hernández, Meana, Cougoule and Faucon2007; Klee et al. Reference Klee, Besana, Genersch, Gisder, Nanetti and Tam2007; Chen et al. Reference Chen, Evans, Smith and Pettis2008; Williams et al. Reference Williams, Shafer, Rogers, Shutler and Stewart2008; Yoshiyama and Kimura Reference Yoshiyama and Kimura2010; Guzman-Novoa et al. Reference Guzman-Novoa, Hamiduzzaman, Arichavaleta-Velasco, Koleoglu, Valizadeh and Correa-Benitez2011).
Since its first description in 1909 (Zander Reference Zander1909) the prevalence, distribution, and seasonal patterns of N. apis have been described showing similar seasonal patterns in the northern and southern hemispheres (Bailey Reference Bailey1955; Doull and Cellier Reference Doull and Cellier1961) with absence of seasonal prevalence patterns in subtropical and tropical regions (Fries Reference Fries2010). The recent discovery of N. ceranae in the eastern honey bee, Apis ceranae Fabricius, in 1996 (Fries et al. Reference Fries, Feng, daSilva, Slemenda and Pieniazek1996), and the European honey bee, A. mellifera, in 2006 (Higes et al. Reference Higes, Martín-Hernández and Meana2006), prompted several researchers to report on its distribution, prevalence, and seasonal patterns, however, the results pertaining to seasonal patterns and virulence were variable (Martín-Hernández et al. Reference Martín-Hernández, Meana, Prieto, Salvador, Garrido-Bailon and Higes2007; Higes et al. Reference Higes, Martín-Hernández, Botías, Bailón, González Porto and Barrios2008; Gisder et al. Reference Gisder, Hedtke, Mockel, Frielitz, Linde and Genersch2010; Traver and Fell Reference Traver and Fell2011). For example, in the United States (Chen et al. Reference Chen, Evans, Smith and Pettis2008; Johnson et al. Reference Johnson, Evans, Robinson and Berenbaum2009; van Engelsdorp et al. Reference van Engelsdorp, Evans, Saegerman, Mullin, Haubruge and Kim Nguyen2009) and Germany (Gisder et al. Reference Gisder, Hedtke, Mockel, Frielitz, Linde and Genersch2010) neither N. apis nor N. ceranae were responsible for increased colony mortalities and losses, while studies in Spain demonstrated that N. ceranae increased the amount of winter losses (Higes et al. Reference Higes, García-Palencia, Martín-Hernández and Meana2007; Martín-Hernández et al. Reference Martín-Hernández, Meana, Prieto, Salvador, Garrido-Bailon and Higes2007).
Nosema species infecting honey bees are difficult to distinguish microscopically due to highly similar morphology (Chen et al. Reference Chen, Evans, Murphy, Gutell, Zuker and Gundensen Rindal2009a). This has led to the development of molecular characterisation and differentiation of the two species using polymerase chain reaction (PCR)-based technologies. Multiplex quantitative RT-PCR (qPCR) is a molecular technique that not only distinguishes the two Nosema species but can also quantify the amount of each species present in one sample simultaneously resulting in spore count equivalents or copy numbers that can be reliably compared (Chen et al. Reference Chen, Evans, Zhou, Boncristiani, Kimura and Xiao2009b; Bourgeois et al. Reference Bourgeois, Rinderer, Beaman and Danka2010; Gisder et al. Reference Gisder, Hedtke, Mockel, Frielitz, Linde and Genersch2010; Hamiduzzaman et al. Reference Hamiduzzaman, Guzman-Novoa and Goodwin2010; Traver and Fell Reference Traver and Fell2011). Seasonal patterns of N. ceranae have been studied with varying results ranging from a lack of seasonality (Martín-Hernández et al. Reference Martín-Hernández, Meana, Prieto, Salvador, Garrido-Bailon and Higes2007; Higes et al. Reference Higes, Martín-Hernández, Botías, Bailón, González Porto and Barrios2008) to peaks in the spring (Gisder et al. Reference Gisder, Hedtke, Mockel, Frielitz, Linde and Genersch2010; Traver and Fell Reference Traver and Fell2011). So far, comprehensive studies to understand the variations in seasonal patterns are lacking.
In Canada, the presence of N. ceranae in the European honey bee was first reported from the Maritime provinces (Williams et al. Reference Williams, Shafer, Rogers, Shutler and Stewart2008). A nationwide survey of Nosema species reported that N. ceranae was found in every Canadian province in 2007 at similar rates as N. apis, and present as both single and mixed infections (Canadian Association of Professional Apiculturalists 2008; Williams et al. Reference Williams, Shafer, Rogers, Shutler and Stewart2008; Hamiduzzaman et al. Reference Hamiduzzaman, Guzman-Novoa and Goodwin2010). Seasonal patterns of N. ceranae at Beaverlodge Research Station, Alberta, Canada indicated that N. ceranae levels were high in spring and low in the summer with high variation in overwintering colonies (Pernal et al. Reference Pernal, Ibrahim and Melathopoulos2010). In rare cases, consistently high levels of summer infection rates were observed (Pernal et al. Reference Pernal, Ibrahim and Melathopoulos2010).
To date, however, there are no published records of natural infections of N. ceranae and N. apis in A. mellifera in the province of Québec, Canada. In order to gain more insight into the prevalence and seasonal patterns of microsporidian parasitism in honey bees in Québec, we conducted a 3-year study to monitor the status of Nosema infection in six naturally infected hives at an apiary located in Deschambault, Québec, Canada. Here we describe different detection methods for Nosema spp. including a duplex qPCR assay for one-step differentiation and quantification of N. ceranae and N. apis and provide evidence that both exist as mixed infections with N. ceranae as the more prevalent parasite in the sampled apiary.
Materials and methods
Sample collection
Six hives sterilised with ethylene oxide and containing screened bottom boards were placed at an apiary at the Centre de Recherche en Sciences Animales de Deschambault (CRSAD) located in Deschambault (46.6734°N, 71.9169°W), Québec, Canada were started in 2008 using free mated sister A. mellifera hybrid Italian queens obtained from a local queen breeder (Les reines Moreau®, Saint-Liboire, Québec, Canada) and 1.5 kg of worker bees. All hives tested positive for the presence of at least one Nosema species at the beginning of the study using conventional PCR techniques. Approximately 100 worker honey bees were collected on an approximately monthly to bimonthly basis from the side frames of the top super from each hive during 14 months from June 2008 to July 2010 resulting in 84 collections. Hives were fed ad libitum with 1:2 sugar-water syrup at the end of August, and were overwintered in a common environmentally controlled room (3–5°C and 30%–40% relative humidity) between November and April of each year, during which no collections of bees were made except for December 2008. Hives were placed outdoors in April of each year. Hives were not requeened nor treated for diseases, pathogens, or parasites throughout the study. Bees were euthanised by freezing them in liquid nitrogen and stored at −20°C until further use.
DNA extraction
Intestines from 30 bees per hive collection were dissected, pooled, and ground in 30 mL sterile water using sterile mortars and pestles. The samples were then filtered using a 40 μm BD Falcon™ Cell Strainer (BD Biosciences, Mississauga, Ontario, Canada; catalogue no. 352340, MA) to remove debris, a procedure adopted by Martín-Hernández et al. (Reference Martín-Hernández, Meana, Prieto, Salvador, Garrido-Bailon and Higes2007) and also by the diagnostic laboratory of the Ministry of Agriculture, Fisheries and Agrifood of Québec (MAPAQ). The presence and number of Nosema species spores in all the bee samples was achieved using phase-contrast microscopy (600×) using a Bright-Line® Reichert 1492 hemacytometer (Hausser Scientific, Horsham, Pennsylvania, United States of America; catalogue no. 1492). Filtered samples were then pelleted by centrifugation at 9000 rpm for 12 minutes, the supernatant was discarded and the pellet used for DNA extraction. Fifty milligrams of 5-mm silica beads (BioSpec Products, Inc., Bartlesville, Oklahoma, United States of America; catalogue no. 11079105) and 400 μL buffer AP1 (QIAGEN, Mississauga, Ontario, Canada; catalogue no. 69104) were added to each pellet and lysed using a Precellys 24 (Bertin Technologies, Montigny-le-Bretonneux, France) for three cycles of 10 seconds at 5000 rpm with 5-second pauses between cycles. DNA was isolated from all samples using the DNeasy Mini Plant Kit (QIAGEN, Mississauga, Ontario, Canada; catalogue no. 69104) following the manufacturer's protocols. DNA was quantified using a NanoDrop ND-1000 Spectrophotometer (Thermo Scientific, Wilmington, Delaware, United States of America), and the quality was confirmed by running 100 ng of DNA on a 1% agarose (Applied Biological Materials Inc., Richmond, British Columbia, Canada; catalogue no. GO60-2) gel electrophoresis.
Primers and probes
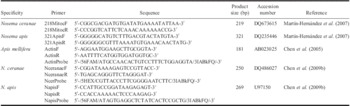
Already published species-specific primers for N. ceranae (218MITOC; GenBank accession no. DQ673615), and N. apis (NosApis; GenBank accession no. DQ235446) were synthesised by Alpha DNA (Montreal, Québec, Canada) resulting in amplified products of 219 base pairs (bp) and 321 bp, respectively, and were used in conventional PCR assays throughout the study (Table 1). For duplex qPCR, primer pairs for Nosema species were designed by Integrated DNA Technolgies using HPLC purification (Integrated DNA Technologies, San Diego, California, United States of America) on the previously published nucleotide sequences of N. ceranae (Nceranae; GenBank accession no. DQ486027), N. apis (Napis; GenBank accession no. DQ486027), and for A. mellifera β-actin (GenBank accession no. AB023025) resulting in amplified products of 250, 269, and 181 bp, respectively (Table 1). The fluorophores HEX, with absorbance and emission wavelengths of 535 and 556 nm, respectively, and FAM, with absorbance and emission wavelengths of 495 and 516 nm, respectively, were chosen for probe labelling due to their well separated absorbance and emission wavelengths. Already published sequences were used for probe design and synthesised by HPLC purification (Integrated DNA Technologies, San Diego, California, United States of America) (Table 1). The probe specific for N. ceranae was labelled with the HEX reporter dye at the 5′ end, while that for N. apis was labelled with the 6-FAM reporter dye at the 5′ end to allow for the amplification of both amplicons simultaneously in a duplex qPCR reaction. Both probes were labelled with Iowa Black® FQ at the 3′ end, with absorbance and emission wavelengths of 531 and 620 nm, respectively, which has sufficient overlap to act as a quencher dye. The housekeeping gene β-actin was labelled with the 6-FAM reporter dye at the 5′ end, and Iowa Black® FQ quencher dye at the 3′ end and used in a separate reaction from the Nosema species. All primers (Table 1) were first tested in conventional PCR assays to confirm that the designed primers amplify only the target and reference genes and the amplified products were sequenced and compared with sequences deposited in the GenBank database of National Center for Biotechnology Information (NCBI).
Primers and probes used for conventional and quantitative PCR.

Conventional PCR
DNA extracted from all samples was tested with primers sets specific to N. ceranae, N. apis, and A. mellifera actin in separate PCR reactions. Each reaction contained: 1× PCR buffer, 2 mM MgCl2, 0.2 mM each dNTP, 0.2 μM each primer, 0.5U recombinant Taq DNA polymerase (Fermentas Burlington, Ontario, Canada), and 250 ng DNA from bee intestines in a total volume of 12.5 μL. The thermal cycling conditions were as follows for all primer sets: one cycle of initial denaturation at 95°C for 10 minutes, followed by 35 cycles of denaturation at 95°C for 30 seconds, annealing at 60°C for 30 seconds, and extension at 72°C for 30 seconds, followed by one cycle of final extension at 72°C for 7 minutes using a GeneAmp® PCR System 9700 (Applied Biosystems, Streetsville, Ontario, Canada). All primer sets were run with a positive control and a negative control containing no template DNA. All samples were run on a 1% agarose (Applied Biological Materials Inc., Richmond, British Columbia, Canada; catalogue no. GO60-2) gel electrophoresis. The specificity of the PCR products was confirmed by purifying the PCR products by standard desalting using the QIAquick PCR Purification Kit (QIAGEN, Mississauga, Ontario, Canada; catalogue no. 28140), and the PCR products were sequenced at Genome Québec (Montreal, Québec, Canada). Sequences were compared with results deposited in the GenBank database of NCBI.
Recombinant plasmid DNA and standard curve construction
Purified A. mellifera actin amplicons were incorporated into a pCR2.1-TOPO® vector (Invitrogen, Carlsbad, California, United States of America; catalogue no. KNM455001) following the manufacturer's protocols. Purified N. apis and N. ceranae amplicons were each incorporated into pUC57 vector and cloned using the TOPO® TA-cloning Kit (Invitrogen, Carlsbad, California, United States of America; catalogue no. KNM455001) following the manufacturer's protocols. Plasmid DNA was purified using the PureLink™ Quick Plasmid Miniprep Kit (Invitrogen, Carlsbad, California, United States of America; catalogue no. K210010) and sent for sequencing at Genome Quebec (Montréal, Québec, Canada). Sequences were compared with results deposited in GenBank database of NCBI. The copy number of plasmid was calculated based on the concentration of purified plasmid DNA and the molecular mass of the plasmid (vector plus amplicon). A standard curve for A. mellifera actin was constructed based on the following copy numbers: 109, 108, 107, 106, 105, and 104, which is the range of actin copy numbers in the bee intestines. Separate Nosema species standards were constructed for the simplex qPCR assays containing the following copy numbers: 109, 108, 107, 106, 105, 104, 103, 102, 101, which spanned the infection levels of all samples. The sensitivity of the assays was determined by plotting the log-initial quantity of each dilution against the corresponding threshold value (C t). The amplification efficiency of each standard was calculated from the slope of each standard as follows: E = 10(−1/slope) − 1. Once optimised, the standards were combined for duplex qPCR reactions using the same copy numbers per reaction as for simplex. The reaction was then optimised until the efficiencies and C t values were similar to those for simplex. It was ensured that sensitivity was maintained by performing a duplex reaction with 109 copies of N. apis in combination with 102 copies of N. ceranae, and vice versa to make certain that high amounts of one species did not inhibit the amplification of lower titres of the other species.
Duplex quantitative real-time PCR
The infection levels of N. ceranae and N. apis were quantified in all samples by duplex qPCR using the Stratagene MxPro 3005. Each Nosema duplex amplification mixture contained: 1× PCR buffer, 2.5 mM MgCl2, 0.4 mM each dNTP, 0.3 μM each primer, 0.15 μM each probe, 2 μM ROX, 1.5U recombinant Taq DNA polymerase (Fermentas, Burlington, Ontario, Canada), and 250 ng DNA from bee intestines in a total volume of 25 μL. Apis mellifera actin was amplified in a separate mixture containing: 1× PCR buffer, 2.5 mM MgCl2, 0.4 mM each dNTP, 0.2 μM each primer, 0.075 μM probe, 2 μM ROX, 1.0U recombinant Taq DNA polymerase (Fermentas, Burlington, Ontario, Canada), and 250 ng DNA from bee intestines in a total volume of 25 μL. Actin and Nosema species qPCR reactions were run on the same plate for all samples. All qPCR reactions were run under the following conditions: one cycle of initial denaturation at 94°C for 10 minutes, followed by 45 cycles of denaturation at 95°C for 30 seconds, annealing at 55°C for 30 seconds, and extension at 68°C for 30 seconds. Standard curves and no-template controls were run with each plate. All samples were performed in duplicate technical runs. Amplification results were expressed as the threshold cycle (C t) value and converted to copy numbers by plotting the C t values against the standard curve. The coefficient of variation was calculated for each sample to ensure repeatability of amplification. The specificity of the duplex qPCR was confirmed by gel electrophoresis and sequence analysis to verify the correct size and specificity of the qPCR products.
Results
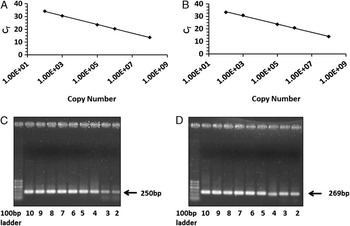
The duplex qPCR assay was optimised until the efficiencies and sensitivities of both Nosema targets were approximately equal. Optimisation was done originally on simplex reactions such that the efficiencies were 102.3% and 98.0% for N. ceranae and N. apis, respectively, while those for the duplex reactions were 101.9% and 96.6%, respectively, demonstrating reproducibility between the simplex and duplex reactions (Fig. 1). The sensitivity of each reaction was also similar in simplex versus duplex reactions at 100 copies/reaction and 70 copies/reaction for N. ceranae and N. apis, respectively, demonstrating lower detection threshold levels than the traditional microscope-based spore count method with a threshold of 10 000 spores/bee. The R 2 value demonstrates the linearity of the standard curves, and was calculated to be 0.995 and 0.993 for N. ceranae and N. apis, respectively, in the duplex reaction. The coefficient of variation was low for both N. ceranae (0.91; n = 129) and N. apis (1.05; n = 129) demonstrating reproducibility of the duplex qPCR (data not shown).
Standard curves for duplex qPCR assay of Nosema ceranae and Nosema apis. Copy numbers are represented on the x-axis with C t values on the y-axis. Standard curves were developed using a 10-fold serial dilution of species-specific recombinant plasmid DNA. Gel electrophoresis was performed on standards to ensure primer specificity using a 1.5% agarose gel and stained with ethidium bromide. (A) Standard curve of N. ceranae, (B) standard curve of N. apis, (C) gel electorphoresis of N. ceranae standard curve, and (D) gel electrophoresis of N. apis standard curve. Gel lane numbers represent the log10 value of the dilution.

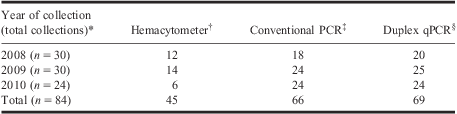
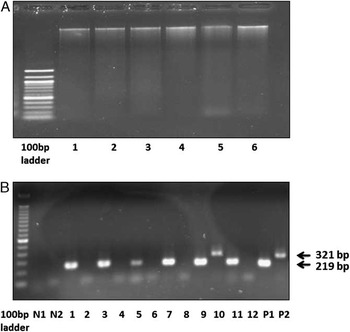
All samples were tested for the presence of Nosema species using the microscopic spore counts, conventional and duplex qPCR. Microscopic spore counts revealed that 53.6% of the 84 collections contained Nosema spores (Table 2) with counts ranging from 0 to 10 million spores per bee (data not shown). Samples containing visible spores by microscopic spore counts tested positive for at least one species of Nosema using conventional PCR or duplex qPCR techniques. DNA extracted from 30 bees proved to be of high quality that could successfully be amplified by conventional PCR using the 16S rRNA species-specific primers for N. ceranae and N. apis, with the expected respective amplicon sizes of 219 and 321 bp (Fig. 2). β-actin was amplifiable in all samples with an amplicon size of 181 bp demonstrating that samples which tested negative for either Nosema species were not causing PCR inhibition and represent true negatives (data not shown).
Comparison of different methods for detection of Nosema species in naturally infected hives.
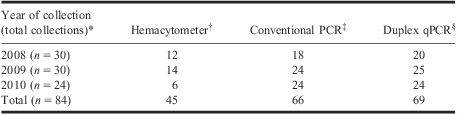
*Numbers represent total positive collections using various detection methods. Collections were done from six different hives during 14 months over 3 years for a total of 84 collections. A collection refers to a sample containing 30 bees from one hive for a given month.
†Hemocytometer counts were done by taking four 10 μL samples from a homogenate containing 30 bee intestines and the number of spores counted at 600× magnification.
‡Collections producing a PCR product detectable by gel electrophoresis for either Nosema species were considered positive for conventional PCR.
§Collections producing a C t value for duplex qPCR for either Nosema species were considered positive collections.
PCR, polymerase chain reaction.
Gel electrophoresis of bee DNA extracted from bee intestines for six hives during September 2008 (A) and amplified using species-specific primers (B). (A) 100 ng DNA from bee intestines for six hives (lanes 1–6) during September 2008. (B) PCR amplification of 250 ng DNA (lanes 1–12) using primers specific to Nosema ceranae (219 bp) and Nosema apis (321 bp). DNA was extracted from tissue and examined for the presence of N. ceranae and N. apis using conventional PCR methods and 1.5% agarose gel electrophoresis. For each sample, N. ceranae then N. apis PCR products were loaded in neighbouring lanes. All samples were positive for N. ceranae, while sample 5 showed mixed infections (lanes 9 and 10). N1 indicates the negative control for N. ceranae, N2 for N. apis. P1 indicates the positive control for N. ceranae, P2 for N. apis. The size of the PCR fragment is indicated on the right.

Conventional PCR and duplex qPCR showed similar results with 78.6% and 82.1% of the collections testing positive for Nosema species, respectively (Table 2). Using microscopic spore counts, 39 of the 84 collections did not contain visible spores; however, of these, 24 (61.5%) tested positive with duplex qPCR techniques (Table 2). A strong correlation of r = 0.7083 (P < 0.0001; n = 42) was observed when comparing spore counts and duplex qPCR results (data not shown).
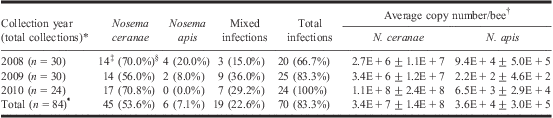
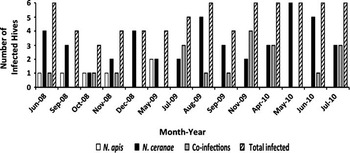
Duplex qPCR showed that the presence of N. ceranae is more prevalent than that of N. apis with 76.2% of the collections having tested positive as single (53.6%) or mixed infection (22.6%), while 29.7% of the total collections had N. apis present as single (7.1%) or mixed infections (22.6%) (Table 3). The amount of hives infected with only N. ceranae increased from year to year throughout the study, with the highest prevalence occurring in 2010, while those infected with only N. apis decreased, and mixed infections remained relatively stable throughout the 3-year study (Table 3 and Fig. 3). Overall, the number of hives infected by Nosema spp. increased throughout the 3-year study (Fig. 3).
Positive Nosema species infections in honey bee intestines using duplex qPCR.
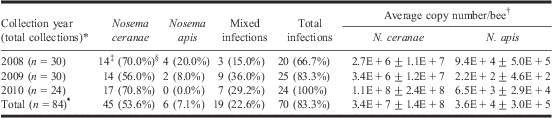
*n represents total number of collections. Each collection represents a sample of 30 bees from one hive for a given month.
†Average copy numbers represent the average duplex qPCR copy number per year ± standard deviation. Copy numbers were quantified by converting C t values to copy numbers using the standard curve method.
‡Numbers represent single Nosema species infections (N. ceranae or N. apis only) or mixed-infections (N. ceranae and N. apis) using duplex qPCR. Intestines were dissected from 30 bees per sample.
§Numbers in brackets for single and mixed infections represent the percentage of total infected collections.
¶Numbers in brackets for total infections represent the percentage of total collections.
Prevalence of Nosema ceranae and Nosema apis in a Québec apiary over a 3-year period using duplex qPCR. Prevalence was determined by calculating the number of positive hives for either N. ceranae, N. apis, or both species using duplex qPCR. Total number of hives infected for each collection month was calculated. ( ) N. apis, (
 ) N. ceranae, (
 ) co-infections, (
 ) total number of hives infected for the collection month.

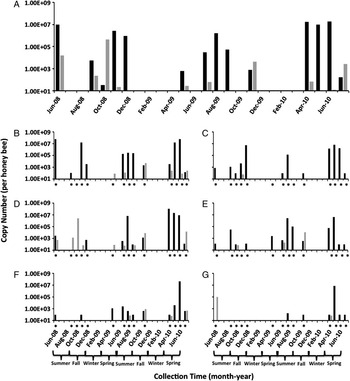
Seasonal patterns of the two Nosema species using qPCR copy numbers show that average infection levels of N. ceranae were higher than N. apis levels throughout most months of the study (Fig. 4A). For the years 2008 and 2009, N. apis was present in June, with a decrease in the summer months and a substantial increase in the fall, and in 2010 infection levels occurred and steadily increased in July (Fig. 4). In 2008, N. ceranae infections peaked in early summer and late autumn (Fig. 4). In 2009, the copy numbers of N. ceranae were low in the spring with an increase in the summer months, while in 2010 infection levels peaked in the spring with a sharp drop during early summer (Fig. 4). Average yearly copy numbers for both species varied with N. apis ranging from a low number of 220 copies/bee in 2009 to a high number of 94 000 copies/bee in 2008, while those for N. ceranae ranged from 2.7 million copies/bee in 2008 to 110 million copies/bee in 2010 (Table 3; Fig. 4A). High variation in yearly copy numbers was observed as infection rates varied from month to month and hive to hive with detection levels ranging from 0 to 27 million copies per bee for N. apis, and 0 to 110 million copies per bee for N. ceranae using duplex qPCR techniques (Table 3; Fig. 4B–4G).
Average seasonal patterns (A) and infection levels in each hive (B–G) of N. ceranae and N. apis over a period of 3 years using duplex qPCR. Copy numbers were quantified by converting C t values to copy numbers using the standard curve method. Copy numbers represent the average duplex qPCR count of six hives for each month. Yearly seasons are indicated below the graph. (A) Average seasonal patterns of all six hives and (B–G) seasonal patterns in individual hives. *(Asterisks) represent months in which collections were made. Collection months with asterisks and no bars indicate collections that were infection-free. ( ) N. ceranae and (
 ) N. apis.

Discussion
The results of this study demonstrate that duplex qPCR is a more sensitive technique for detecting the presence of Nosema species infections when compared with traditional microscopic spore counts and conventional PCR. These findings are consistent with previously published data (Bourgeois et al. Reference Bourgeois, Rinderer, Beaman and Danka2010; Traver and Fell Reference Traver and Fell2011). The duplex qPCR assay generated higher copy numbers of Nosema than microscope-based spore counts. This is attributable to the presence of the vegetative stage of Nosema species in the midgut epithelium of the bees that otherwise escapes detection when using the microscope-based assay, as well as the potential for each spore to contain more than one gene copy (Higes et al. Reference Higes, García-Palencia, Martín-Hernández and Meana2007; Higes et al. Reference Higes, Martín-Hernández, Botías, Bailón, González Porto and Barrios2008; Bourgeois et al. Reference Bourgeois, Rinderer, Beaman and Danka2010; Traver and Fell Reference Traver and Fell2011). When spores were present, spore counts correlated strongly with qPCR results (r = 0.7083; P < 0.0001; n = 42). Bourgeois et al. (Reference Bourgeois, Rinderer, Beaman and Danka2010) reported a similar correlation between microscope-based spore counts and qPCR results (r = 0.743; P < 0.0001). These results suggest that qPCR copy numbers can be reliably used to determine actual spore counts of infected hives. In addition, compared with conventional PCR assays, the number of positive samples with mixed infections was higher when using duplex qPCR due to the lower detection threshold of TaqMan® probes compared with DNA staining with ethidium bromide, a finding that is in agreement with the results of Traver and Fell (Reference Traver and Fell2011).
Overall, the prevalence of N. ceranae was higher (76% of total collections) than that of N. apis (29.7%). In most cases of mixed infections, the number of N. ceranae gene copies (corresponding to the parasite load) significantly outnumbered those of N. apis. These results are in agreement with other studies conducted in Europe, United States of America, and Asia (Chauzat et al. Reference Chauzat, Higes, Martín-Hernández, Meana, Cougoule and Faucon2007; Chen et al. Reference Chen, Evans, Zhou, Boncristiani, Kimura and Xiao2009b; Runckel et al. Reference Runckel, Flenniken, Engel, Ruby, Ganem and Andino2011; Traver and Fell Reference Traver and Fell2011). In the case of N. apis, its prevalence as single infections decreased throughout the study until all infections were present only as mixed infections in 2010, and supports the hypothesis that N. ceranae is currently displacing N. apis (Klee et al. Reference Klee, Besana, Genersch, Gisder, Nanetti and Tam2007; Martín-Hernández et al. Reference Martín-Hernández, Meana, Prieto, Salvador, Garrido-Bailon and Higes2007; Traver and Fell Reference Traver and Fell2011).
The variations in seasonal patterns from year to year as well as the small sample size (n = 6) accounted for the high standard deviation observed for average seasonal copy numbers (Table 3), and are similar to results reported in other studies (Bourgeois et al. Reference Bourgeois, Rinderer, Beaman and Danka2010; Runckel et al. Reference Runckel, Flenniken, Engel, Ruby, Ganem and Andino2011; Traver and Fell Reference Traver and Fell2011). Larger studies may have decreased the high deviations observed. In the case of N. apis, infections tended to peak before N. ceranae infections. These findings are consistent to those for N. apis in similar climates (Bailey Reference Bailey1955) although the spring peak occurred towards late spring rather than early spring. Seasonal variations in N. apis infection levels have been linked to honey bee phenology with the longer living winter bees having highest levels of infection in the spring due to their prolonged exposure to the parasite (Bailey Reference Bailey1955; Fries Reference Fries2010). Levels then tend to drop off during the summer buildup of the hive and increase again towards the end of the season when the parasite has had time to reproduce and infect more individuals (Bailey Reference Bailey1955). Interestingly, N. apis peaks appear to have shifted suggesting that seasonal patterns may be affected by N. ceranae or other undiscovered underlying causes. Larger studies throughout the province of Québec are required, in order to gain more conclusive results on the seasonal patterns of both Nosema species as single and co-infections.
Few studies had reported on prevalence of Nosema species in Canada (Williams et al. Reference Williams, Shafer, Rogers, Shutler and Stewart2008; Hamiduzzaman et al. Reference Hamiduzzaman, Guzman-Novoa and Goodwin2010; Pernal et al. Reference Pernal, Ibrahim and Melathopoulos2010), however, only one study described the seasonal distribution and pattern of N. ceranae (Pernal et al. Reference Pernal, Ibrahim and Melathopoulos2010). According to our knowledge, studies on prevalence and seasonality of Nosema species in Québec are lacking which prompted us to conduct this 3-year study. Infection levels of N. ceranae in this study peaked in the summer months of 2009, when levels are typically believed to be at their lowest, although summer peaks have been observed in other studies in Canada and elsewhere (Martín-Hernández et al. Reference Martín-Hernández, Meana, Prieto, Salvador, Garrido-Bailon and Higes2007; Pernal et al. Reference Pernal, Ibrahim and Melathopoulos2010). Our study showed that the seasonal patterns of N. ceranae both support (Gisder et al. Reference Gisder, Hedtke, Mockel, Frielitz, Linde and Genersch2010; Runckel et al. Reference Runckel, Flenniken, Engel, Ruby, Ganem and Andino2011; Traver and Fell Reference Traver and Fell2011) and dispute (Martín-Hernández et al. Reference Martín-Hernández, Meana, Prieto, Salvador, Garrido-Bailon and Higes2007) recent findings as seasonal variations did occur although they varied from year to year. The reasons for the variations in infection levels are unclear and potential causes for these variations, including hive management practices, require further investigation. Interestingly, our findings showed that all six hives survived the 3-year study, and were able to recover from N. ceranae infections over 10 million genome copies per bee without any disease treatment, nor the need to requeen. Previous studies suggested population decline after 1 year of N. ceranae infection within hives (Higes et al. Reference Higes, Martín-Hernández, Botías, Bailón, González Porto and Barrios2008). The ability of the hives to survive in this study may be due to a number of factors including the subspecies of honey bees used or a different and less virulent strain of N. ceranae being present (Henriques Reference Henriques2009; Higes et al. Reference Higes, Martín-Hernández and Meana2010; Sagastume et al. Reference Sagastume, del Águlla, Martín-Hernandez, Higes and Henriques-Gil2011).
In conclusion, our study provides information on the status of nosemosis in an apiary located in Deschambault, Québec: (i) Nosema species are present as single and co-infections in Québec, (ii) the high prevalence of N. ceranae at the apiary suggests that the microsporidium may be widespread under natural conditions in worker bees (Higes et al. Reference Higes, Martín-Hernández and Meana2010), (iii) in the tested apiary, the prevalence of N. ceranae is much higher than that of N. apis, considered until recently as the most common microsporidium infecting honey bees, and (iv) the seasonal distribution of both species are different. These results agree with data collected in other geographical areas (Martín-Hernández et al. Reference Martín-Hernández, Meana, Prieto, Salvador, Garrido-Bailon and Higes2007; Higes et al. Reference Higes, Martín-Hernández, Botías, Bailón, González Porto and Barrios2008; Giersch et al. Reference Giersch, Berg, Galea and Hornitzky2009; Traver and Fell Reference Traver and Fell2011). The extent of infected samples detected over the 3-year study indicates that N. ceranae is present in Québec, however, more intensive studies covering different regions and apiaries are required to gain further insights into the prevalence and severity of nosemosis in Québec.
Acknowledgements
We would like to thank members of the Centre de recherche en science animale de Deschambault (CRSAD), Quebec, for providing the samples for this project. This work was supported by the Ministère d'agriculture, pêcheries et alimentation de Québec (MAPAQ), and in part by the Natural Sciences and Engineering Research Council of Canada (NSERC).