

Introduction
For decades, a small school district in the upper Midwest of the USA has been struggling with kindergarten readiness. Administrators have tried a long list of solutions with little success, leaving the District Superintendent, Greta, at her wit's end. Mason, a new member of the school board and devoted follower of the science of early education, had recently read an article about an early education field experiment with impressive results: peer reviewed by academic experts, the study showed large treatment effects on several school readiness indicators. At the end-of-the-year school board meeting, while others discussed the district's woes, Mason brought up the idea of implementing a similar program, a potential silver bullet to address the district's pervasive issues with kindergarten readiness. “The benefit–cost ratio is astronomical,” he assured Greta and the rest of school board. Armed with the science, and associated statistical jargon that few could understand, the school board chose to trust Mason and adopt the program.Footnote 1
That fall, the school district began to introduce the program, rolling it out in an experimental fashion so that officials could credibly isolate the program's impacts and prove its benefits to the community. At every fish fry and rotary club meeting they attended, Greta and Mason mentioned the program. “Just wait until these students apply to college – our first Harvard matriculants are coming soon,” Mason boasted at the Lion's Club pancake breakfast.
After one year, the results arrived. Mason and Greta pored over the costs, benefits and outcomes, as measured by standardized cognitive and behavioral tests. The results: unequivocally mediocre. The program did not even pass a benefit–cost (BC) test, much less yield the silver bullet that was promised. “I guess the science got it wrong this time,” Mason concluded.
But did it?
As academics, we believe that the science likely had it right, but that the results were over-interpreted. The program that Greta and Mason tried to replicate could never carry the water that Greta and Mason had hoped. Indeed, moving from an initial research study to one that will have an attractive BC profile at scale is much more complex than most imagine.
This is not to focus criticism on field experiments. Quite the opposite, as field experiments have contributed immensely to the ‘credibility revolution’ of the last three decades in the social sciences (see Harrison & List, Reference Harrison and List2004). In this way, field experiments have become a useful tool for providing causal estimates that are difficult to obtain using other approaches. Yet, while field experiments have focused primarily on testing theories, uncovering mechanisms and estimating program effects, the question of how to actually use those experimental insights for policymaking remains poorly understood.
One can glean this fact from asking a simple question about the opening vignette: What went wrong in the school district's scaling of the original, successful field experiment? Maybe the original study was a false positive, whereby the received evidence was not yet actionable? Perhaps there was a ‘voltage effect’ (see, e.g., Kilbourne et al., Reference Kline and Walters2007; Gottfredson et al., Reference Gottfredson, Cook, Gardner, Gorman-Smith, Howe, Sandler and Zafft2015; Supplee & Metz, Reference Tuttle, Gill, Gleason, Knechtel, Nichols-Barrer and Resch2015; Supplee & Meyer, Reference Supplee, Kelly, MacKinnon and Barofsky2015; Cheng et al., Reference Cheng, McDonald, Cheung, Arciero, Qureshi, Jiang and Chan2017) because Greta's school district changed core components of the program or failed to hire high-quality instructors. The term ‘voltage effect’ or ‘voltage drop’ describes the phenomenon of the measured program benefit in the original research study being significantly larger than the measured benefit when that program is implemented at larger scale. Maybe the cost per student was much larger at scale than at the research site because in order to hire enough high-quality teachers the district had to pay much higher wages than the research study paid their handful of teachers.
Our study is motivated by the goal of digging into the economics of scaling. To date, this literature has largely been devoid of economics, focusing instead on the tools of implementation experts. Yet, a natural progression of the field revolves around the query: How can we combine economics with the experimental method to inform policy at scale? We view this query as the most important question facing evidence-based policymaking today. Indeed, the chain connecting initial research discovery to the ultimate policy enacted has as its most susceptible link an understanding of the science of scaling.Footnote 2 Existing discussions of scaling emphasize fidelity of implementation and the identification of core components, with work thus far focusing on certain aspects of the benefit side, or the ‘voltage drop’ of treatment.
Beyond providing insights into the science of using science (epistemology), we view our work as representing a natural progression of field experiments in the social sciences. In the previous 25 years, field experiments have become an increasingly popular method in economics for providing causal estimates across a variety of settings, addressing issues as far ranging as: why people give to charitable causes; why people discriminate; and why some schools fail to meet standard metrics. The next frontier is to focus more keenly on how we can generate credible and scalable results that policymakers can trust when implementing programs. Providing insights into how results scale to the broader population is critical to ensuring a robust relationship between scientific research and policymaking. Without such an understanding, empirical research can quickly be undermined in the eyes of the policymaker, the broader public and the scientific community itself.
We augment this literature by introducing an economic lens in two key ways. First, we approach the problem through the lens of economic incentives and markets. By recognizing the various incentives of the actors in the scientific market of knowledge creation, we can understand, recognize, describe and propose nudges to the important factors that threaten scaling of original research interventions within a logical and coherent economic framework. Second, we apply economic tools to quantify and clarify changes to benefits and costs when a program is scaled. In this manner, we are effectively shifting the discussion from a purely benefit-driven exploration to one where both benefits and costs are considered, revolving around the problem of the ‘scale-up effect’. To our knowledge, little economics has been brought to the voltage question, much less to the larger scale-up effect problem (yet, the interested reader should see, e.g., Akram et al., Reference Akram, Chowdhury and Mobarak2017; Al-Ubaydli et al., Reference Al-Ubaydli, List, LoRe and Suskind2017a, Reference Al-Ubaydli, List and Suskind2017b, Reference Al-Ubaydli, List and Suskind2019; Banerjee et al., Reference Banerjee, Banerji, Berry, Duflo, Kannan, Mukerji and Walton2017; Davis et al., Reference Davis, Guryan, Hallberg and Ludwig2017; Muralidharan & Niehaus, Reference Muralidharan and Sundararaman2017; Ashraf et al., Reference Ashraf, Bandiera and Lee2018).
As our inspiration, we use the model of Al-Ubaydli et al. (Reference Al-Ubaydli, List and Suskind2019). In that study, the authors created a theoretical framework with three players: (1) government policymakers, who aspire to implement programs that work at scale to maximize expected benefits minus expected costs; (2) researchers, who desire to report both important treatment effects and replicable findings; and (3) the general populace, which maximizes its utility (or satisfaction). Putting these three players together in a market for scientific knowledge creation, and recognizing the individual incentives of each, provides a useful roadmap that offers new insights into the threats to scalability and points to areas where more empirical work is necessary.
Similar to Al-Ubaydli et al. (Reference Al-Ubaydli, List, LoRe and Suskind2017a, Reference Al-Ubaydli, List and Suskind2017b, Reference Al-Ubaydli, List and Suskind2019), to characterize scalability and highlight certain relevant threats, we divide the problem into three categories. The first involves the statistical procedure applied to the data gathered. This can be viewed as the approach to asking: When is evidence actionable? Publishing a result in a reputable, peer-reviewed journal does not automatically constitute sufficient evidence for a policymaker to be confident that the result represents a ‘true effect’ of the program. Not only do “researchers and policymakers often have different notions of evidence” (Davies, Reference Davies2012), but there is no one definition of evidence within research or policy worlds. In this first component, we define a notion of actionable evidence to provide guidance to policymakers and researchers (one might argue that premature action is a key issue with scaling; see Ioannidis, Reference Ioannidis2005, for a review in clinical research).
One proposal from this category is a simple piece of advice to policymakers: we need more precise statistical summaries and more frequent replication to help address inference problems. We advocate that a post-study probability (PSP) of at least 0.95 is achieved before enacting policies. In practice, this amounts to three or four well-powered independent replications of the original finding. This is, of course, ad hoc, but will naturally lead to demand for a greater number of replications and a subsequent change in our research reward structure. In equilibrium, more dollars for replications from funding agencies would be a natural outcome. This landscape change would be welcome given the current credibility crises in science (Jennions & Moller, Reference Jennions and Moller2001; Ioannidis, Reference Ioannidis2005; Bettis, Reference Bettis2012; Nosek et al., Reference Obama2012, Camerer et al., Reference Camerer, Dreber, Forsell, Ho, Huber, Johannesson, Kirchler, Almenberg, Altmejd, Chan, Heikensten, Holzmeister, Imai, Isaksson, Nave, Pfeiffer, Razen and Wu2016).
Second, the model discusses representativeness of the population, which surfaces continuously throughout the empirical literature as a general topic in the social sciences. Following the vignette above, in the original study, the researcher might have sought a population that minimized participation costs, or perhaps a population that had characteristics that might yield a larger treatment effect (a ‘let's give the idea its best shot of working’ approach). Greta's school district might have had students with very different characteristics, including observables like demographics and educational background that did not match the original study. Maybe even the school district had a random sample of children, but the original research did not. In a nutshell, researcher choice/bias, selection bias/sorting of the study's population into the program, non-random attrition and (dis)economies of scale in participation costs all affect the representativeness of the population studied, and this might impact the promise of scaling (see Bell & Stuart, Reference Bell and Stuart2016).
Our third category of threat involves a summary of issues surrounding the representativeness of the situation. While the focus of the implementation science literature has been program fidelity, situational features in practice are much richer, and we discuss various aspects of the situation that have implications for the scalability of the BC ratio. Indeed, the research and policy communities oftentimes generalize results to both a population of situations and a population of people, even though we often only speak of the latter. This is particularly troubling considering that the data, thus far, suggest that representativeness of the situation is much more important than representativeness of the population (see, e.g., List, Reference List2006).
For instance, when Greta's school district scaled up the kindergarten readiness program, they did it within their infrastructure, which might have been entirely different from that of the original study. If the original results are dependent on the specific context or are not done in a policy relevant environment, we can expect the BC profile to change at scale. The implementation literature sometimes calls this context-dependence. Likewise, in conjunction with curriculum specialists, the original researcher created a curriculum for a pre-kindergarten program, trained the teachers and provided hands-on support throughout the program. When the school district scaled up the program, they might not have used the exact same curriculum and care as the original implementation due to local constraints. This is often described as ‘program drift’ in the literature.
Another key aspect of the situation pertains to spillovers (network effects) and the general equilibrium (GE) effects of scaling. Concerning the Midwestern school district, spillovers could be negative from the treated group to the control group. While the intervention improves the school performance of students in a given class, the control group may, upon seeing an initial improvement in the performance of the treated group, feel demoralized, inducing a deterioration in their performance, accentuating the measured treatment effect (psychologists denote this effect as ‘resentful demoralization’). Of course, the effect could run in the opposite direction. For example, List et al. (Reference List, Shaikh and Xu2019) provide such an example in their measurement of the effects of a pre-kindergarten intervention in Chicago: control group children gain more than 0.5 standard deviations in cognitive test scores based on proximity to treated neighbors. This implies that the program may be much more effective at scale than the original research suggests. Such spillovers can also occur within treatment or control groups, positively or negatively magnifying effects. In addition to within- and between-treatment spillover effects, there is also the possibility of spillovers from the treated group to people who are not even participating in the experiment (i.e., people beyond the control group; the interested reader should see Banerjee et al., Reference Banerjee, Banerji, Berry, Duflo, Kannan, Mukerji and Walton2017; Muralidharan & Niehaus, Reference Muralidharan and Sundararaman2017).
Representativeness of the population and the situation as potential threats to scalability underline how fundamental it is to understand ‘sites’ (i.e., the environment where the original research was implemented) to address the scale-up problem. The literature treats ‘sites’ loosely, where some disciplines focus on the population of sites while others emphasize the situational characteristics. We define ‘sites’ as having multidimensional characteristics, which our theory guides into population and situational categories. It is thus critical for researchers to comprehensively describe the environment where the research is carried out, going beyond a cursory description.
We do not view our insights as limited to helping policymakers. By highlighting the key potential economic sources threatening the scalability of programs and bringing them to the attention of researchers, we hope that those preparing to conduct new studies might consider modifying their own designs such that their reported treatment effect estimates more accurately inform what is likely to occur should the program be scaled. In this way, the new demand on scholars is that we backward induct when setting up our original research plan to ensure accurate and swift transference of programs to scale with minimal uncertainty.
In this manner, our research advocates flipping the traditional knowledge creation model, calling on scholars to place themselves in the shoes of the policymakers whom they are trying to influence. While we put forward 12 proposals that span researchers, policymakers, funders and stakeholders, our general call is for policy research that starts by imagining what a successful intervention would look like fully implemented in the field, applied to a policy-relevant subject population and situation, sustained over a long period of time and working as it is expected because its underlying mechanisms are understood.
The remainder of our study proceeds as follows. The next section defines the scale-up effect and provides an overview of select interventions that worked successfully at scale and interventions that showed less evidence of success at scale. The section following this defines the knowledge creation market and outlines the theoretical model. The ‘Implications of the model’ section highlights predictions from the model and summarizes our 12 proposals. We conclude with a summary highlighting the importance of understanding the science of using science.
Defining the scale-up effect and summary evidence of scaling exercises
Policymakers inform policies through results from programs that have high, attractive BC measures. This evidence often comes in the form of a large measured treatment effect, or benefit, in a small-scale randomized controlled trial (RCT).Footnote 3 In policymaking and the scientific community, it is considered a disappointing surprise when large-scale policy implementation does not result in the same benefit profile as a small-scale RCT program evaluation. The implementation literature refers to this problem as the voltage effect. To avoid confusion between the voltage effect and the gross scaling effect, which also considers the cost side of the equation according to our definition, we use a new term, ‘scale-up effect’, which refers to changes in the net treatment effect resulting from changes in scale. That is, we include both benefits and costs when considering scaling. In the following sections, we disentangle the scale-up effect into mechanisms through which the benefits and/or costs change from small to large scale. Each mechanism is placed into one of our three categories.
The scale-up effect can also be interpreted broadly within the context of the generalizability of experimental results (Al-Ubaydli & List, Reference Al-Ubaydli, List, Frechette and Schotter2013). In most cases, many scholars view generalizability as ‘horizontal scaling’, or whether the empirical results generalize across space and time. Alternatively, the scale-up effect is ‘vertical scaling’, or whether the measured BC profile calculated in small-scale RCTs can be generalized to larger-scale environments.
While we view our economic approach to the scale-up problem as having several novel elements, we are not occupying virgin territory. Many entities involved in the generation of scientific knowledge have acknowledged the importance of the scale-up effect in their framework, though there are no uniform broad guidelines on how to address them. For example, the Institute of Education Sciences’ (IES) five goals are a useful framework within which to consider the scale-up effect in education. Their Goal 4, Effectiveness, is the stage at which research determines whether programs will be effective within “routine practice in authentic education delivery settings,” or whether the effects of a program remain even in a more natural context.Footnote 4
Similarly, using the Institute of Medicine (IOM) T0 to T4 translational research framework, our model describes the progression from T2 to T3 and T4.Footnote 5 Likewise, in the language of the National Institutes of Health (NIH) National Center for Advancing Translational Sciences, we focus on research moving from the ‘Clinical Implementation’ to the ‘Public Health’ stage, where researchers attempt to bring promising interventions to a wider population.Footnote 6 The NIH emphasizes the distinction between efficacy trials that mirror our idea of program evaluation and effectiveness trials that describe our policy scale-up (Bauer et al., Reference Bauer, Damschroder, Hagedorn, Smith and Kilbourne2015). Finally, the Food and Drug Administration (FDA) has a rigorous five-step drug approval process. Our model of scale-up is similar to their Step 3, Clinical Research, to Step 5, Post-Market Safety Monitoring.Footnote 7 Our focus is social programs that may become policy, while the FDA is dedicated to medical drugs, but the approach is similar – we chart the process from small-scale research to large-scale effectiveness.
Summary of scaling evidence
Across different disciplines, there are examples of RCTs or program evaluations that have been successfully implemented at scale. However, these are the minority. In the cases of both successes and failures, our theoretical framework aids in explaining, or hypothesizing about, the potential causes of these outcomes.
The Knowledge is Power Program (KIPP) network of charter schools is an example of successful scaled-up implementation of an initial RCT evaluation. Early on, it had shown promising positive results on student achievement at smaller scales (Angrist et al., Reference Angrist, Dynarski, Kane, Pathak and Walters2012; Tuttle et al., Reference Tuttle, Gleason, Knechtel, Nichols-Barrer, Booker, Chojnacki and Goble2013), and the main empirical results were replicated in larger-scale RCTs (Tuttle et al., Reference Vivalt2015; Knechtel et al., Reference Komro, Flay, Biglan and Wagenaar2017). Our theory described below suggests that these results are not surprising, as across this horizontal scaling, the key mechanisms driving the scale-up problem were turned off: representative population of students who typically attend the schools, fidelity of curriculum implementation, infrastructure, quality of teachers, etc. If KIPP is further scaled, the theory pinpoints several potential threats: long school days and the school year (implementation cost), selective teacher hiring (implementation cost) and selection of students into KIPP (selection bias/sorting), among others.
Another successful scaling example is the California Greater Avenues for Independence (GAIN) welfare-to-work program in the late 1980s and early 1990s. In an initial RCT in six counties in California, one of the counties in particular (Riverside County) showed promising results in increasing the employment and earnings of the participants (Riccio et al., Reference Rudd1994; Freedman et al., Reference Freedman, Friedlander, Lin and Schweder1996). A few years later, this same model was implemented in the much larger Los Angeles County, and the positive effects on employment and earnings were replicated at scale (Freedman et al., Reference Freedman, Knab, Gennetian and Navarro2000). Although it is difficult to pin down the exact reasons for this success, the continuous involvement of the Department of Public Social Services in charge of the overhauling of the program played a key role in shutting down the potential mechanisms that threaten scalability. This points to the importance of the involvement of the original scientist/implementer, as we suggest below.
While these examples highlight successful scaling cases, results of program evaluations that were not replicated in larger-scale RCTs, or when implemented at a larger scale by policymakers, appear more numerous in the literature. Some of these unsuccessful examples belong to what our model describes as the statistical inference problem. Collaborative Strategic Reading (CSR) is a program designed to increase reading comprehension that showed positive results in quasi-experimental settings. However, in an RCT, Hitchcock et al. (Reference Hitchcock, Dimino, Kurki, Wilkins and Gersten2011) find no meaningful effect of the scaled program. Project CRISS, a teacher professional development program designed to improve students’ literacy, had initial positive results in an early, small-sample RCT (Horsfall & Santa, Reference Horsfall and Santa1985). These results were overturned in a more rigorous, larger RCT (Kushman et al., Reference Levitt and List2011). According to Straight Talk on Evidence, and across disciplines ranging from business to medicine, education to employment training, between 50% and 90% of results fail to replicate.Footnote 8 These would have been examples of premature action had policymakers decided to scale up these programs based on the early positive results, which emphasizes the importance of using metrics such as PSP (Maniadis et al., Reference Miguel and Kremer2014) that we describe below.
Exploring data from a non-representative population is our second category of potential threat to scalability. One example is a policy that approved the sale of iron-fortified salt to the general public in India based on positive results of studies that focused on adolescent women. Banerjee et al. (Reference Banerjee, Barnhardt and Duflo2015a) find that the fortified salt had no effect on the policy goal of reducing general anemia (even though they do observe effects on the group targeted (adolescent women) by previous studies). This is an example where the policy did not consider the representativeness to the broader policy population. In other cases, a subsequent evaluation was not carried out, but aspects of the initial RCT suggest that the results are unlikely to be replicated if the program was implemented at a larger scale.
A different group of unsuccessful implementations can be linked to situational unrepresentativeness. After promising initial results from the Tennessee STAR project that reduced class sizes, a series of implementations failed to replicate its success. In line with STAR, Tennessee rolled out two initiatives – Program Challenge and Basic Education Program – but neither of them replicated the earlier results (Hippel & Wagner, Reference Hippel and Wagner2018). In the former program, the resources were not used to reduce class size (i.e., wrong program), and in the latter program, class size reduction was negligible (i.e., wrong dosage).
California tried its class size reduction program statewide. However, for its implementation it had to hire many more teachers than the original research, and this led to the hiring of teachers with little teaching experience or full certification compared to the initial STAR project (Jepsen & Rivkin, Reference Jepsen and Rivkin2009). As the above examples highlight, fidelity of implementation is a key scalability threat (see also Kilbourne et al., Reference Kline and Walters2007; Gottfredson et al., Reference Gottfredson, Cook, Gardner, Gorman-Smith, Howe, Sandler and Zafft2015; Supplee & Metz, Reference Tuttle, Gill, Gleason, Knechtel, Nichols-Barrer and Resch2015; Supplee & Meyer, Reference Supplee, Kelly, MacKinnon and Barofsky2015; Cheng et al., Reference Cheng, McDonald, Cheung, Arciero, Qureshi, Jiang and Chan2017). A survey report by the US Department of Education (Crosse et al., Reference Crosse, Williams, Hagen, Harmon, Ristow, DiGaetano and Derzon2011) shows that among the prevention programs attempting to attenuate youth substance abuse and school crime implemented during the 2004–2005 school year, only 8% of them were backed by reasonable research evidence, and shockingly, of those 8%, more than 50% had not met fidelity standards in their implementation.
These examples show the importance of the scale-up problem, but, more subtly, they also draw our attention to the roles played by different stakeholders in the knowledge creation market in contributing to this problem. The incentives of the different agents must be aligned if we want to address this problem. We turn to this market next.
The knowledge creation market and the model
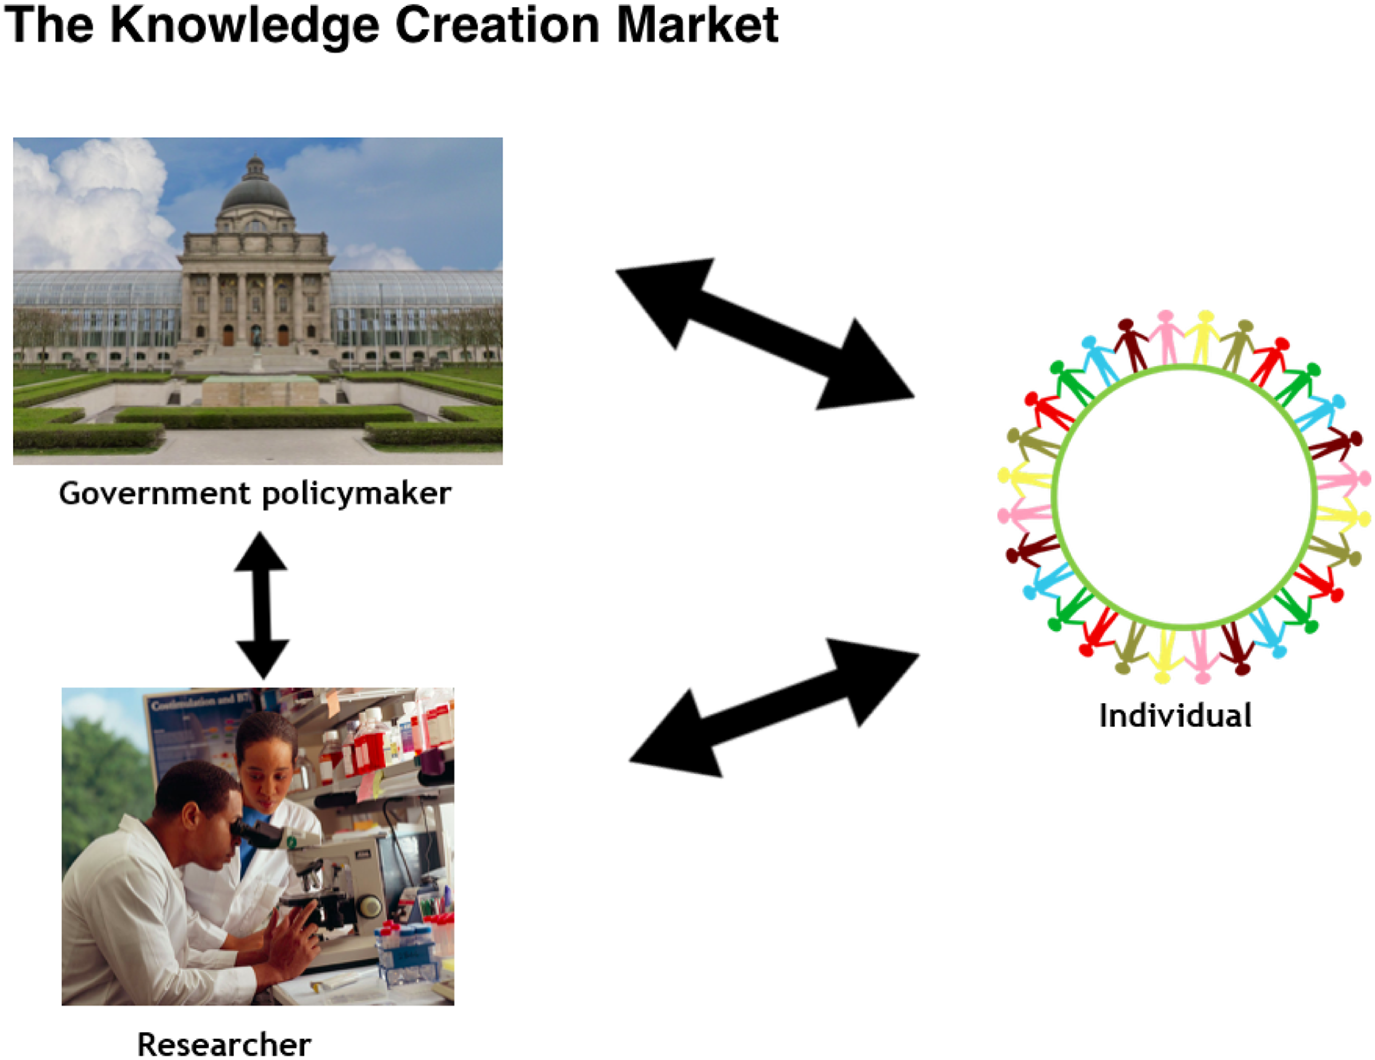
Scaling promising programs into effective policies is a complex, dynamic process. We follow Al-Ubaydli et al.'s (Reference Al-Ubaydli, List and Suskind2019) framework to model the scale-up problem to provide guidelines for researchers and policymakers across disciplines in order to more effectively approach scaling. The market for science-based policy has three major players, as shown in Figure 1.
The knowledge creation market.

Policymakers implement policies that they expect will provide the greatest benefit to the population within time, money and resource constraints. Their expectations of benefits and costs are based on small-scale program evaluations, measured using BC analysis, though, sometimes, this analysis is limited. The policymaker decision-making process is the basis for our model of scaling.
Researchers conduct experiments to generate data in order to evaluate programs and publish research. They observe the individual characteristics of those who participate in the experiment, as well as the characteristics of the situation in which the experiment is conducted. The researchers maximize their own personal benefits, which include considerations specific to academia, net of the costs associated of running the experiment.
Individual citizens receive benefits from the programs that the government implements and receive rewards for participating in research studies. These rewards are balanced with the costs they accrue from being experimental participants.
We now take a closer look into aspects of the model and subsequent results from Al-Ubaydli et al. (Reference Al-Ubaydli, List and Suskind2019).
Nuts and bolts of the Al-Ubaydli et al. (Reference Al-Ubaydli, List and Suskind2019) model
A policymaker aims to implement a policy that has the largest net benefit at policy-relevant scale and environment (i.e., a target population in a given situation). In other words, the policymaker's objective function is defined as expected policy benefits minus expected policy costs at scale.Footnote 9 However, because the policymaker does not know the true net benefits of a potential policy, they must rely on estimates from program evaluations. In the model, we assume that the policymaker, similarly to Greta and Mason in our opening vignette, naively accepts the benefit and cost estimates provided by the researcher.
A researcher runs a field experiment with a chosen environment to generate data in order to evaluate the program. They observe the individual characteristics of those who participate in the experiment, as well as the characteristics of the situation in which they implement the experiment. The researcher maximizes their personal benefits, net of the costs associated with running the experiment. The researcher's objective function has three benefit components:
(1) They want to conduct an experiment with results that can be independently replicated, which is rewarded with reputational capital in the research community.
(2) They want to conduct an experiment with large estimated net benefits, which will be more likely to be published in an academic journal and yield professional rewards, including tenure, higher salaries, greater likelihood of a grant, etc.
(3) They want their research to be implemented at scale, which is rewarded by prestige and other benefits, including consulting jobs, wider exposure and the positive feeling that they are helping to change the world.
These assumptions raise an initial red flag in that there is an inherent conflict: replicability is potentially at odds with the latter two components. This is because the researcher chooses their subject pool (and the situation). As such, with superior knowledge regarding the unique attributes of the participants compared to other scientists and other parties who were not involved in the experiment, for example, they can strategically choose a sample population that yields a large treatment effect if they so wish.
In addition, if subjects with the largest expected benefits from the program are more likely to sign up, participate and comply, a scientist who maximizes their sample size subject to a fixed budget constraint inadvertently is maximizing the treatment effect, and subsequently presenting results that may not scale. This selection effect is a key assertion in the model and drives important results on the representativeness of the population.
As Al-Ubaydli et al. (Reference Al-Ubaydli, List and Suskind2019) note, the medical literature features significant support for this assumption. Meta-studies of recruitment confirm that those who stand to benefit most from a medical treatment are more likely to participate in trials. For example, in Cooper et al. (Reference Cooper, Hind, Duncan, Walters, Lartey, Lee and Bradburn2015), recruitment for medical treatments for type 2 diabetes was significantly easier than for prevention interventions, due to the size, tangibility and immediacy of the effects of the former. While factors such as altruism and the desire to save money are important determinants of an individual's readiness to participate in a medical trial, surveys also indicate that perceived benefits are critical, often because prospective participants assume that the medical treatment in a medical trial is of higher quality than conventional, non-experimental treatment (Walsh & Sheridan, Reference Weiss, Bloom, Verbitsky-Savitz, Gupta, Vigil and Cullinan2016).
After conducting experiments, scientists submit their estimated net treatment effects to scientific journals for publication. Consumers of scientific journals demand studies that report novel and large net treatment effects. They reward journals via the purchase of subscriptions and by citing the papers within a journal. Within the model, these two goals are perfectly aligned.
Government policymakers naively read results reported in the academic literature – they do not account for potential estimation bias, unrepresentativeness of the participants and situations in published studies, economies of scale and spillovers. The overarching key to the model is that the policymaker cannot observe characteristics of the participants or the situation, so they have a limited ability to predict how the small-scale effects might change when the population and situation change at scale. In a research world where replication is ill-rewarded and academic journals focus on surprising results, the model implies that researchers’ direct choice of their sample population contributes directly to the scale-up effect. In other words, there can be a scale-up effect even when there is no nefarious researcher behavior.
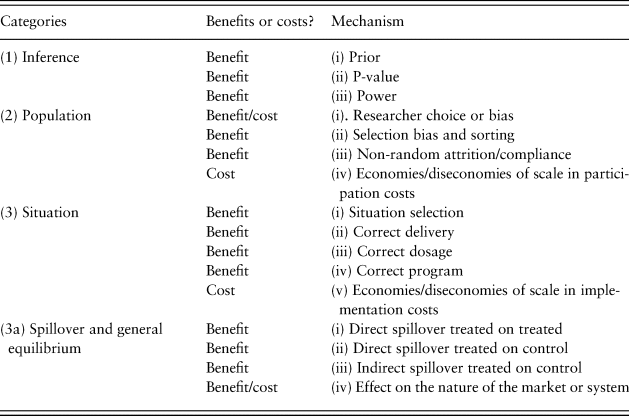
The model highlights three areas that represent key ingredients to understanding the scale-up effect, or the threats to scalability of experimental results: (1) What constitutes actionable evidence (inference)? And how will the properties of (2) the population and (3) the situation affect scaling? The situation is incredibly rich and includes spillovers and GE effects at scale. Within these three areas, six possible sources of the scale-up problem exist:
(1) The statistical estimation error (which we refer to as a statistical inference problem).
(2) The participant being unrepresentative of the population in terms of direct treatment effects.
(3) The participant being unrepresentative of the population in terms of participation costs.
(4) Economies/diseconomies of scale in participation costs.
(5) Economies/diseconomies of scale in implementation costs.
(6) Spillover and administration quality impacts direct treatment effects.
An additional effect is that there might be GE effects of the program at scale. We will define these later and match them with spillovers in the discussion below.
Implications of the model: inference, population and situation
In this section, we place the above six sources into our three categories: inference (source #1), population (sources #2, #3 and #4) and situation (sources #5 and #6). These three categories represent an intuitive way of categorizing the threats to scalability and relate to the threats identified by the literature across disciplines. We discuss each in turn and tie them directly to results in the Al-Ubaydli et al. (Reference Al-Ubaydli, List and Suskind2019) model. We also describe additional sources of the scale-up effect that are not captured in the parsimonious theoretical model but are relevant to researchers and policymakers. Sometimes, we break up the above sources into mechanisms to fully capture the breadth of the threats. For each of the three categories, we provide examples from the field where they had or might have had a role as a threat to replicability and scalability.
Inference
Are we making the correct inference from our data? At its most basic level, one might argue that too many programs are scaled before there is actionable evidence. An example of such a situation is potentially our opening vignette, or several of the empirical examples of unsuccessful scaling in the previous section. Alternatively, one might argue that not enough interventions are scaled, and when they are put to use they are scaled too late.Footnote 10 This debate naturally begs the question: When is evidence actionable? Put another way: What is ‘evidence-based policy’?
In our discussions with policymakers and researchers around the world, evidence-based policy is perhaps the most elusive of concepts to define. Yet, what is clear is that policymakers want to claim that they use evidence, as the following quotes show:
… the use of evidence and evaluation to ensure we are making smart investments with our scare taxpayer dollars.
– President Obama (Reference Obama2013)Policy innovation and evidence-based policy making is at the heart of being a reformist government.
– Prime Minister Kevin Rudd (Reference Rudd2008)The ministries are responsible for effective use of public funds … [cost–benefit analysis] is the most important tool for good decisions, but we observe that it is performed [in] too few analyses and that the quality is varying.
– Marianne Andreassen (Hamarsland, Reference Hamarsland2012)Our model attempts to put some rigor around the notion of inference and evidence. It begins by adopting the Bayesian approach for updating the probability that a finding is true (PSP), outlined in Maniadis et al. (Reference Miguel and Kremer2014), where:
 $${\rm PSP} = \displaystyle{{\lpar {1-\beta } \rpar \pi } \over {\lpar {1-\beta } \rpar \pi + \alpha \lpar {1-\pi } \rpar }}$$
PSP: Probability that the research finding is true
α: Level of statistical significance
1 − β: Level of power
π: Prior
This approach takes a strong stance in that it eschews the traditional method of relying on only one metric – statistical significance – to judge evidence of efficacy, and it proposes a more complete statistical story, made up of the Three P's:
(1) π, the prior: Evaluating results from a research study could cause someone to change their previously held belief that a certain program causes particular outcomes.Footnote 11 A previously held belief is their prior, or pre-study probability. The evaluator updates their prior based on new information – in this case, results from an RCT – and adjusts their belief about the program's effectiveness to obtain the PSP.
(2) P-value: The results of a study are often reported as statistically significant if p-values fall below a predetermined threshold (e.g., 0.05). The p-value is a continuous metric between 0 and 1 that measures the compatibility of observed data with the assumed model, or the null hypothesis that there is no treatment effect. A p-value smaller than 0.05 is commonly misinterpreted as ‘the probability of the effect being a false positive is less than 5%’, or that there is a less than 5% chance that the null hypothesis of no effect is true. The correct interpretation of a p-value of less than 0.05 is that, over many studies, there is less than a 5% chance that the result found is a false positive, given that the model and other assumptions are correct.Footnote 12
P-values may also be incorrectly reported. Each individual finding in a research study is considered a hypothesis that is being tested to measure whether the null hypothesis of no effect can be rejected. Each of these hypotheses has its own p-value. For one study, there may be multiple hypotheses tested (multiple treatments, multiple subgroups, etc.). Rather than considering each hypothesis in isolation, researchers should adjust for multiple hypothesis testing (MHT) to account for the statistical likelihood that any one finding might be a false positive.Footnote 13
P-values should be used to update priors, not as conclusive evidence of a program's effectiveness. A single, very low, correctly reported p-value from one outcome in an RCT should not be the sole or even primary basis of policy. Over many iterations of evaluating evidence of a program, a person can be more confident that they are updating their priors appropriately.
These issues are magnified by publication bias,Footnote 14 the practice in which journals overwhelmingly publish studies that have large, surprising results with low p-values. These are published more often than small, unsurprising and/or null results, despite the fact that studies with those characteristics can and should help update priors. It is important for policymakers to be aware that the research presented in journals is curated in this way.
(3) Power: The power of a study is a measure of the likelihood that the study finds an effect when that effect is indeed present. It is calculated before a study is run, using the number of participants in a study, characteristics of the measured outcome and a specified minimum detectable effect size. For example, a study with a power of 0.80 is one in which 80% of the time, given a certain number of participants and characteristics of the outcome measure, that study will be able to detect the pre-specified effect size if it is repeated many times.
Low-powered studies fail to detect an effect even if that effect is present. This false negative, or Type II error, can cause someone evaluating a study to prematurely write off a program as ineffective. When a study is low powered, the measured benefit of the study indicates that there is no effect present, and a policymaker might assume the program is ineffective. In reality, the study may have had too few participants for the study to identify the effect.
Results of low-powered studies can also importantly overestimate the size of an effect,Footnote 15 so if a program is implemented elsewhere, the measured effect of that implementation will be smaller than the original implementation. Only programs that overestimate the size of an effect will appear to be statistically significant when a study is low powered, which is merely a result of statistical noise. A general insight from this literature is that sparsely populated experiments can lead to higher treatment effect estimates simply due to chance induced by low power.
Insights from the model on inference
With the above machinery in place, a first insight from the Al-Ubaydli et al. (Reference Al-Ubaydli, List and Suskind2019) model is that there can potentially be a scale-up effect in the short run even when there are many scientists exploring the problem. Indeed, the economic reader might notice the parallel with the ‘winner's curse’ literature describing bidding patterns in auctions. That is, bidders typically do not adjust their optimal bids appropriately when more bidders enter the auction (they should bid lower amounts; see Harrison & List, Reference Harrison and List2004). The same phenomenon is happening here – as the number of scientists working on related programs increases, the ‘winning program’ will be overly optimistic due to randomness, leading to a greater inferential error. This is most commonly described as a ‘false positive’, or Type I error.
A second insight from the model is that the PSP can be raised substantially if the initial positive findings pass as few as two or three independent replications. This is an important insight, because in our experience some decision-makers in government and the private sector wish to rush new insights into practice. Proper incentives for independent replication therefore help mitigate the scale-up effect. This leads to our first proposal:
Proposal #1: Before advancing policies, the PSP should be at least 0.95. In cases where the prior (π) is ill-understood, we recommend assigning a conservative choice of 0.1 in ‘surprise result’ cases and of 0.5 when results are broadly anticipated.Footnote 16
In sum: In a small-scale RCT, the inference problem causes the measured treatment effect of a program – the benefit side of the BC metric – to misrepresent the actual effect of a program. Erroneous statistical inference can occur independent of scale, but is more likely with low-powered programs. The scale-up effect becomes evident when a certain intervention tested in a small-scale RCT suffers from an inference problem and then is implemented at a larger scale and shows no (or much smaller) effect. The inference problem is twofold:
(1) A research study finds an effect, but that finding is just statistical noise. This is most commonly described as a ‘false positive’, or Type I error.
(2) Effects in a study are not correctly reported, or, after appropriate adjustments, measured effect estimates lose statistical significance. One common case of incorrect reporting occurs when analysis does not control for MHT.Footnote 17
Talking about replication in the context of scale-up problem naturally raises the question of what ‘replication’ is. For example, if the initial positive effects of a program implemented for low-income individuals do not sustain when implemented for high-income individuals, it is technically incorrect to conclude that the initial program failed to replicate. It is beyond the scope of this study to delve into the minutiae of replication, but regarding inference, by ‘replication’ we mean an implementation of a new RCT that matches the initial RCT as closely as possible. Most ‘replication’ implementations in the social sciences do not fall under this narrow definition of replication. These new implementations can be interpreted as adding two new types information: (1) information on inference for the updating of the PSP (coming from the portion that matches the initial RCT); and (2) information on the effectiveness of the intervention for a broader range of populational and situational characteristics beyond the initial RCT.
Examples: Premature implementation of interventions that do not have a high PSP (i.e., replicated enough) poses a major threat to scalability. Over a series of scientific replications of a CSR intervention in five different districts in Oklahoma and Texas, Hitchcock et al. (Reference Hitchcock, Dimino, Kurki, Wilkins and Gersten2011) find that overall the program has no effect on reading and comprehension. They demonstrated that the CSR program that showed initial promising results was not effective in other states.
Another example is Project CRISS, a teacher professional development program designed to improve students’ literacy. An early RCT (Horsfall & Santa, Reference Horsfall and Santa1985) showed large effects on reading achievement, but the study displayed some warning signs: it had a small sample, increasing the probability of a false positive, and the researchers created their own outcome measures. Unsurprisingly, when CRISS was re-evaluated in a larger, government-sponsored RCT, the positive results were overturned (Kushman et al., Reference Levitt and List2011). Although other mechanisms could have been at play, we suspect that the early results were false positives.Footnote 18
In their paper about adjusting experimental results when testing multiple hypotheses, List et al. (Reference Maniadis, Tufano and List2016) point out that a few of the secondary treatments of a charitable giving experiment (Karlan & List, Reference Kerwin and Thornton2007) lose significance if the analysis is adjusted for MHT. Even results published in top academic journals can suffer from an inference problem due to incorrectly reported results.
In their discussion of low-powered studies, Button et al. (Reference Button, Ioannidis, Mokrysz, Nosek, Flint, Robinson and Munafò2013) find the median power in a meta-analysis of neuroscience papers is (conservatively) 21%, implying that “the likelihood that any nominally significant finding actually reflects a true effect is small.” Thus, it is critical for the analyses to include power calculations, and a deeper understanding of the related issues with low-powered studies should always be a discussion point.
Representativeness of the population
Did we have the ‘correct’ people in the original research study? This is an area of inquiry that policymakers are well aware of, and one that at least on traditional individual-specific observables – gender, race, age – they keep close tabs. Scholars have also made important inroads in these dimensions (Bell & Stuart, Reference Bell and Stuart2016; Stuart et al., Reference Stuart, Bell, Ebnesajjad, Olsen and Orr2018), lending to important insights into heterogeneity (Heckman et al., Reference Heckman, Lochner and Taber1998b) and the effects of non-random attrition (see, e.g., Ogutu et al., Reference Raudenbush and Bloom2018). Yet, there are in many cases invaluable pieces of information that the researcher has that the policymaker might not have at their disposal or that it might be difficult to obtain. The model adds rigor around the notion of the representativeness of the population and its impacts on scaling, creating the following mechanisms through which unrepresentativeness of the population can contribute to the scale-up problem:
(1) Researcher choice/bias: Researcher choice/bias causes the scale-up effect through the benefit and/or cost sides of the BC metric. A program's effect may be dependent on characteristics of the population receiving the program. When a researcher seeks out a particular population for their study – whether for convenience, interest in securing a promising first result or other reasons – they are employing choice/bias. This may result in a certain group of subjects in the RCT showing different characteristics from the policy-relevant population, and those characteristics could impact the measured treatment effect of the evaluation. Researcher choice/bias does not primarily come from a nefarious desire to overestimate the effect of a program.
Additionally, researchers may seek out a specific population that will benefit greatly from the program in order to show large and significant effects, which could increase the chance of journal publication, traction for further studies and possibly traction with the government. It may be less expensive for a researcher to convince people to participate in their study if those people expect to benefit greatly from the program. This could lead to the small-scale measured costs being an underestimate of the large-scale costs of convincing a wider population to participate. Participants might even have the same observable characteristics as the general population to the external econometrician and policymaker, but possess differences that only the researcher can detect.
(2) Selection bias and sorting: Selection bias and sorting cause the scale-up effect through the benefit side when the specific population in a research study is unrepresentative of the greater population because that population has selected into participating. A person may participate in a program if they expect to benefit from it a great deal. When an RCT population consists of many people who only decided to participate if they expected large benefits, that RCT population is likely to be unrepresentative of the overall population. If a program is scaled up into a policy that everyone must participate in, the program's effect on the specific population who expected great gains may not manifest in the overall population that includes people with characteristics similar to those who did not select to participate.Footnote 19
(3) Non-random compliance/attrition: Characteristics of the population in an RCT may lead to non-random attrition or compliance both in treatment and control groups. In the case of attrition, people who attrit from an RCT have specific characteristics that influence them to quit. If those characteristics are correlated with benefits from the program, the measured treatment effect of the RCT may fail to capture the effect of the program on those people.
Similarly, even without attrition from a program, different people may comply with a program to various degrees, effectively leading to different people receiving different dosages or even programs. Ensuring participation in and compliance with a program is related to the perceived benefit people expect to gain from a program. Non-random attrition and/or compliance causes an RCT to measure a program's effect on a population with specific characteristics, resulting in a potentially inaccurate measure of program benefit.
In the context of attrition and compliance, an important implication of including costs is that having 100% compliance and 0% attrition does not necessarily maximize the BC measure. This is in contrast to the voltage effect literature that focuses on maximizing compliance and minimizing attrition.
(4) Economies/diseconomies of scale in participation costs: Participation costs per individual may decrease or increase from small to large scale or exhibit economies or diseconomies of scale. If at small scale each participant requires individual effort to be convinced to participate, but at large scale a program policy has a marketing effort with wider reach, per-person participation costs could decrease at scale. At an even larger scale, a policy implemented by the government could have even lower per-participant costs if participation is required.
Alternatively, costs per participant could increase at scale if, in order to compel a wider population to participate, it is more expensive to convince each individual to participate. This is similar to selection into a program – it may be more expensive to convince people to participate if they expect small (or no) benefit from participating. Participation costs can also change with scale in another case in which an initial successful RCT increases awareness of a program so it is easier to convince the next group of people to participate. For example, a widespread media campaign could lower participation costs at scale because it would increase awareness of the program.
Insights from the model on representativeness of the population
A first insight from the Al-Ubaydli et al. (Reference Al-Ubaydli, List and Suskind2019) model is that as one liberally changes the importance of being replicated, being published or having one's research adopted by policymakers, the nature of the scale-up effect changes. For example, as the weight scientists place on replicability grows larger, the smaller the scale-up effect problem, ceteris paribus. Likewise, decreasing the weight on the scientist's publishing and adoption rewards causes a smaller scale-up effect, ceteris paribus. The mechanism underlying such results is that the non-representativeness of the participant pool chosen by the scientist changes as a direct result of the weights of their objective function changing.
These results and related insights from the model lead to several proposals:
Proposal #2: We should reward scholars for attempting to replicate – tying tenure decisions, public grant money and the like to replication work (i.e., reward the supply for replications).
Proposal #3: We should reward scholars for producing initial results that independently replicate – tying tenure decisions, public grant money and the like to such research (i.e., increasing the demand for replicable work).
Proposal #4: Scholars finding null results, especially ‘tight zeros’, should report them unabashedly and receive rewards since these contain valuable policy information.
Proposal #5: Leverage multi-site trials to learn about the variation in program impacts across both populational and situational dimensions. In other words, before scaling, understand the program effects across subsets of the general population and characteristics of the situation to understand who should receive the program, where/how it should be implemented and whether it passes a BC test.
Proposal #5 highlights the importance of using the original research design to provide empirical content to the representativeness of the population (and situation, discussed next). For excellent recent discussions, see Raudenbush and Bloom (Reference Riccio2015) and Weiss et al. (Reference Young, Ioannidis and Al-Ubaydli2017). In carrying out such an agenda, the analyst should not only measure average treatment effects, but also explore how the treatment effects vary across people. By using appropriate variation in individual-specific characteristics, the design of multi-site trials can provide empirical content into why effects might not scale and give empirical hints about where more research is necessary before scaling (see Supplee et al., Reference Supplee and Metz2013; Supplee & Metz, Reference Tuttle, Gill, Gleason, Knechtel, Nichols-Barrer and Resch2015). This emphasis on multi-site trials also applies for situational heterogeneity discussed below.
In sum: The threat posed to the measured BC profile by unrepresentative populations is multi-pronged and it can affect both the benefit and cost components. Al-Ubaydli et al. (Reference Al-Ubaydli, List and Suskind2019) pinpoint the potential mechanisms through which this threat is at work, and as a first step researchers should make more information available to consumers of their research. Some of these mechanisms, like selection bias and non-random compliance and attrition, are often discussed in the literature. Others, such as researcher choice/bias and (dis)economies of scale in participation costs, have been mostly neglected.
Examples: Researcher choice/bias exists in empirical literature in a variety of forms. In an excellent example, Allcott (Reference Allcott2015) describes site selection of OpowerFootnote 20 experiments. The motivation behind much of the selection of sites resulted from preferences of the utilities he worked with, not specifically those of a researcher. Convenience and dedicated targeting of subpopulations – to generate a strong initial proof of concept – were reasons enough to deliberately seek out an unrepresentative sample.
In the context of education, Stuart et al. (Reference Supplee and Meyer2017) analyze the characteristics of schools and the corresponding districts of those that participated in 11 large-scale rigorous evaluations and find that they differ from target population in terms of size, student performance on state assessments and location. In other words, unrepresentativeness likely goes beyond population to include unrepresentativeness of situation as well.
Banerjee et al. (Reference Banerjee, Banerji, Berry, Duflo, Kannan, Mukerji and Walton2017) describe work that found no effect of fortified salt on anemia rates, despite earlier programs that found that fortified salt reduced anemia rates. They posit that this result occurred because the original studies (Banerjee et al., Reference Banerjee, Barnhardt and Duflo2015a) specifically sought out adolescent women, and that in the wider rollout the measured treatment effect did not manifest at a larger scale with a broader population. While it remained intact for adolescent women, it was absent for other groups. This represents an example of researchers selecting a target population for early efficacy tests.
Heckman et al. (Reference Heckman, Ichimura, Smith and Todd1998a) discuss selection into RCTs, and they find that the characteristics of subjects who participate can be distinctly different from subjects who do not participate, which is known as randomization bias. This implies that the measured treatment effect of a small-scale program evaluation that compares treatment and control groups that are different from the set of individuals who did not participate will not accurately represent the effect of the program.
In their study of take-up of biofortified crops by farmers, Ogutu et al. (Reference Raudenbush and Bloom2018) acknowledge the possibility that non-random attrition may affect their treatment effect estimate because the control group and one of three treatment arms had higher attrition rates than the other two. If characteristics that influenced the program impact were related to characteristics that led subjects to attrit, the measured treatment effect would be a poor representation of the actual treatment effect. To account for this possibility, they use a weighting procedure to control for this in their analysis.
Representativeness of the situation
Are we extrapolating from the ‘correct’ situation? While much attention has been paid to representativeness of the population (and for good reason), less attention has been paid to formally modeling aspects of the situation. Indeed, data thus far suggest that representativeness of the environment is quite important, and in many cases more important than representativeness of the population (see List, Reference List2004, Reference List2006, Reference List2007b; Levitt & List, Reference Lin and Green2007). The stakes are considerably increased when we consider that, when scaling, we oftentimes generalize our results to both a population of situations and a population of people when we typically only speak to the issue of the latter. Indeed, one meta-analysis in the field of juvenile recidivism suggests that 50% of the voltage problem is due to administrative fidelity (Lipsey, Reference List1999).
The Al-Ubaydli et al. (Reference Al-Ubaydli, List and Suskind2019) framework highlights that the scale-up effect can occur on the benefit and/or cost sides when the environment in which an RCT occurs is unrepresentative of the context in which a policy is enacted.
(1) Situation selection: The characteristics of a situation conducive to running an RCT – including a high level of control, ability to randomize and hands-on effort – can influence the measured effect of that study. When a program becomes policy, the situation changes – including less control, inability to randomize and more removed involvement of program experts – which impacts the measured effect of the program. Similarly to selection of a population to ensure a large initial result, selection of a situation does not result from ill intent, but rather could result from a researcher seeking out a specific situation to secure future funding in order to further evaluate a program.
The very fact that a program evaluation is an experiment can lead subjects to behave in ways that are not representative of how they would behave in a non-experimental setting. For example, the John Henry effect describes the additional effort experimental subjects exert simply because they are in an experiment – they act as if they are in a competitive environment (Horton et al., Reference Horton, Rand and Zeckhauser2011). The very fact that a situation is an experimental setting influences behavior, and this change in behavior can influence effect measures.
(2) Correct delivery: When a researcher evaluates a program, they are able to measure that the program is being delivered correctly. That control over monitoring is lost at larger scale, which can lead to unmeasured incorrect delivery of a program. If the original study involved a certain delivery, in a new situation when the program is delivered incorrectly one cannot expect the measured treatment effect to mirror that measured at small scale. Delivery of a medicine through an orally ingested pill may have different benefits from the same medicine when it is injected. An in-person curriculum represents delivery in a very different context from that same curriculum delivered through online videos.
(3) Correct dosage: Similarly, new situations at scale can lead to incorrect dosage of a program. If an original study involved a certain specified dosage, in a new situation with incorrect dosage the measured treatment effect may change. Too few pills of a certain medicine may not have the same benefits as a full round of that medicine. Too few lessons, or lessons in the wrong sequence, could lead to different effects from those originally measured.
(4) Correct program: When a program is tested in an initial RCT, by definition the exact program implemented is the program being tested. When that program is implemented in a new situation, the implementation may effectively be of an entirely different program.
(5) Economies/diseconomies of scale in implementation costs: The situation in which a program is originally tested influences the nature of the costs that study measures. From small to large scale, implementation cost per individual, or the material cost of the program, may increase or decrease. Costs per individual may increase if researchers incur unusually low costs given the situation in which they implemented an RCT, including from eager grad students and research assistants who work for no monetary cost. Cost per individual might also increase at scale if political constraints make it especially costly to implement a new, large program. At smaller scale, those bureaucratic constraints may have been smaller or non-existent.
Cost per individual may fall, or exhibit economies of scale, if the situation at large scale allows for bulk production of inputs. When a program's implementation involves some form of technology, there may be high fixed costs to developing the intervention, but the cost of administering the program for each additional individual is negligible. The use of technology can also decrease the cost of monitoring the delivery, dosage and fidelity of program implementation, a situational mechanism through which the scale-up effect can increase the BC profile through the cost side.
Insights from the model on the representativeness of the situation
Several insights from the Al-Ubaydli et al. (Reference Al-Ubaydli, List and Suskind2019) model reinforce the importance of situational representativeness. For example, the model highlights fidelity as a key reason why results may not scale. The model delivers several results pertaining to how to increase fidelity. First, fidelity is increased if facilitators understand the ‘whys’ behind the intervention effect. This is because understanding the ‘whys’ induces implementers to stay the course when actually rolling out the program. The effort that researchers and overseers exert when trying to maintain fidelity sometimes reflects their taking the time to explain to newer administrators the reasoning behind the intervention.
In this spirit, there is a large literature showing that people are more likely to adhere to instructions when they understand their purpose and when those issuing the instructions take the time to ensure that people buy in. A good illustration is patient adherence to medication – when physicians wish to maximize the likelihood that their patients take drugs as prescribed, one of the best practices that is grounded in rigorous experimentation is to explain the way in which the drug works to the patient via face-to-face meetings and to explain the importance of following prescription instructions (Zullig et al., Reference Zullig, Peterson and Bosworth2013).
Second, diseconomies (economies) of scale cause a larger (smaller) scale-up effect. This result pertains to the cost side and represents a key reason why the BC metrics might change at scale. The results on situational representativeness lead to several proposals:
Proposal #6: Ceteris paribus, technology should be encouraged to promote standardization, correct dosage, correct program, etc.
Proposal #7: Include the original scientist on the implementation team to enhance fidelity, to teach policymakers why the result occurs and for general consultation.
Proposal #8: Policymakers must understand negotiables and non-negotiables when scaling (a necessary condition from scientists before scaling).
Proposal #9: Researchers should block on situations when doing experiments, just like we commonly block on individual characteristics in modern experimentation (this will help us to understand Proposal #8; i.e., scale, humans delivering, correct dosage, program, delivery, incentives, substitutes).
Proposal #6 does not imply the use of technology to the detriment of intervention efficacy. Quite the opposite: the proposal suggests that if the researcher can achieve similar (or greater) efficacy when using technology (i.e., ceteris paribus), then they should substitute in technology. This discussion raises the aforementioned trade-off that is only possible in the context of BC. Given the goal of maximizing the BC metric (which could be bounded on the cost side), it is not optimal to maximize benefits (e.g., via high fidelity) if that leads to a much faster increase in costs. Similarly, reducing costs is not optimal if benefits decrease at a faster rate through any of the mechanisms of the scale-up effect.
One approach to putting Proposal #9 into action is to optimally use multi-site designs (for excellent recent discussions, see Raudenbush and Bloom, Reference Riccio2015; Weiss et al., Reference Young, Ioannidis and Al-Ubaydli2017). In carrying out such an agenda, the analyst not only measures the average treatment effect, but also explores how treatment effects vary across sites. By using appropriate variation in site-specific characteristics, the design of multi-site trials can provide empirical content to explain why effects might not scale and can give empirical hints as to where more research is necessary before scaling.
As aforementioned, Bell and Stuart (Reference Bell and Stuart2016) describe different treatment effects across experimental sites, but they mostly focus on population heterogeneity as its source of variance. However, experimental sites per se are multidimensional in nature where both population and situational unrepresentativeness arise jointly. Therefore, multi-site experimental designs will be key to addressing these two threats to scalability.
In sum: Situational features are key to understanding what to expect at scale and, in practice, understanding what high-functioning sites look like plays an important role because these sites can not only provide quality of implementation, but also reduce costs at scale. Learning about how characteristics of the situation affects the BC ratio of an intervention not only helps us address the scale-up problem, but also, and more broadly, it can inform us how this ratio might change when the policy-relevant situation changes dramatically (e.g., changes in regulation).
A related, frequently encountered manifestation is political opposition, especially when a novel intervention is being implemented. The prevailing regime brings with it significant entrenched interests, which may oppose a novel intervention on the basis of financial interests or simply because of institutional inertia. Circumventing the barriers erected by opponents in a small-scale experiment might be trivial. Yet at a larger scale, this may require a significant financial outlay, corresponding to diseconomies of scale. Or, in the absence of those outlays (constant per capita administrative effort), the treatment effect will be denuded by counterattacking bureaucrats and other vested interests (in the context of conducting field experiments in firms, see the related examples of an ‘Adam’ in every firm; List, Reference List, Momeni and Zenou2011b).
Examples: Situation selection is often not an explicitly obvious mechanism through which the scale-up effect occurs. An imperfect example includes Vivalt's (Reference Vivalt2016) analysis, in which non-governmental organization (NGO) and researcher evaluations find higher effects than government-run RCTs, indicating that evaluations “are rooted in particular contexts.” In a similar example, compared to their hands-on implementation in partnership with an NGO, Bold et al. (Reference Bold, Kimenyi, Mwabu, Ng'ang’a and Sandefur2013) find that when the Kenyan government implements a contract teacher intervention, the implementation is much weaker, which results in no program effect. Our theoretical model implies that an implementation led by the government, or any entity that is not the original implementer, can change the program situation and can lead to incorrect delivery of the program generally, and dosage and program more specifically.
August et al. (Reference August, Bloomquist, Lee, Realmuto and Hektner2006) find that when the situation changed from their initial RCT to the next advanced-stage effectiveness trial, families had reduced engagement in a conduct problems prevention program. They identify this as decreased dosage, which contributes to the lack of replicated outcome measures from small to large(r) implementation.
In their paper on scaling up School-Wide Positive Behavioral Interventions and Supports (SWPBIS), Horner et al. (Reference Horner, Kinkaid, Sugai, Lewis, Eber, Barrett, Dickey, Richter, Sullivan, Boezio, Algozzine, Reynolds and Johnson2014) explicitly acknowledge that “as states gained local training, coaching, and evaluation capacity, the cost of SWPBIS implementation became less expensive per school and more feasible for scaling up on a geographically distributed level.” As the program expanded, costs decreased or displayed economies of scale.
In some cases, researchers have directly designed the evaluation to learn about the scale-up effect. Kerwin and Thornton (Reference Kilbourne, Neumann, Pincus, Bauer and Stall2018) include a novel treatment arm in their evaluation of an education program in Uganda to model the policy-relevant situation. They find large effects of a high-quality, relatively high-cost program, but they find that a less expensive program specifically designed to scale is much less effective. In other words, they account for the budget constraint that the government would face if it tried to implement a similar intervention but at a much larger scale. The Teaching at the Right Level (TaRL) program described in Banerjee et al. (Reference Banerjee, Banerji, Berry, Duflo, Kannan, Mukerji and Walton2017) include a treatment arm that involve less oversight by Pratham, the implementing NGO. In this particular example, the researchers identified oversight through which delivery or dosage could generate the scale-up effect. These two evaluations model the situation at scale and allow analysis of results to more closely mirror the program that might feasibly be implemented at scale.
A case study in this area is the Tennessee Star program. After promising initial results from the Tennessee STAR randomized statewide class size reduction, Tennessee implemented Project Challenge to reduce class size in K–3 classrooms in the state's poorest school districts (Hippel & Wagner, Reference Hippel and Wagner2018). Following an influx of money designated to reduce class sizes, those poorest districts did not actually spend the money to decrease average class sizes. Unsurprisingly, Project Challenge did not result in higher test scores. The Basic Education Program, also in Tennessee, reduced statewide class sizes from 26 to 25 on average. Overall, scores did not improve. Both Project Challenge and the Basic Education Program are examples of the entirely wrong program implemented at scale.
California's statewide implementation of smaller class sizes demonstrated diseconomies of scale in implementation costs (Achilles, Reference Achilles1993). Jepsen and Rivkin (Reference Jepsen and Rivkin2009) examine the results of the implementation that forced the state of California to hire from a larger teacher labor market than ever before. To achieve the smaller class sizes,Footnote 21 California could have incurred greater costs to maintain similar-quality teachers or continue to pay a similar amount but for lower-quality teachers. The authors find that “the increase in the share of teachers with neither prior experience nor full certification dampened the benefits of smaller classes.” When the state of California expanded teacher hiring, they hired less experienced teachers, and the large-scale outcomes of the statewide class size reduction were significantly smaller than the original Tennessee STAR findings.
Banerjee et al. (Reference Banerjee, Banerji, Berry, Duflo, Kannan, Mukerji and Walton2017) describe their process of testing TaRL and eventually implementing it as a large-scale policy, and they acknowledge that their initial result was crucial to “fostering acceptance of the policy by the government,” which underscores that selecting a certain situation (and/or population) for an initial program evaluation can give that program its best shot at helping to secure future work and funding related to that program.
Spillovers and general equilibrium
An important property of the situation that we separate into its own discussion is adequate accounting for spillovers and GE effects. In some interventions, treating people creates a spillover effect on people in the untreated group. This can be of a positive nature – consider the case of a business ethics course where enrollment is assigned to a random subset of a company's employees. Those who do not enroll are still affected positively by the presence of the enrollees, who act as models for them: the greater the number of enrollees (treated group), the smaller the implied treatment effect when comparing treated to untreated in the research study. If we should scale this treatment, we would expect that the treatment effect at scale will be larger than the original research suggested because in the original research the control group outcomes were inflated, thereby reducing effect estimates.
A recent example of the importance of this effect is found in List et al. (Reference List, Shaikh and Xu2019), who report that in their measurement of the effects of a pre-kindergarten intervention, control children gain from being spatially situated near to treatment children. On average, treatment-to-control spillover effects increase a child's non-cognitive (cognitive) scores by about 1.2 (0.6–0.7) standard deviations. These spillover effects are localized, decreasing as spatial distance to treated neighbors increased. Their evidence suggests that the spillover effect on non-cognitive scores are likely to operate through the child's social network. Alternatively, parental investment is an important channel through which cognitive spillover effects operate. Their results show how the scale-up effect can be positive: once scaled, the program will be much more successful than the original researchers claimed (see Fryer et al., Reference Fryer, Levitt and List2015, for the original research results).
Alternatively, the scale-up effect could be negative due to spillovers – consider an intervention that improves the school performance of students in a given class. The control group in the same class may, upon seeing an initial improvement in the performance of the treated group, feel demoralized, inducing a further deterioration in their performance and accentuating the treatment effect. In psychology, this is denoted as the ‘resentful demoralization’ effect (Cook & Campbell, Reference Cook and Campbell1979; related examples can be found in Friedlander et al., Reference Friedlander, Hoetz, Long and Quint1985; Schumacher et al., Reference Smith1994). This behavioral effect fits within a broader definition of the John Henry effect (Aldashev et al., Reference Aldashev, Kirchsteiger and Sebald2017), which is most often used to refer to situations where the control group exerts additional effort to overcome a perceived disadvantage of being in the control group.
Relatedly, there could be spillovers within the treatment group (spillovers of people in treatment on others in treatment). This occurs whenever the outcome of those in treatment improves as those around them become treated. Social media access, cell phone use and any other general outcome that has network effects falls under this category. For example, in List et al. (Reference List, Shaikh and Xu2019), these effects are especially large for non-cognitive scores. The authors find that, on average, a child who was randomized into one of the treatment groups gains about 0.7 standard deviations in cognitive scores and about 1.2 standard deviations in non-cognitive scores through these types of spillover effects.
In the cases of both within- and between-treatment spillover effects, we perceive no general rules of thumb regarding which is more likely. We merely note that it can cause a non-zero scale-up effect, and empirical measurement of such impacts is important when considering scaling research findings.
The discussion above explored the issue of spillovers between and within experimental groups, but in both cases, spillovers are restricted to people participating in the experiment. There exists an additional possibility, which involves spillovers to people in the experiment and to those who are not even participating in the experiment, which we denote as ‘GE effects’. For example, if, as part of a small-scale natural field experiment in an Indian village, researchers endow participants with quantities of money that are equal to several multiples of their daily wages, then there is a possibility of significant spillover effects to the village's macroeconomy. In turn, these spillovers might effectively give feedback on the treatment and control groups, resulting in further scale-up effects, where the sign may be positive or negative. As an illustration, monetary expansion might cause significant inflation, which would undercut the real income increase experienced by the treated. We do not model such spillovers; instead, we alert readers to their existence.
GE effects, including spillover effects, are important sources of the scale-up effect. We include these as part of the situational threats given the unique effects that they potentially have on the BC metric at scale. GE effects are changes to the market or system outside the evaluation, while spillover effects are measured as changes in behavior of treatment and/or control groups.
(1) Direct spillover treated on treated: When the nature of a program involves benefits that are magnified as more people receive the program, spillovers occur directly from treated people to other treated people. Occurring most clearly when programs include network effects, this type of spillover can change the measured treatment effect as scale increases. If a program's effect increases as more people are in the program, the measured treatment effect in a small-scale RCT could be an underestimate of the effect that program would have if it was implemented with more people.
(2) Direct spillover treated on control: Direct spillover of the treated on control is the effect treated individuals have on the outcomes of untreated individuals in an RCT. This occurs when treated individuals interact with untreated people, resulting in control group individuals changing their behavior. This can cause the measured treatment effect of an RCT to over- or under-estimate the treatment effect of a program. This form of spillover could cause a scale-up effect if an RCT result fails to take into account the gains in the control group outcomes that occurred after a behavior change stemming from interaction with the treatment group. If in a large-scale policy there is a higher concentration of treated individuals who have closer contact with untreated individuals than in a small-scale RCT, the measured treatment effect may decrease because the comparison group has benefited from this direct spillover more than the control group in the RCT, thus diluting the measured effect.
(3) Indirect spillover treated on control: Indirect spillover effects of treated individuals on the control group occur when the control group changes its behavior after indirect influence from the treated group. This indirect influence can come from simple knowledge that the treated group is participating in some program or news about the existence of a program, which could influence even untreated individuals to change their behavior. Beyond these mechanisms, spillover effects can impact costs if, through positive spillovers, more people talk about a program and raise awareness, which may decrease participation costs.
(4) General equilibrium, or effect on the nature of the market or system: These are changes to the overall market or system outside a program or policy evaluation. These changes do not manifest at small scale. If a policy alters the value of a certain program outcome, the benefit an individual gains from that program may be relatively small if many more people are also benefiting from the program. For example, more people benefiting from certain educational credentials may decrease the individual benefit of that credential if a program leads to many more people earning that credential.
Insights from the model on spillovers and general equilibrium effects
Several insights from the Al-Ubaydli et al. (Reference Al-Ubaydli, List and Suskind2019) model show the import of spillovers and GE effects. For example, the model highlights that if there are positive program spillovers from treatment to control, then the program will be viewed too pessimistically in the original research design. Alternatively, if there are negative network effects, a policymaker should expect the studied program to have smaller effects at scale. Measured spillovers within treatments are similarly intuitive. And, for GE effects, a side result is that when programs are scaled, we should expect larger GE effects. The results from the model lead to a proposal:
Proposal #10: The original researcher should measure and report within- and between- spillover effects and, where applicable, measure GE effects to aid in determining and forecasting the total effects of a scaled program.
Putting together our spillover discussion with the other proposals, a general proposal for scholars results:
Proposal #11: Researchers should backward induct when setting up their original research plans to ensure accurate and swift transference of programs to scale. The checklist should include (at least) all of the above proposals related to their choices as well as a complete cataloguing of both benefits and costs, with estimates of how those will change at scale.
A related issue to the GE effects is the availability of similar outside programs. In regards to outside programs, if there are viable substitutes to the intervention, a voltage increase will occur when the program more completely dominates substitutes at scale. In this manner, understanding the available substitute set and modeling its effects are invaluable to understanding program effects at scale (see Kline & Walters, Reference Knechtel, Coen, Caronongan, Fung and Goble2016).
In sum: Field experiments draw our attention to the importance of evaluating programs in a natural environment and spillover effects are an unavoidable phenomenon in the policy-relevant world. Our analysis above stresses the importance of not only addressing these effects, but also relying on theoretical models of spillover to guide experimental design when evaluating program effectiveness. An obvious benefit is to estimate a BC profile that is not affected by scale, or at least to understand how scale affects the BC metric. In addition, this approach opens the door for endogenizing spillover effects. In other words, similarly to using technology as a way of sustaining high-fidelity and low-marginal costs, we can leverage spillover effects to increase the BC ratio at scale.
We have emphasized the importance of understanding the policy-relevant environment in terms of properties of the population and situation. GE effects push for an even deeper understanding because the policy-relevant environment is nested in a ‘market’ structure or institution with different agents or entities with their own incentives and dynamic interactions among them. At scale, GE effects capture how the dynamics of this market structure are disrupted and their influence on the BC estimate.
Examples: In order to test for spillover effects, researchers sometimes employ a rollout model in which first only some individuals are assigned to receive treatment, and later the rest of a population is assigned to receive the treatment. This allows for the identification of how outcomes change based on how many peers are also treated, or how treated individuals can affect treated and control individuals’ behavior.
Positive spillovers from treatment to control include Miguel and Kremer's (Reference Muralidharan and Niehaus2004) study on deworming, which finds that the measured treatment effect of a small-scale deworming evaluation is an underestimate. Untreated individuals also benefit from the intervention if they are in villages with some dewormed individuals. By measuring the exogenous variation of the local density of treated students, they are able find that the greater the density, the larger the positive effect on control individuals.
Work in education research finds that increased overall access to job training can diminish the effects of specific programs for individuals.Footnote 22 Ferracci et al. (Reference Ferracci, Jolivet and van den Berg2013) find that when a greater percentage of individuals in a distinct labor market receive job training, the impact for each individual falls because the trained jobseekers are no longer as unique/distinct. Crépon et al. (Reference Crépon, Duflo, Gurgand, Rathelot and Zamora2013) find that the measured treatment effect in a small-scale RCT is an overestimate because at large scale the job placement program negatively affects the control group. In other words, unless the number of available jobs increases in a competitive labor market, those individuals in the control group, who might have gotten the job otherwise, are likely to be outcompeted by the trained workers in the program. Similarly, Heckman et al. (Reference Heckman, Lalonde, Smith, Ashenfelter and Card1999) report that increased job training overall can crowd out the distinction that training affords an individual when fewer people receive it. A large-scale job training program may alter the overall nature of the market trained jobseekers enter into.
Large program effects can occur in partial equilibrium, but fail in GE in situations like those found in Buera et al. (Reference Buera, Kaboski and Shin2012) in which microfinanceFootnote 23 efforts at scale are “counterbalanced by lower capital accumulation resulting from the redistribution of income from high-savers to low-savers.” Chen and Yang (Reference Chen and Yang2019) describe a relatively small-scale experiment in which Chinese college students were provided uncensored Internet access. They acknowledge that at a larger scale, the project might elicit a government response that did not register in the original, smaller setting. Similarly, Banerjee et al. (Reference Banerjee, Banerji, Berry, Duflo, Kannan, Mukerji and Walton2017) find that political backlash can cause a program to fail.
Gilraine et al. (Reference Gilraine, Macartney and McMillan2018) report that after the California statewide class reduction policy, teachers and students sorted back from the private to the public school system, which led to some positive gains in outcomes. This GE effect was not captured in any small-scale setting, but evaluators could conceivably have predicted that change in the perceived quality of schools could have impacted people's decisions about which school to work at or attend.
Scaling and beyond
The Al-Ubaydli et al. (Reference Al-Ubaydli, List and Suskind2019) model pinpoints areas where scalability is theoretically threatened. Surely, meta-studies can provide further empirical insights. For certain threats, researchers can take preemptive steps to avoid inadvertently suffering from them, such as trying to select a sample that will be as compliant with instructions as the population that they are supposedly representing. Even in the case of the insoluble components of the scalability problem, such as upward-sloping supply curves for administrator quality (e.g., cost of hiring more administrators of similar quality increases the more you need to hire), understanding the source allows scholars to acknowledge it up front and to test in order to explore the nature and extent of how that variable will impact the BC relationship at scale.
In sum, we can describe the mechanisms through which these threats manifest through the benefit and/or cost side(s) of the BC profile, and we summarize evidence from existing work. Table 1 summarizes the three categories and associated mechanisms through which the scale-up effect manifests, including additional mechanisms not directly captured by the model, but still relevant for researchers and policymakers.
Threats to scaling and their underlying mechanisms.

As a first step in bridging the gap between science and policymaking, we must start by identifying the policy-relevant environment described in terms of the target population and situation. This environment can indeed change over time, but this cannot be an excuse to implement a research project that does not speak to policymakers. We believe that identifying and measuring the different mechanisms through which the scale-up effect manifests can also help inform the decision-makers who need to implement an intervention in a different policy environment. Along these lines, our hope is that Table 1 can be used by researchers as a roadmap to identifying the potential threats and associated mechanisms, and to address them when developing their research design. As an extension to Table 1, we present a checklist as a guideline to each one of the stakeholders involved in the creation of knowledge and its policy application.
Checklist
This paper aims to catalyze a broad community of stakeholders to better understand threats to scale and how to tackle those threats and ensure more effective evidence-based policies. We encourage the research community to update its practices and empower policymakers and practitioners to make more informed decisions. We also aim to educate and encourage funders of research, both public and private, to support and incentivize studies that embrace this approach to the science of scaling. We provide the following list of recommendations to address the threats to scalability.
All stakeholders
□ Science of scaling. Challenge the stakeholder community to demand more empiricism with an eye towards scaling, in which positive results from single RCTs are not only replicated, but also tested for scalability.
□ Ensuring co-authorship of studies that include replication can help align incentives among researchers and encourage more replication (Butera & List, Reference Butera and List2017).
□ Build infrastructure to facilitate the execution of field experiments with replication purposes.
⇒ For example, the Collaborations for Impact in Education (CFI-Ed) initiative by the TMW Center for Early Learning and Public Health at the University of Chicago is a new initiative aimed at establishing a network of replicating sites. By building a network with the explicit goal of replicating educational interventions, CFI-Ed aims to remove some barriers to replication by co-authorship agreements and coordinated research.
□ Incentives. The knowledge creation market has to align the incentives of the agents.
□ Reward researchers for producing results that replicate with publication, tying tenure decisions, public grant money and the like to replicated findings (Proposal #2).
□ Reward null results, especially ‘tight zeros’ (Proposal #3).
□ Policy-relevant environment. For program evaluations with a clear policy goal, scholars, practitioners and policymakers must establish the target policy-relevant environment towards which the scale-up problem will be mapped (e.g., where the intervention, if successful, would be implemented at scale), particularly in terms of population and situation.
□ Broadly, understand the market structure within which this policy-relevant environment is nested: the different agents/entities with their incentives.
□ BC. In the scale-up problem, both benefits and costs play a key role. With scaling in mind, program evaluation analysis and interpretation should be done in the context of BC outcome.
□ Pre-registration. Establish mechanisms to limit bias by making pre-registration a norm for the pre-analysis plan.
⇒ For example, the research integrity initiative by Arnold Ventures is an example of funders emphasizing the importance of pre-registration and replication of program evaluations, while Lin and Green (Reference Lipsey2016) present a similar effort from the research community. Many disciplines have already taken steps towards this goal.Footnote 24
□ Education. Educate the broader community of stakeholders, particularly policymakers, civil servants, practitioners, and funders, to correctly interpret information provided by researchers.
Researchers
□ Policy-relevant environment. With representativeness of population and situation in mind, backwards induct to address the potential threats to scaling with the experimental design. For design, give priority to those mechanisms more likely to contribute to the scale-up problem.
□ Pre-registration. Pre-register the experiment, detailing the research design and the statistical analyses to be performed. Using the Bayesian framework, be explicit in terms of how the prior(s) will be updated based on your results (Proposal #1).Footnote 25
□ Why does a program work? Focus on the theoretical mechanisms underlying the program, beyond simple A/B testing.
□ Understanding the underlying theoretical mechanisms behind a program informs whether the BC profile will remain at scale and/or in a new environment (i.e., when characteristics of the population and situation are different from those where the experiment was implemented).
□ Identify and test the non-negotiable core components of the program that are necessary and cannot be adapted. In other words, describe to policymakers why the program works – when local implementers know why the program works, they are more faithful to the original design.
□ Inference. Researchers should be explicit about the program they are providing evidence of effectiveness for and/or the prior(s) they hope to influence. In particular:
□ Adjust for MHT when reporting p-values.
□ Maximize the statistical power of an RCT given the research budget (i.e., blocked randomization, within-subject design).Footnote 26 Do not implement low-powered RCTs.
□ Partner with other researchers in your research topic for replication of results.
□ An alternative, if the circumstances allow, is to organize the experimental site into independently run sites.Footnote 27
□ Population. Based on the policy-relevant population (i.e., from data), backwards induct so that your experimental design takes this into account.
□ Explain the sampling procedure used to make the sample more representative of the population.
□ Present comparative tables to summarize observable characteristics for the experimental sample and the policy-relevant population. This helps to address researcher choice/bias and selection bias/sorting.
□ Alternatively, address how the heterogeneity of a population will affect the BC metric.
□ Describe how non-random attrition and compliance affect results. For example, analyze results using intent to treat and include even subjects who did not complete a program in order to more accurately measure the benefit of a program that had inconsistent participation.
□ Collect and report participation costs to obtain estimates of economies or diseconomies of scale in participation costs.
□ Situation. Based on the policy-relevant situation, backwards induct so that your experimental design takes this into account (Proposal #9).
□ Ask if there are aspects of implementation (whether it affects the benefit or cost side) that will significantly affect the BC measure at scale (e.g., an inelastically supplied input; Davis et al., Reference Davis, Guryan, Hallberg and Ludwig2017).
□ In other words, the policy-relevant situation delivery, dosage and/or program may not be faithful to the original implementation. Take these constraints into account in the evaluation or address the costs involved in setting up the ‘situation’ as used in the experiment.
□ Consider economies or diseconomies of scale in implementation costs, the costs of core inputs and the infrastructure necessary to the program. Collect and report costs.
□ Spillover and GE. If spillover effects may significantly impact the measured benefits and costs in the policy-relevant environment, attempt to experimentally study those effects (Proposal #10).
□ Use a two-stage randomization design (Muralidharan & Sundararaman, Reference Nosek, Spies and Motyl2015).
Policymakers/practitioners
□ Generalizability of the environment. As a first step, review the accumulated science regarding the BC measure of the program you are considering.
□ How do the characteristics of the population and situation from those evaluations differ from those of your policy-relevant environment? The closer the characteristics of the environment, the more likely the results will scale.
□ Identify the areas that will need particular attention.
□ For the scale up, involve the original scholars on the implementation team to identify and address the different potential sources that threaten scalability (Proposal #7).
□ Understand negotiables and non-negotiables in the scaling process (Proposal #8).
□ When policymakers are evaluating outcomes from research studies, they must understand the characteristics of the situation in which the RCT was implemented and how close those characteristics are to those of the policy-relevant situation.
□ It is easier to scale programs that change only one component at a time.
□ As a rule of thumb, use of technology allows better control of standardization, correct dosage, correct programs, etc. (Proposal #6).
□ Inference. For this, we recommend that policymakers work closely with researchers or in-house researchers. Policymakers should adopt a Bayesian framework and use RCTs to update their priors about the efficacy of a policy. When considering new policies based on research findings, they need to take into account the three P's to thoroughly evaluate the evidence for the policies. In particular:
□ Be explicit about prior beliefs.
□ Do not rely on statistically significant results from only a single study.
□ Ignore results from low-powered studies.
□ Carefully interpret results from evaluations. Be discerning and skeptical of accepting ‘statistically significant’ results from experimental studies at face value.
□ Do not make policy decisions based on only one evaluation study. Wait to implement a program at scale until the PSP (e.g., the belief that a program is efficacious) is above 0.95.
□ Population and situation. Policymakers evaluating outcomes from research studies must pay particular attention to the characteristics of the population sample in the RCT and analyze whether those characteristics are representative of their policy-relevant population.
□ Scalability of costs. Analyze how the participation and implementation costs will change in your policy-relevant environment.
□ Are there any potential source of economies/diseconomies of scale in these costs?
□ In other words, leverage existing infrastructure, favor programs that rely on technology, etc., because the cost component of the BC ratio is likely to remain constant at scale (i.e., the cost per unit).
□ Not just benefits, but also costs. Research studies that evaluate programs emphasize the importance of high fidelity of the implemented program, delivered effectively at the correct dosage to maximize benefits.
□ Ensuring high fidelity in implementation entails costs, so focus on the trade-off between benefits and costs.
□ Why does a program work? Understand why a program works (i.e., how program activities are related to program outcomes). Go beyond a simple A/B testing.
□ Understand the underlying theoretical mechanisms behind the program to inform whether the BC profile can be sustained at scale in a different environment
Funders
When funding experimental program evaluations, explicitly take into account the threats to scalability and how the experimental results would help policymakers to make more informed policy decisions.
□ What do we know so far and what can we learn? Ask researchers to state their beliefs about the efficacy of the program to be evaluated (i.e., prior) and how the data generated by the study will change this prior.
□ In the larger frame of learning the efficacy of a program, replication of experiments provides key information. The value of funding replications should not be underestimated.
□ Pre-registration. Ask researchers to pre-register the experiment, detailing the research design and the statistical analyses to be performed.Footnote 28
After scaling
As aforementioned, we view the chain from original research to policy as having three major links: (1) funding basic research; (2) providing the knowledge creation market with the optimal incentives for researchers to design, implement and report scientific results; and (3) developing a system whereby policymakers have the appropriate incentives to adopt effective policies and, once adopted, to develop strategies to implement those policies with rigorous evaluation methods to ensure continual improvement.
Our work focuses on the middle link. Recent work around sustainable interventions (e.g., Chambers et al., Reference Chambers, Glasgow and Stange2013; Komro et al., Reference Kushman, Hanita and Raphael2016) highlights the importance of the third link, and work in the area of the economics of charity (e.g., List, Reference List2011a) focuses on the first link. While a new economic model for these other areas is beyond the scope of this study, we do have thoughts on the treatment measurement of a program once it is actually scaled. This leads to our final proposal:
■ Proposal #12: When the program is actually scaled, the correct empirical approach should be taken to measure efficacy, and continuous measurement should be a priority.
The gold standard for learning about the scale-up effect is to run an RCT at scale. Accordingly, our view is that a first best approach to estimating the effects of the program at scale is to perform a large-scale RCT. One can then compare these estimates with the results from the original studies to explore efficacy at scale.
If this approach is untenable, then it is critical to adopt an empirical approach that allows stakeholders to measure its efficacy without unrealistic assumptions. While an exhaustive summary of such approaches is beyond the scope of our work, we point the interested reader to List (Reference List2007a), who discusses various empirical approaches to policy evaluation as an empirical spectrum, which includes examples of econometric models that make necessary assumptions to identify treatment effects from naturally occurring data. Some of these approaches, such as interrupted time series designs or regression discontinuity analysis, can get quite close to addressing the internal validity problem that RCTs solve. The myriad of approaches to examining naturally occurring data each invoke their own assumptions, and the analyst should use their judgment of what data generation process makes the most sense in the particular environment of interest.
Within this empirical spectrum, quasi-experiments can be interpreted as a midpoint between data generated from experiments and naturally occurring data. In quasi-experiments, identification results from near-random processes (i.e., not directly controlled by the researcher) as opposed to true randomization into treatment and control groups in experiments. Consider a statewide evaluation of a reading support curriculum for fifth graders in which the state government has decided to implement the curriculum only in schools where a simple majority of parents support it and have enough budget to cover the costs. Given this rule, although true randomization by researchers is untenable, a quasi-experiment would leverage it to mimic random assignment by narrowing the sample to schools where the voting results were just below or above simple majority. In this quasi-experimental setup, the causal inference is still not clean because identification comes from the critical assumption that the groups on either side of the simple majority are comparable. However, when true randomization is not possible, too costly or unethical, naturally occurring data from quasi-experiments should be considered if the particular environment is appropriate.
Epilogue
Experimentation has represented the cornerstone of the scientific method since Galileo pioneered the use of quantitative experiments in the seventeenth century, allowing him to test his theories of falling bodies. In the centuries since, experimentation has uncovered the foundations of life, the universe and nearly everything in between.
Much like the physical sciences, the empirical gold standard in the social sciences is to estimate a causal effect. Yet, amidst the complexity of the real world, economists have long worked on approaches that seek to separate cause and effect using regression analysis with naturally occurring data. But economists have now taken to heart the old maxim that ‘correlation does not imply causation’, and in recent decades they have sought out a variety of other empirical approaches.
One such alternative that economists have turned to is the experimental model of the physical sciences. Early experimentation was in the lab, where volunteers made economic decisions in a controlled environment (see, e.g., Smith, Reference Stanley, Doucouliagos, Giles, Heckemeyer, Johnston, Laroche and Rosenberger1962; Fiorina & Plott, Reference Fiorina and Plott1978). Over the past few decades, economists have increasingly made use of field experiments to explore economic phenomena, in which they combine realism and randomization to test theories and estimate treatment effects (see, e.g., Harrison & List, Reference Harrison and List2004).
The approach of using randomization in the field has proven quite effective, as insights gained across labor economics, social policies, the role of market structures, public economics and nearly every other area have been touched by the field experimental approach. Importantly, in doing so, experimentalists have been able to generate data that test theories, disentangle mechanisms and provide intervention treatment effects for policymakers. While such insights are invaluable, the primary focus in this three-decade movement has been on how best to generate data to test theories and estimate intervention effects.
We view this focus as important, but also as a shortcoming of the extant literature when it comes to informing policy. In this spirit, what has been lacking is a scientific understanding of whether, and to what extent, we should use the experimental insights for policy purposes. In particular, scholars doing the basic science rarely confront the question of whether the research results scale to larger markets or different settings. And what is the science behind those expectations?
We denote this general issue as the ‘scale-up’ problem, and such a discussion naturally leads to understanding the important threats to scalability and addresses what the researcher can do from the very beginning of their scholarly pursuit to ensure eventual scalability. Of course, we are not the first to think about these issues. We are informed by implementation, prevention, translational, economics and public health research (see, e.g., Kilbourne et al., Reference Kline and Walters2007; Gottfredson et al., Reference Gottfredson, Cook, Gardner, Gorman-Smith, Howe, Sandler and Zafft2015; Supplee & Metz, Reference Tuttle, Gill, Gleason, Knechtel, Nichols-Barrer and Resch2015; Supplee & Meyer, Reference Supplee, Kelly, MacKinnon and Barofsky2015). Existing models of scaling emphasize fidelity of implementation and identification of core components, and work thus far has primarily focused on the benefit side, or the ‘voltage drop’.
This study augments extant literature by applying economic tools to quantify and clarify expected changes to benefits and costs when a program is scaled. In this manner, we are effectively changing the discussion from voltage, or purely benefit-driven outcomes, to one in which both benefits and costs are considered. In doing so, 12 proposals naturally result that span researchers, policymakers, funders and other stakeholders.
Together, we view our modest proposals as a start to tackling the most vexing scalability threats. Our framework highlights that there is much work to do, both theoretically and empirically, to deepen our understanding of the scale-up problem. We have only taken but one small step in this process, but we trust that the literature will take several larger steps in the future, allowing us to be on much more solid ground when we argue that scientific experiments should hold a more prominent place in the policy world.
Acknowledgments
We wish to thank Will Aldridge, Nava Ashraf, Jon Baron, Marianne Bertrand, Judy Carta, David Chambers, Jon Davis, Emir Kamenica, Dean Karlan, Scott McConnell, Allison Metz, Adam Oliver, Norbert Rudiger and Lauren Supplee for helpful comments on this research agenda.