


Introduction
Shear-frame stability indices have been used to assess the stability of snow slopes for many years (Reference RochRoch, 1966a; Reference RochSchleiss and Schlciss, 1970). When combined with other forecasting variables such as previous avalanches, snowpack observations and meteorological data, they have the potential to improve avalanche forecasting (Reference JamiesonJamieson, 1995, p. 195–238). The first index for skier-triggering is the Swiss stability index for skiers (Reference Föhn.Föhn, 1987), S', which is defined as the ratio of shear strength of a weak layer (potential failure plane) measured with a shear frame to the slope-parallel shear stress induced by the skier and the weight of the slab.
This paper proposes a refined skier stability index, S k, that increases the proportion of correctly predicted skier-triggered slab avalanches based on results from 115 skier-tested slabs in the Columbia Mountains of western Canada. The refinements comprise an adjustment for normal load that depends on the microstructure of the active weak layer and an adjustment to the skier-induced stress that allows for ski penetration into the slab and consequently increases the skier-induced stress at the weak layer.
Since skiers accounted for 50% of avalanche fatalities in Canada between 1978 and 1996 (Reference Jamieson and GeldsetzerJamieson and Geldsetzer, 1996, p. 9), an index that increases the proportion of correctly predicted skier-triggered slab avalanches has the potential to improve forecasting and reduce the number of skiers caught in avalanches.
Literature Review
Shear-Frame Technique
To determine the strength of a weak layer with a shear frame, all but a few centimetres of the overlying snow are remOved. The remaining snow is gripped by pushing the shear frame to within a few millimetres of the weak layer. The frame is manually pulled, parallel to the weak layer, with a gauge that records the maximum force (e.g. Reference SommerfeldSommerfeld, 1984; Canadian Avalanche Association, 1995). The shear strength is the maximum force divided by the area of the frame. Experimental factors affecting the results of shear-frame tests have been analyzed by Reference Perla and Beck.Perla and Beck (1983) and Reference JamiesonJamieson (1995, p. 65–106).
Effect of Normal Load on Shear Strength
The shear-frame technique requires that most of the snow above the weak layer be removed, thereby reducing the normal load on it during the test. By placing weights on the frame, Reference RochRoch (1966a) and Reference Perla and Beck.Perla and Beck (1983) measured an increase in shear strength with an increase in normal load (Fig. 1). Since shear-frame tests pulled to failure within 2.5 s result in brittle failures (Reference Föhn and CamponovoFöhn and Camponovo, 1997), this effect is not the “internal friction” associated with ductile failures. Furthermore, the mechanism by which increased normal load affects shear-frame results is not well understood (Reference Perla and Beck.Perla and Beck, 1983).
Effect of normal load on strength from previous shear-frame studies. The ordinate shows the Daniels strength since Reference RochRoch (1966a) used a 0.01 m2 frame and Reference Perla and Beck.Perla and Beck (1983) used a 0.025 m2 frame.

The shear strength adjusted for normal load,  , is calculated from the shear strength measured with the shear frame, Ʃ(Reference RochRoch, 1966a)

where z is measured from the snow surface normal to ihe slope,  is the normal load adjustment and the normal load is

where ρ is the average slab density, g is the acceleration due to gravity, h is the slab thickness measured vertically and  is the slope inclination.
Reference RochRoch (1966a) determined empirical equations for the normal load adjustment for various microstructurcs of weak layers:


where Σ100 is the shear strength measured with a 0.01m2 shear frame.
Effect of Frame Size on Shear Strength
The shear strength measured with a shear frame tends to decrease with an increase in the area of the frame (Reference SommerfeldSommerfeld, 1973, Reference Sommerfeld1980; Reference Sommerfeld, King and BuddingSommerfeld and others, 1976: Perla, 1977; Reference Sommerfeld and KingSommerfeld and King, 1979; Reference Föhn.Föhn, 1987; Reference JamiesonJamieson, 1995, p. 81–83). To develop shear-frame stability indices that are independent of the frame size, the measured shear strength is adjusted to the shear strength of an arbitrarily large failure area known as the Daniels strength, based on an asymptotic relationship between measured strength and frame size (Reference SommerfeldSommerfeld, 1973; Reference Sommerfeld1980; Reference Sommerfeld, King and BuddingSommerfeld and others, 1976; Reference Sommerfeld and KingSommerfeld and King, 1979). Using Reference Föhn.Föhn's (1987) compilation of previous studies, the Daniels strength can be calculated from the shear strength measured with 0.01 and 0.025 m2 frames as
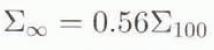
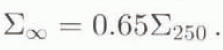
Adjusting Reference RochRoch's (1966a) Equations (3a) and (3b) to Daniels strength, gives

for precipitation particles, and

for rounded grains. In subsequent sections. Equation (5b) is also used for decomposed and fragmented precipitation particles.
Neither Reference RochRoch (1966a) nor Reference Perla and Beck.Perla and Beck (1983) provided any results for the effect of normal load on layers of buried surface hoar or facets which are very important to avalanche forecasting in western Canada (Reference Jamieson and JohnstonJamieson and Johnston, 1992).
Stability Indices
Shear-frame stability indices are based on the ratio of the shear strength to the shear stress in the weak layer
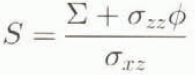
where x is measured along the surface and  is the shear stress in the weak layer due to the weight of the overlying slab

Stability indices used by previous investigators vary depending on whether they include the stress due to artificial triggers, adjusted for normal load due to the slab or adjusted for frame size. The early attempts to develop stability indices (Roeh, 1966b Reference PerlaPerla, 1977; Reference Sommerfeld and KingSommerfeld and King, 1979) did not compare the index values for slopes that had avalanched with slopes that had not, and did not discriminate between index values for natural, skier and explosive triggering.
Reference Conway and AbrahamsonConway and Abrahamson (1984) used a different shear-Grame technique based on isolating a vertical column of snow and embedding the shear frame on top of the column, which in some cases was over 1 m above the weak layer. While this technique includes the inherent effect of normal load on the weak layer, pulling the frame down-slope superimposes substantial bending stress on the shear stress in the weak layer. Tests near eight slab avalanches yielded Stability indices that averaged 1.57 with a standard deviation of 1.29 in contrast to 18 slabs that did not avalanche where the stability index av eraged 4.25 with a standard deviation of 2.78. This was the first comparison of stability indices on slopes that did and did not avalanche, and the results indicated the merit of stability indices for discriminating between stable and unstable slopes.
Fohn (1987) combined Reference RochRoch's (1966a) normal load adjustment for rounded grains with Reference Sommerfeld and KingSommerfeld and King's (1979) size correction and added an artificially induced stress.  , into the denominator of the strength/stress ratio to obtain an index for artificially triggered avalanches

One concern with this index arises from the rate sensitivity of snow. The terms  and
 involve rapid loading, whereas the stress due to the slab,
 , is a static load.
By assuming isotropy and linear elastic behaviour and ignoring deviatoric stress gradients, Föhn derived the skier-induced shear stress

where R is the line load due to a skier (500 N m−1) and  is the angle from the snow surface to the peak shear stress (Fig. 2) tabulated by Reference Föhn.Föhn 1987; for common values of
 . For a skier on a 38¶ slope.
 , simplifies to 0.147/hkPa where h is in metres. Schwcizers (1993) finite-element model verified Reference Föhn.Föhns (1987) formula for
 . Using S' for artificially lriggered slabs and a variation, S, with
 for natural avalanches, Föhn rated the combined “success” of S and S' for discriminating between snow slopes that had and had not avalanched. S or S' is rated successful when the index is less than 1 and the slab released, or is greater than 1.5 when the slab did not release. Values of S or S' between 1 and 1.5 were considered to indicate transitional stabilily and were excluded from the success score. The sueccess score for S or S' for 110 avalanche slopes was 75% (Reference Föhn.Föhn, 1987).
Cross-section of slab showing x and z coordinate axes, depth of weak layer, h, slope angle,  , and location of peak shear stress induced by skier (after Reference Föhn.Föhn, 1987).

In their stability indices, Reference Föhn.Föhn (1987) Reference RochRoch (1966b) and Reference Jamieson and JohnstonJamieson and Johnston (1993, Reference Jamieson and Johnston1994) applied Roch's normal load correction for rounded grains (Equation (3b)) or the analogous equation for Daniels strength (Equation (5b)) to all weak layers, independent of their microstructure.
Field Studies
Effect of normal load on shear strength
During the winters of 1995 and 1997, shear strength was measured at various normal load levels for five persistent layers and one non-persistent layer (Table 1). For each layer, 4–14 shear-frame tests were made in a level study plot using a 0.025 m2 shear frame unweighted and with weights of mass 0.3, 1.0, 3.0 and, in one case, 6.0 kg placed on top of the shear frame.
Effect of normal load on the Daniels strength.

The resulting mean Daniels strengths are shown in Table 1 and plotted against the normal stress in Figure 3.
The normal stress is calculated from the added weights and does not include the mass of the frame and the snow in the frame which typically totalled 0.4 kg.
Measured and predicted effect of normal load on Daniels strength. Measured effect is shown by solid lines. Effect predicted by Equation (5b) is shown by dashed lines.

For the persistent layers labelled 94-12-16, 95-03-29 and 97-02-27a in Table 1, the increase in strength is comparable to the standard errors, while for the persistent layers labelled 95-03-03 and 97-02-27b, the increase is less than predicted by Equation (5b). This is in contrast to the increase reported by Reference RochRoch (1966a) for depth hoar which is also a persistent weak layer. Since our tests on three of five persistent layers show no significant increase and the tests on the other two layers show an elfect less than predicted by Equation (5b), we assume  for persistent layers in the subsequent section on refinements to the stability index.
The non-persistent weak layer of decomposed and fragmented precipitation particles tested on 95-03-30 shows a 0.55 kPa (31%) increase in strength that is consistent with Equation (5b) (Fig. 3). Also, Reference RochRoch (1966a) and Reference Perla and Beck.Perla and Beck (1983) reported substantial normal load effects for a total of six non-persistent weak layers (Fig. 1). Since seven of seven non-persistent layers show normal load effects, we use Reference RochRoch's (1966a) normal load adjustments (Equations (5a) and (5b)) for non-persistent layers in the subsequent section on refinements to the stability index.
Ski Penetration
One of the assumptions inherent in Equation (9) is that the effect of ski penetration into the slab on the skier-induced stress,  and consequently on S' is negligible. However, ski penetration into the soft, low-density snowpack typical of the Columbia Mountains in western Canada is typically 0.3 m. Since ski penetration during skiing, P
k results in the skis being
 above the weak layer compared with h in Equation (9), the skier-indueed stress is increased by a factor
 to

The effect of the adjustment for ski penetration on combined shear stress due to the slab and skier,  , is shown in Figure 4 for penetrations of 0.0, 0.2 and 0.4 m in which
 for a slab of thickness h is calculated

where the density at depth v (measured vertically) is  which is typical of the Columbia Mountains. For weak layers within 0.7 m of the surface, such penetrations substantially increase the total shear stress on the weak layer, indicating the relevance of adjusting S' for ski penetration.
Shear stress due to slab,  , (solid line) and combined stress due to slab and skier,
 (dashed lines) for ski penetrations, PK, of 0, 0.2 and 0.4 m.

Ski penetration during skiing, P k, cannot readily be measured since it depends on the weight of the skier, the area and stiffness of the skis as well as the skiing technique. Hence, we evaluated methods of estimating it for an average skier. Estimation based on the resistance profile of hand hardnesses (Reference ColbeckColbeck and others, 1990) was considered but this would have required additional measurements involving an ordinal measure of hardness. Since the snow slabs in the Columbia Mountains typically consist of precipitation particles, decomposed and fragmented precipitation particles and rounded grains, for which strength increases with density Reference Jamieson and JohnstonJamieson and Johnston, 1990), we chose to estimate ski penetration from slab density which is available from measurements of slab weight per unit area (load) and slab thickness,which are already required for indices such as S'.
Estimating Ski Penetration from Slab Density
In the deep snowpack of the Columbia Mountains, field observations show that snow density usually increases with depth, although some wind slabs are exceptions to this generalization. Assuming a linear increase of density with depth, the density at depth v is
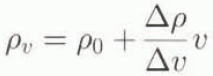
where  is the density at the surface. This assumption of linearity was assessed using density profiles from the Columbia Mountains. From 128 profiles at least 0.5 m deep that were observed during the winters of 1993–95, there were 45 with mean slab density less than 160 kg m−3 and 42 with mean slab density greater than 200 kg m−3. For each of these groups of slabs, the densities are averaged at increments of 0.1 m between 0.1 and 0.6 m as shown in Figure 5. Increases in density with depth appear linear and linear regressions yield
 for the low-density slabs and 167 kgm −4 for the high-density slabs. Since
 shows little dependence on mean slab density, a nominal value of
 is subsequently used for all slabs.
Profiles of average density for high- and low-density slabs from the Columbia Mountains.

Since the mean slab density, ρ, of an idealized slab occurs at 

Using  from Equation (12) and evaluating Equation (13) at
 , which is typical of maximum penetration during skiing, the density 0.3 m below the surface is estimated

where the mean slab density, ρ, is obtained from the load (slab weight per unit area),  , measured with core samples or a density profile.
As part of a study of rutschblock tests (Reference JamiesonJamieson, 1995, p. 159–181), measurements of ski penetration were obtained after gently stepping on to previously undisturbed snow, and after two jumps on the same spot. The mean of these two measurements is taken as the maximum penetration during skiing, P k. Measurements were taken between the skis near the boots with skis mostly 65–70 mm wide and 1.8–2.0 m long, and skiers of mass 55–90 kg.
Values of P
k from 233 slabs in the Columbia Mountains are plotted against mean slab density and the density estimated at 0.3 m in Figure 6. Since ski penetration approaches zero for very dense slabs and becomes very large as snow density approaches zero, we regressed ski penetration, P
k, on the reciprocals of mean slab density  and on estimated density at a depth of 0.30 m
 . The latter regression,
 is a better fit to the data and is used subsequently to calculate a stability index that adjusts for ski penetration.
Skiing penetration, Pk for mean slab density, ρ, and estimated density at 0.3 m, ρ30.

Assessing Skier Stability Indices
To relate stability indices to avalanche activity on avalanche slopes, we tested each failure plane or potential failure plane 7–12 times with the shear frame at a site judged typical of the start zone after the slope was skier-tested. Shear frames were pulled rapidly, resulting in failures in the weak layer within 1 s, which is well within the brittle range (Reference Föhn and CamponovoFöhn and Camponovo, 1997). Coefficients of variation within each set of 7–12 tests averaged 0.17.
In a few cases, in which the slab did not fail, there were two weak layers. When time permitted, both layers were tested, resulting in two data points for the same slope on the same day. A total of 115 weak layers were tested and classified as persistent or non-persistent according to their crystal type.
The Swiss stability index for skier triggering
The slab thickness in the start zone h is plotted against S' (Equation (8)) calculated for 83 persistent slabs (square symbols) and 32 non-persistent slabs (circular symbols) in Figure 7. Slabs that failed are marked with filled symbols and slabs that did not fail are marked with unfilled symbols. Symbols indicating slabs that were remotely triggered from a distance of at least 50 m from the displaced slab are surrounded by a square.
Slab thickness in start zone, h, and skier stability index, S' for skier-tested avalanche slopes. (Slabs triggered from more than 50 m away from the displaced slab are marked with square around the symbol.)

Within the unstable range  of the persistent slabs and 71 % (10/14) of the non-persistent slabs failed. Within the band of transitional stability used by Reference Föhn.Föhn (1987),
 of the persistent slabs and 42% (5/12) of the non-persistent slabs failed. In the stable range,
 of the persistent slabs and 0% (0/6) of the non-persistent slabs failed. For persistent weak layers, the proportion of slabs that failed decreased from 84 to 63 to 31 % for the unstable, transitional and stable ranges, respectively. For non-persistent weak layers, the proportion of slabs that failed decreased from 71 to 42 to 0% for the unstable, transitional and stable ranges, respectively. These decreases in the proportion of slab failures for increasing values of a stability index are measures of the effectiveness of the index.
Prediction errors are defined as false unstable if the stability index < 1 and the slabs did not fail when skier-tested, or false stable if the stability index > 1.5 and the slab was skier-triggered. In terms of prediction errors, there were 16% (5/32) false unstable predictions for persistent slabs and 29% (4/14) for non-persistent slabs. Also, there were 33% (10/32) false stable results for persistent weak layers and none (0/6) for non-persistent layers. These proportions of predictive errors are similar to the 25% reported by Reference Föhn.Föhn (1987) for slabs with various triggers. This shows that Föhn's study is repeatable and that skier-stability indices such as S' are effective in the Columbia Mountains snowpack and in the Swiss Alps, despite differences in climate and snowpack.
While both false stable and false unstable results are prediction errors, it is more important to minimize false stable results than false unstable results, since false stable predictions have far greater consequences and costs (e.g. serious accidents, medical costs, legal fees, etc.) than false unstable results which only result in stable slopes being avoided and, at worst, skier dissatisfaction.
Refinements to the Skier Stability Index
We define the microstructure-dependent normal load adjustment  as zero for persistent weak layers, as given by Equation (5a) for weak layers of precipitation particles and by Equation (5b) for weak layers of decomposed and fragmented precipitation particles or rounded grains. Using
 and the stress term adjusted for ski penetration,
 . (Equation (10)) in Equation (7), a modified stability index for skier triggering is obtained

When the maximum ski penetration exceeds the slab thickness  is defined to be 0, since the weak layer will be highly stressed when the skis approach the weak layer during the skier's up and down motion.
The slab thickness in the start zone, h, is plotted against S
k in Figure 8 for the same 83 persistent (square symbols) and 32 non-persistent slabs (round symbols) used to assess S in the previous section. Within the unstable range  of the persistent slabs and 63% (152 /24) of the non-persistent slabs failed. Within the band of transitional stability,
 of the persistent slab and none (0/5) of the non-persistent slabs failed. In the stable range,
 and 0% (0/3) of the non-persistent slabs failed.
Slab thickness in start zone, h, and skier stability index, S k, for skier-tested avalanche slopes. (Same symbols as in Figure 7.)

For their unstable, transitional and stable ranges, the predictions based on S k and Sk' are compared in Table 2. In the unstable range, where a higher percentage of slab failures is better, the adjustment for ski penetration decreased the proportion of persistent slabs that failed from 81 to 77%. In the stable range, where a lower percentage of slab failures is better, the adjustment for ski penetration reduced the proportion of persistent slabs failed from 31 to 6%.
Percentage if slabs that failed for skier stability indices, S' and S K

Although the proportion of false unstable predictions for persistent slabs increases from 16% for S' (Fig. 7) to 23% for S k (Fig. 8), the proportion of false stable predictions — which are critical — is reduced from 31% for to 6% for S k.
For non-persistent slabs. 8% fewer slabs fail in S ks unstable range than in the unstable range of S'. No slabs failed in the stable range of either index.
The index S k has two advantages over S'. It is more realistic, physically, since it adjusts for ski penetration and for normal load effects that depend on the microstructure of the weak layer. Also, the number of critically important false stable predictions is substantially reduced for the difficult-to-precdict persistent slabs, with only a small increase in the number of false unstable predictions which have no serious consequences.
Since most of the points for which  (due to P
K exceeding h) resulted in slab failure, skiers appear to be efficient triggers even when the maximum penetration during skiing exiceds the thickness of the slab.
The points for seven dry-slab avalanches that were skier-triggered from more than 50 m away from the avalanche are marked with a surrounding square in Figure 8. Such remotely triggered avalanches have been discussed by Reference JamiesonJamieson (1995, p. 185–94), who argued that a fracture triggered by a skier at a localized weakness can propagate, sometimes to a nearby avalanche slope, and release a dry-slab avalanche where the slab was too stable to be triggered by a skier. Since the snowpack properties at the trigger point can be very different from the average properties in the start zone, S K based on shear-frame tests at a well-chosen site in the start zone will occasionally yield false stable predictions. Such cases illustrate an important limitation of any stability test done where conditions are typical of the start zone, and emphasize that decisions about where or where not to ski should be based on a variety of factors and not simply on one or more stability tests in the start zone.
Further refinements to skier stability indices should he possible by incorporating slab properties (Reference SchweizerSchweizer, 1993; Reference Schweizer, Camponovo, Fierz, Föhn. and Sivardiére.Schweizer and others, 1995; Reference McClung and SchweizerMcClung and Schweizer, 1997) and through better understanding of the normal load effects on rapid shearing of weak layers with various microstructures.
Conclusions
The skier stability index. S', showed predictive merit for 115 skier-tested slabs up to 1 m in thickness in western Canada, indicating that Reference Föhn.Föhns (1987) study is repeatable in an area with differenl snow pack characteristics.
Since no Significant normal load effect was measured for three of five persistent weak layers consisting of surface hoar or faceted crystals, and a reduced effect was measured for the remaining two layers, we propose  for such layers in the skier stability index. A practical method for estimating ski penetration based on measurements of load and slab thickness that were already necessary for S' is presented. Incorporating ski penetration and the proposed normal load adjustment into the formula for S results in S
K which substantially reduces the proportion of false stable predictions for slabs overlying persistent weak layers.
The effectiveness of either S' or S K indicates that the critical stress failure criterion underlying these indices is appropriate for predicting skier-triggered slab avalanches.
Acknowledgements
This study is part of an ongoing Collaborative Research and Development Project funded by the B.C. Helicopter and Snowcat Skiing Operators Association and the Natural Sciences and Engineering Research Council of Canada. Two members of the Association, Canadian Mountain Holidays and Mike Wiegele Helicopter Skiing provided logistic support and a productive environment for field studies. For their field work, during the period 1990–97, we are grateful to J. Hughes, L. Allison, K. Black, J. Blench, A. Cooperman, J. Filippone, T. Geldsetzer, S. Gould, B. Gould, G. McAuley, R. McGowan, S. Lovenuik, M. Shubin, A. Wilson and avalanche safety staff from Yoho, Glacier, Jasper and Banff National Parks, and B.C. Ministry of Transportation and Highways at Kootenay Pass. Also, our thanks are due to R. Lang for her review and to P. Föhn, J. Schweizer and C. Camponovo for helpful discussions on skier triggering.



